Who Spends the Most on Lobbying: Corporate Capital Allocation and Federal Policy Influence
An empirical audit of public Lobbying Disclosure Act (LDA) records revealing the top corporate spenders, trade associations, and industry sectors allocating billions to influence federal policy, tax legislation, and government procurement budgets.
When market participants ask who spends the most on lobbying in the United States, the empirical public record reveals an aggressive concentration of corporate capital directed toward Capitol Hill and federal regulatory agencies. Each fiscal year, over $4.26 billion in statutory lobbying expenditures flows through official filings maintained by the Senate Office of Public Records (SOPR) and the Clerk of the House under the Lobbying Disclosure Act (LDA) of 1995. This continuous capital deployment is not distributed evenly; instead, a select cluster of mega-cap technology corporations, defense contractors, pharmaceutical alliances, and multi-industry trade associations account for a disproportionate share of total influence expenditures.
Tracking these public records is no longer merely a civic exercise; for systematic investors and institutional analysts, monitoring lobbying expenditure velocity provides early visibility into regulatory shifts, appropriations carve-outs, and agency procurement allocations. By monitoring our real-time corporate lobbying intelligence tracker, quantitative researchers systematically correlate Form LD-2 quarterly expense filings with public procurement databases and committee hearing agendas.
Which Companies and Organizations Spend the Most on US Lobbying?
The statutory public records filed under 2 U.S.C. § 1604 establish two primary categories of lobbying spenders: multi-client trade associations and individual corporate entities. Leading the entire public ledger for more than two decades is the US Chamber of Commerce, which routinely deploys over $69.5 million annually across hundreds of itemized legislative bills, regulatory dockets, and tax provisions. Following the Chamber, major industry associations include the National Association of Realtors (NAR) with annual lobbying budgets exceeding $52.4 million, and the American Hospital Association (AHA) allocating over $29.1 million to federal policy matters.
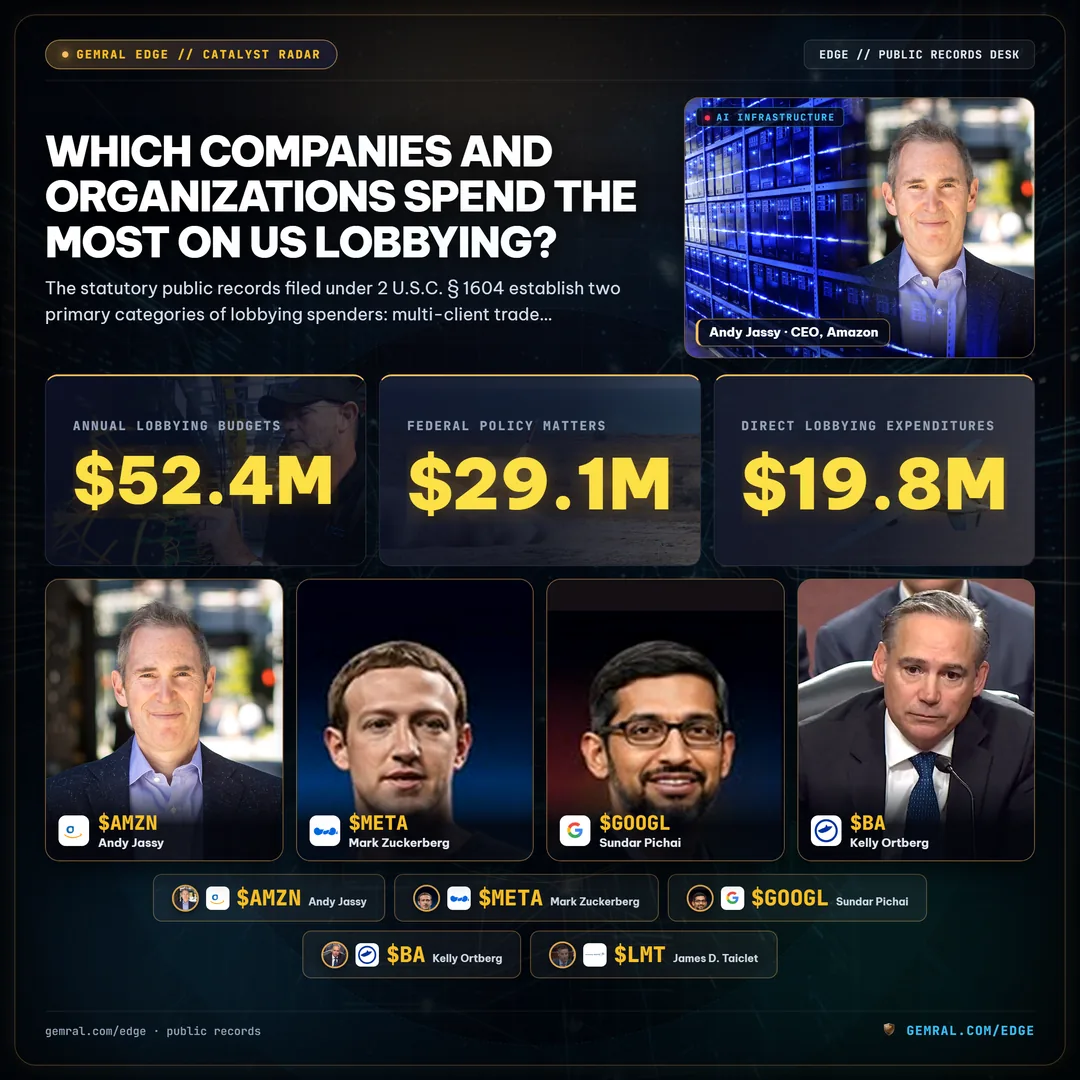
Among individual publicly traded corporations, the technology sector has surpassed historical heavyweights in federal capital deployment. In recent annual filings, Amazon.com disclosed $19.8 million in direct lobbying expenditures, while Meta Platforms deployed $19.3 million, and Alphabet (Google) registered $13.5 million. These technology giants focus lobbying resources on antitrust regulation, artificial intelligence governance, high-skilled immigration caps, and federal cloud computing solicitations.
Concurrently, defense and aerospace prime contractors maintain continuous, high-volume lobbying footprints. The Boeing Company deployed $14.2 million, and Lockheed Martin registered $13.8 million in annual disclosures. Rather than broad ideological campaigns, defense primes deploy capital with pinpoint precision on specific line items within the National Defense Authorization Act (NDAA) and Department of Defense appropriations bills.
Sector Breakdown: Which Industries Allocate the Most Capital to Washington?
Aggregating quarterly LD-2 filings across standard industrial classification codes reveals that capital deployment is heavily clustered within heavily regulated industries where federal policy directly dictates commercial revenue models:
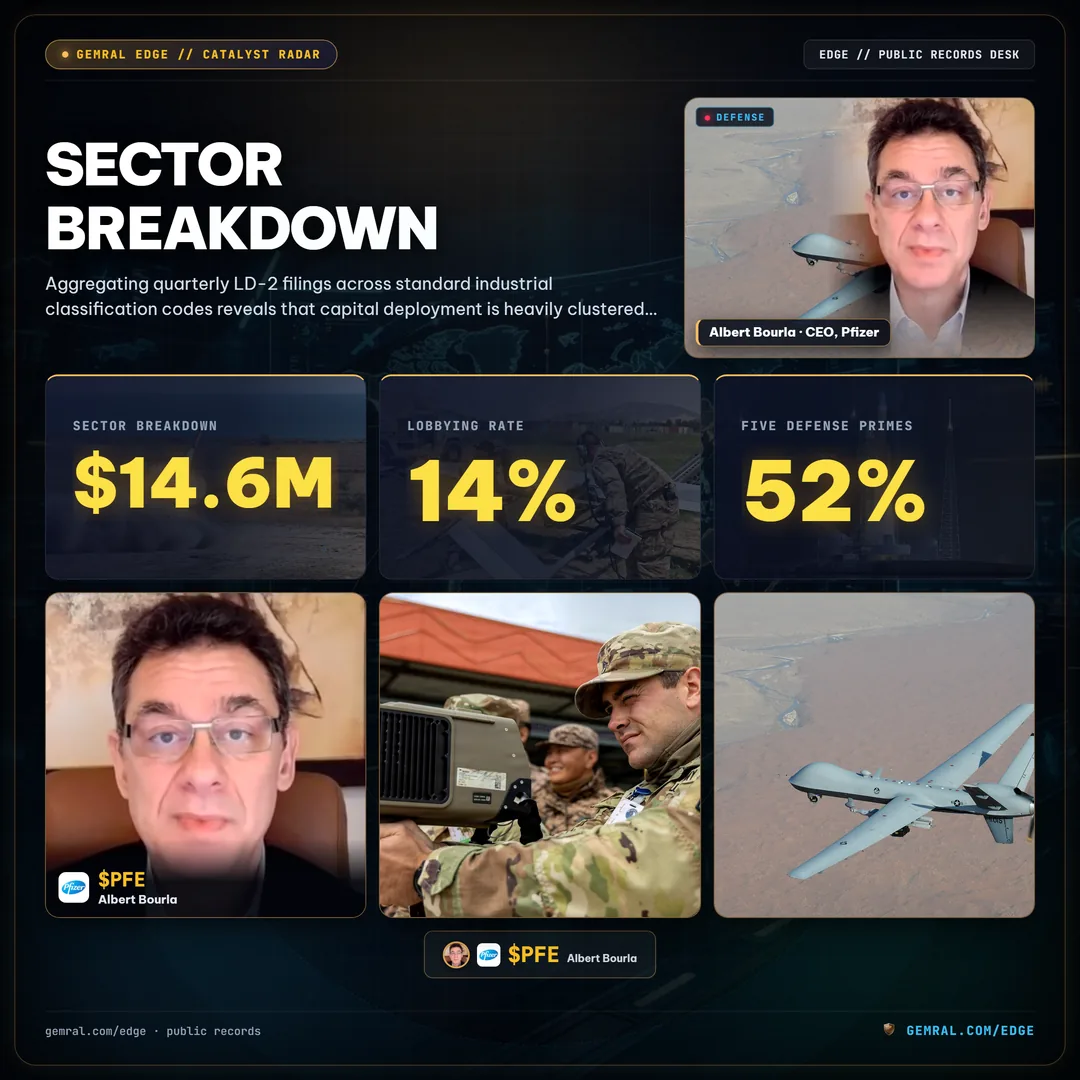
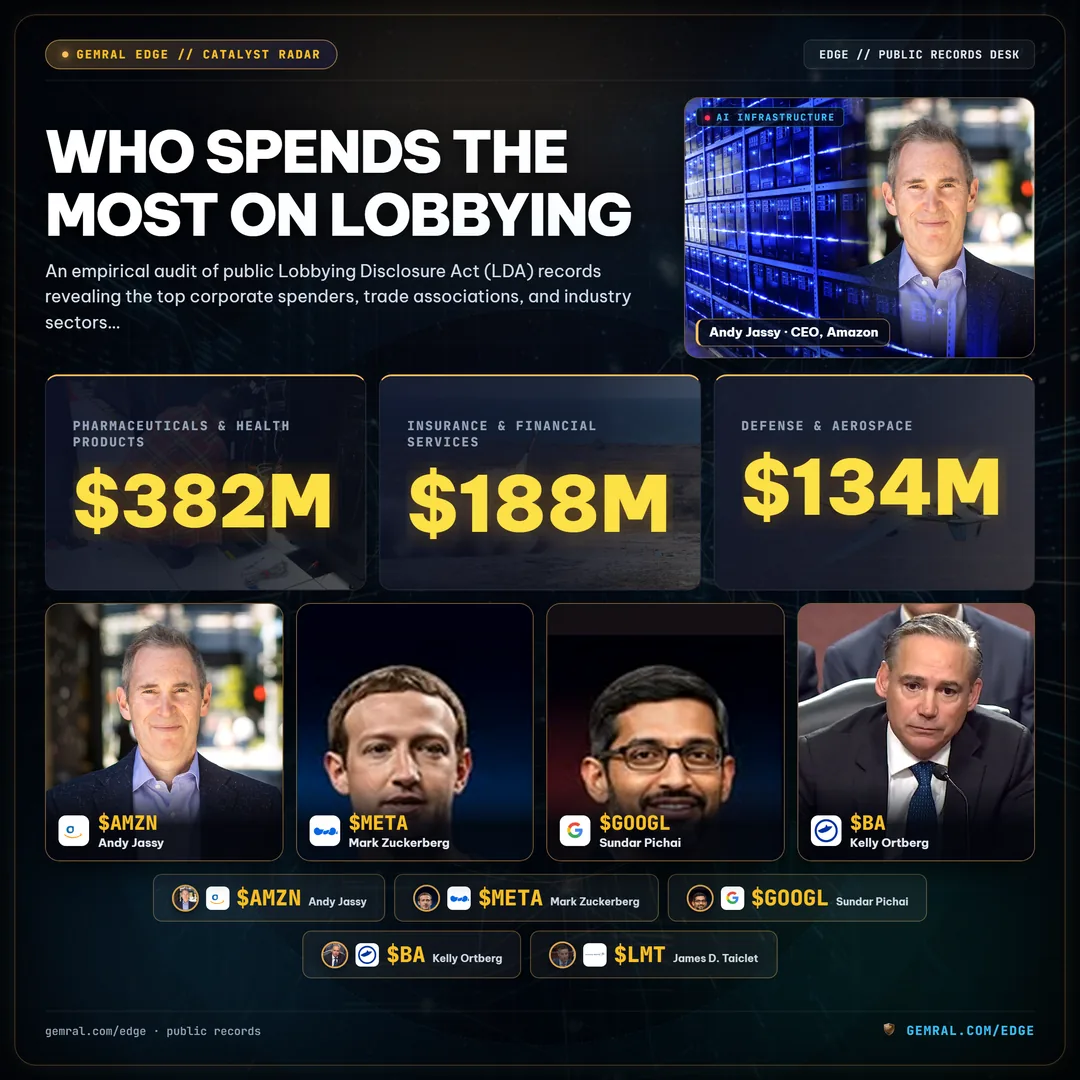
- Pharmaceuticals & Health Products ($382M+ annually): Consistently ranking as the single highest spending sector, pharmaceutical manufacturers and healthcare trade groups deploy capital to influence drug pricing legislation, Medicare reimbursement schedules, and FDA approval pathways. Major individual corporate spenders include Pfizer ($14.6M), Roche Holdings ($12.8M), and Amgen ($11.4M).
- Electronics, Software & Internet Technology ($242M+ annually): Driven by rapid artificial intelligence scaling, data privacy debates, semiconductor manufacturing subsidies, and export control regulations, Big Tech lobbying has expanded at an annualized rate exceeding 14% over the past five years.
- Insurance & Financial Services ($188M+ annually): Commercial banks, private equity lobbies, and insurance conglomerates deploy over $188 million toward capital reserve requirements, Dodd-Frank oversight, and digital asset regulatory frameworks.
- Defense & Aerospace ($134M+ annually): Characterized by high concentration, where the top five defense primes account for over 52% of the sector's total federal lobbying expenditures.
Understanding these sector-level dynamics clarifies that corporate lobbying functions as a structured capital budgeting decision. Organizations allocate capital to Washington when the expected regulatory or budgetary return exceeds the cost of legislative advocacy.
Corporate Lobbying ROI: Correlating LDA Filings with Federal Procurement Awards
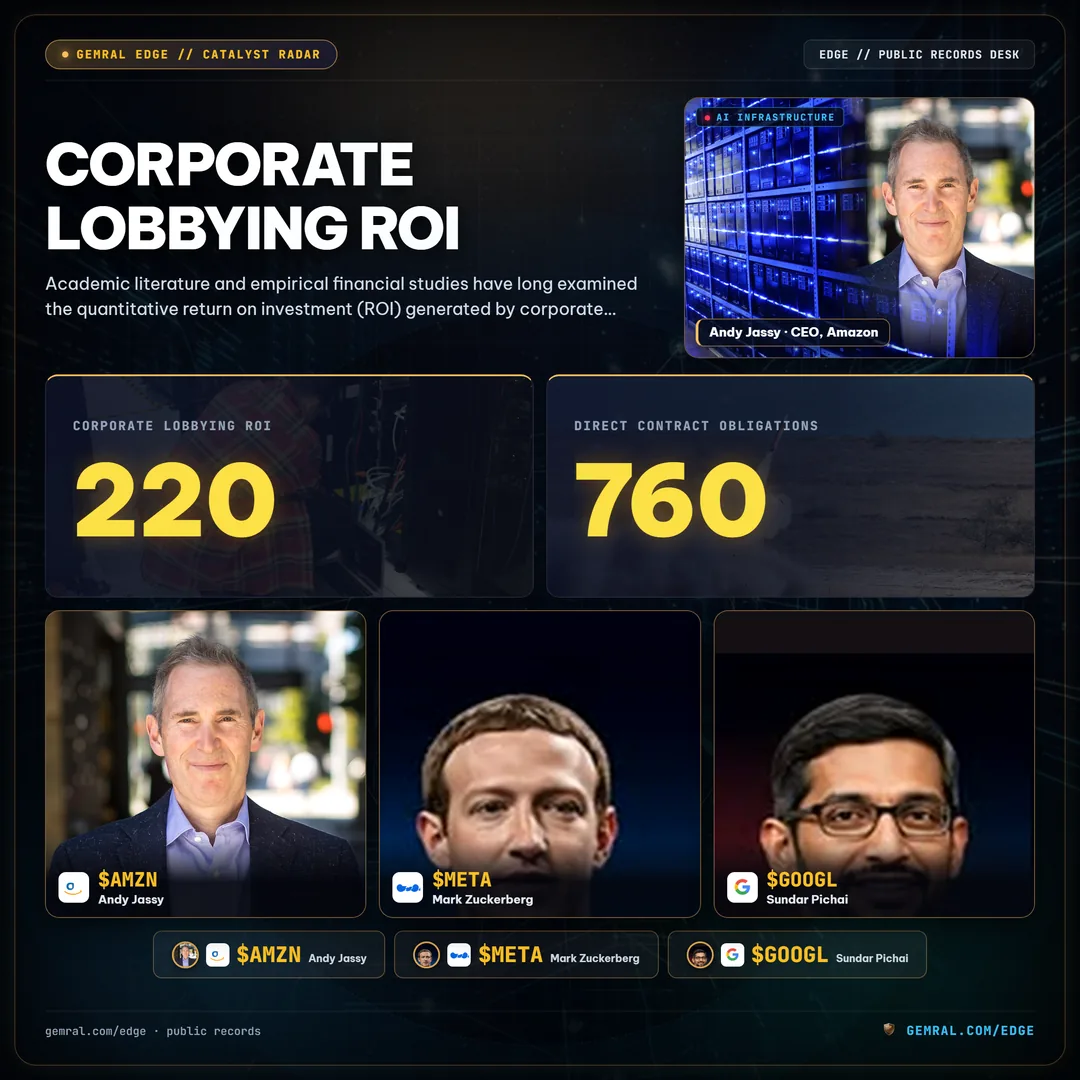
Academic literature and empirical financial studies have long examined the quantitative return on investment (ROI) generated by corporate lobbying outlays. Research analyzing corporate lobbying disclosures alongside federal government outlays demonstrates an asymmetric return profile: across defense, energy, and healthcare sectors, targeted legislative advocacy yields estimated returns ranging from 1:220 to 1:760 in direct contract obligations, loan guarantees, or tax exemptions.
For example, defense contractors that increase their quarterly lobbying expenditure ahead of major House Armed Services Committee markup hearings frequently capture corresponding multi-billion-dollar line items in subsequent procurement tranches. The legal architecture governing these operations is explored in our detailed analysis of how corporate lobbying is legally structured in the United States. When analyzed through point-in-time public records, a sudden surge in an enterprise's quarterly lobbying budget often serves as a reliable leading indicator of pending federal contract actions or major regulatory approvals.
Disclosure Latency: Reading Quarterly LD-2 Filings Before SEC 10-Q Recognition
A critical structural advantage for public record intelligence desks is the disclosure timeline established by federal statute. Under the Honest Leadership and Open Government Act (HLOGA), organizations must file Form LD-2 reports within 20 calendar days following the conclusion of each calendar quarter:
- Q1 Disclosures: Due April 20
- Q2 Disclosures: Due July 20
- Q3 Disclosures: Due October 20
- Q4 Disclosures: Due January 20
Because federal lobbying filings require granular itemization of specific House and Senate bill numbers, executive agencies contacted, and issues lobbied, these disclosures frequently reveal corporate priorities 15 to 45 days before management discusses them on quarterly SEC Form 10-Q earnings conference calls. For an in-depth breakdown of how to audit these regulatory documents, review our operational guide on tracking corporate lobbying filings in Senate disclosure databases.
Systematic Telemetry: Tracking Corporate Lobbying Velocity for Institutional Portfolios
Raw public registries hosted by the Senate and House contain hundreds of thousands of unstructured XML and PDF records, creating complex data extraction hurdles for quantitative researchers. Resolving operating subsidiaries, identifying newly registered outside lobbying firms, and cross-referencing specific statutory bill codes requires specialized data ingestion pipelines.
Institutional quant funds and risk desks ingest normalized, point-in-time legislative feeds to construct proprietary policy momentum signals. Subscribers access complete historical coverage and real-time feeds through the Gemral Edge platform, available across structured tiers: the Pro Tier ($39/month) for individual investors, the B2B Intelligence Tier ($299/month) for multi-seat analyst desks, and the Institutional API Tier ($2,000/month) for quantitative funds requiring low-latency programmatic access. Institutional investors seeking raw historical disclosure tables and cross-referenced entity graphs can explore our specialized alternative data packages.
Frequently asked questions
Who spends the most money on lobbying in the United States?
The US Chamber of Commerce leads all organizations with over $69.5 million in annual lobbying outlays, followed by major industry associations and technology giants including Meta Platforms, Amazon, and Alphabet.
Which industries allocate the highest capital to federal lobbying?
Pharmaceuticals and healthcare products rank first across federal lobbying expenditures, closely followed by the electronics and technology sector, insurance conglomerates, and defense aerospace contractors.
How does corporate lobbying capital correlate with federal contract awards?
Empirical studies reveal an asymmetric policy ROI where every dollar deployed into targeted legislative and regulatory lobbying yields between $220 and $760 in federal procurement awards, tax subsidies, or direct contract authorizations.
Where is corporate lobbying expenditure publicly disclosed?
Under the federal Lobbying Disclosure Act (LDA) of 1995, organizations must file quarterly LD-2 disclosure reports detailing expenditures, specific bill numbers, and targeted government entities with the Senate Office of Public Records and the House Clerk.