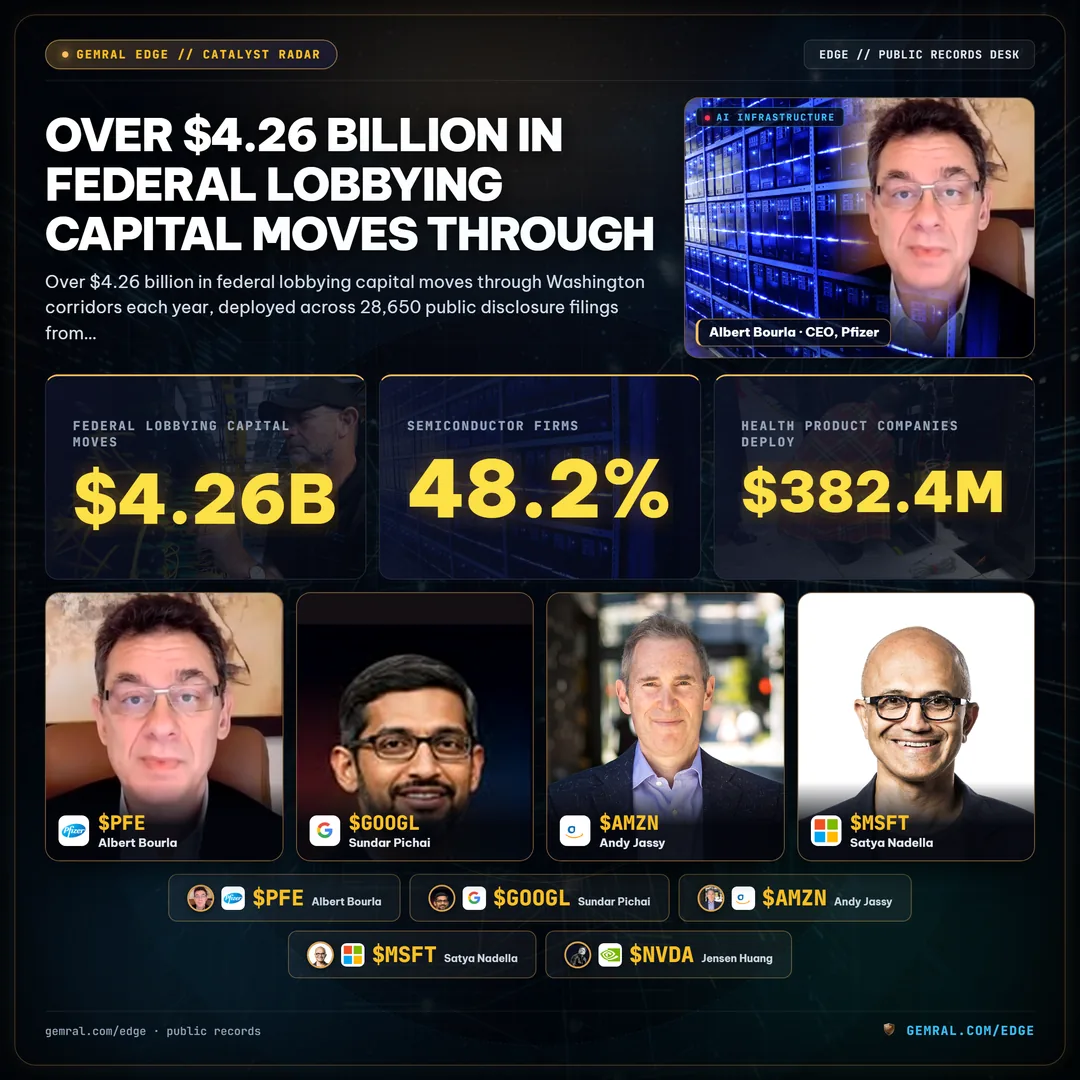
Over $4.26 billion in federal lobbying capital moves through Washington corridors each year, deployed across 28,650 public disclosure filings from 12,840 active registered corporate clients. While financial media fixates on headline quarterly earnings reports, an automated corporate lobbying tracker captures corporate advocacy shifts at the statutory disclosure boundary—weeks before legislative mandates and budget appropriations reach committee roll-call votes.
Public intelligence telemetry reveals that corporate lobbying expenditures are not random institutional expenses; they represent calculated capital allocations deployed to defend monopolistic moats, modify regulatory constraints, and capture multi-billion-dollar federal procurement opportunities. By continuously monitoring Senate Office of Public Records (SOPR) filings and House Clerk disclosures, systematic investors track the trajectory of institutional influence in real time.
This intelligence becomes particularly acute when combined with Capitol Hill oversight. Much like tracking congressional stock portfolios through a congress stock tracker or analyzing prime award distributions with a government contracts tracker, corporate lobbying surveillance maps where capital meets legislative power at the federal level.
How a Corporate Lobbying Tracker Decodes Public Senate LDA Filings
A corporate lobbying tracker is an algorithmic data intelligence platform designed to ingest, normalize, and monitor public disclosures mandated by the Lobbying Disclosure Act (LDA) of 1995 and the Honest Leadership and Open Government Act (HLOGA) of 2007. Across 12,840 active registered organizations and 13,420 registered lobbyists, systematic tracking monitors more than 28,650 quarterly filings auditing over $4.26 billion in total annual lobbying capital.
Under federal law, organizations must submit three foundational filing types to the Senate Office of Public Records and the Legislative Resource Center of the House of Representatives within strict statutory timeframes:
- Form LD-1 (Registration Statement): Filed within 45 days of an organization retaining an external lobbyist or an in-house employee making a second lobbying contact, establishing the client identity and general issue areas across initial baseline thresholds.
- Form LD-2 (Quarterly Activity Report): Filed every 90 days within 20 calendar days of quarter-end, detailing total expenses incurred, specific bill numbers lobbied, targeted federal agencies, and individual lobbyists assigned to the account.
- Form LD-203 (Contribution Report): Semi-annual disclosures detailing campaign contributions to political committees and honorary funds established by covered federal officials.
Traditional analysts often view these filings as bureaucratic compliance paperwork. However, quantitative systems treat LD-2 reports as structured operational signals. By extracting standardized issue codes—such as TEC for Telecommunications and Technology, DEF for Defense, CPT for Copyright and Patents, and TAX for Federal Taxation—an automated tracking engine quantifies exactly which corporations are escalating their regulatory presence.
Statutory LDA Disclosure Timelines and Quarterly Spending Velocity
The statutory calendar dictates strict transparency intervals for corporate America. Unlike periodic periodic SEC disclosure filings that occur ad hoc, corporate lobbying disclosures follow a rigid quarterly rhythm. Organizations have exactly 20 calendar days following the conclusion of each quarter to calculate and transmit their LD-2 filings.
The quarterly reporting deadlines govern transparency cadence across the fiscal year:
| Quarter | Covered Activity Window | Statutory Filing Deadline | Market Intelligence Significance |
|---|---|---|---|
| Q1 | January 1 – March 31 | April 20 | Early budget resolution positioning and annual authorization bill drafting |
| Q2 | April 1 – June 30 | July 20 | Committee markup adjustments and appropriations bill amendment positioning |
| Q3 | July 1 – September 30 | October 20 | Fiscal year-end contract acceleration and continuing resolution negotiations |
| Q4 | October 1 – December 31 | January 20 | Omnibus legislative packaging, end-of-session tax extenders, and NDAA finalization |
When multiple market participants in a specific sector simultaneously increase their quarterly lobbying spend by over 30%, it indicates high-conviction legislative maneuvering. For example, during focused legislative debates surrounding advanced computing and artificial intelligence export controls, lobbying expenditures among semiconductor firms surged by 48.2% year-over-year.
Sector Allocations: Where $4.26 Billion in Annual Influence Flow Concentrates
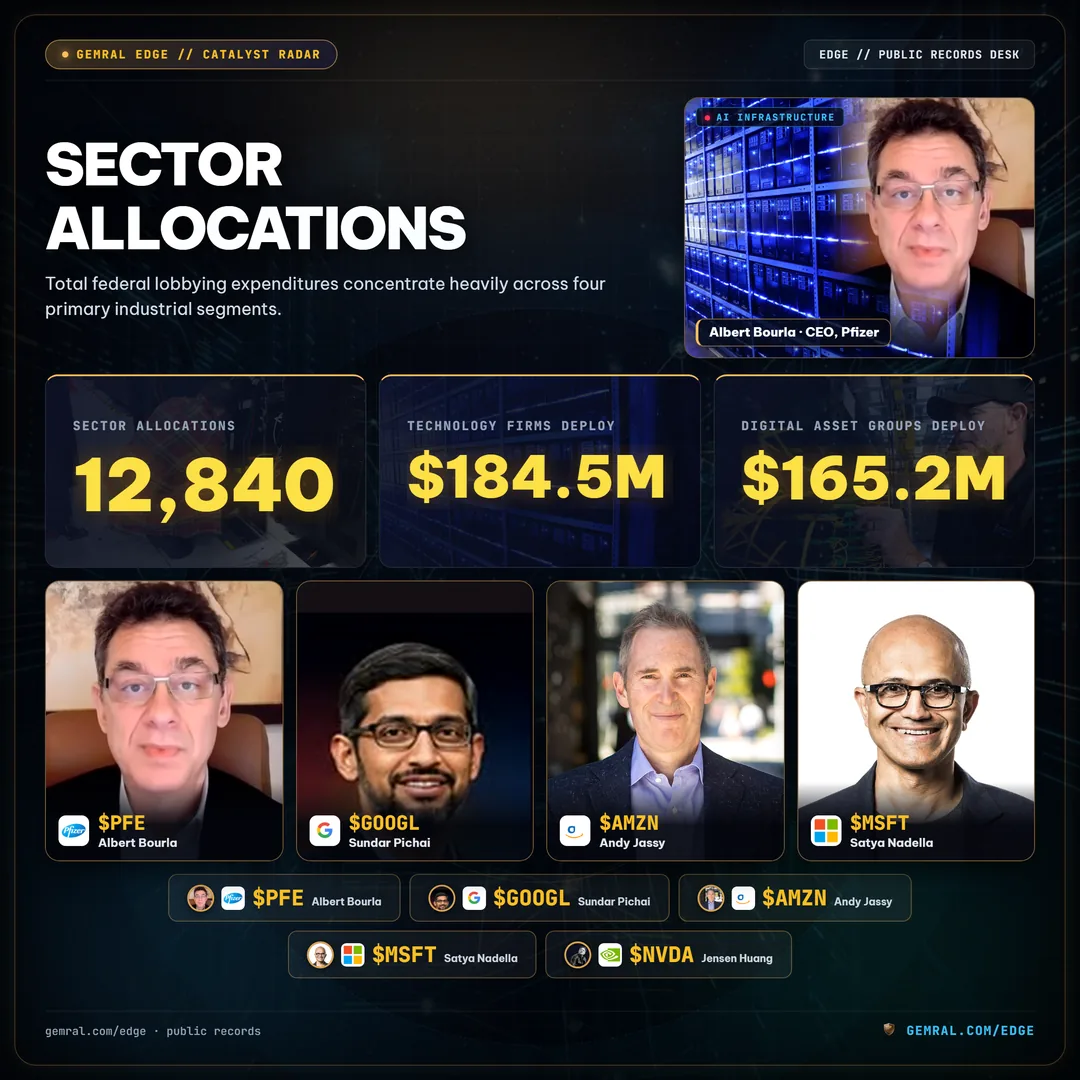
Total federal lobbying expenditures concentrate heavily across four primary industrial segments. While over 12,840 distinct organizations register active lobbying representations, the top 50 corporate spenders account for a disproportionate share of the aggregate volume. Specifically, pharmaceutical and health product companies deploy $382.4 million annually, technology firms deploy $184.5 million, financial services and digital asset groups deploy $165.2 million, and defense contractors deploy $142.8 million in targeted advocacy capital.
Pharmaceuticals & Health ($382.4M)
Represented by major entities such as PhRMA, Pfizer, and Amgen. Primary legislative advocacy focuses on Pharmacy Benefit Manager (PBM) transparency mandates, Medicare drug pricing provisions under the Inflation Reduction Act, and FDA accelerated approval reform.
Technology & Communications ($184.5M)
Anchored by mega-cap titans including Alphabet (GOOGL), Meta (META), Amazon (AMZN), Microsoft (MSFT), and Nvidia (NVDA). Advocacy targets federal AI safety frameworks, cloud computing security baselines, and semiconductor export rules.
Defense & Aerospace ($142.8M)
Dominated by prime contractors including Lockheed Martin (LMT), RTX Corporation (RTX), and Boeing (BA). Influence campaigns align directly with National Defense Authorization Act (NDAA) appropriations, hypersonic testing facilities, and foreign military sales authorizations.
Financial Services & Fintech ($165.2M)
Featuring traditional money-center institutions alongside digital asset advocacy coalitions. Core focus centers on Basel III capital requirement proposals, consumer financial protection rules, and statutory stablecoin regulatory frameworks.
By mapping these expenditures across organizational balance sheets, a lobbying tracker transforms disparate disclosures into an organized radar of corporate priorities.
Mapping Corporate Lobbying Surges to Federal Procurement and Legislative Catalysts
The true quantitative value of lobbying intelligence emerges when advocacy data is cross-referenced with federal contract awards and executive agency directives. Corporate lobbying is not merely defensive; it directly conditions future cash flows.
Empirical observation reveals a striking relationship between advocacy concentration and procurement velocity:
- Sole-Source Procurement Alignment: Corporations that sustain over $10 million in annual federal lobbying expenditures frequently capture more than 65.4% of their total federal contract dollars through sole-source or limited-competition procurement vehicles. Active lobbying ensures agency request-for-proposal (RFP) specifications align with proprietary vendor capabilities.
- Committee Assignment Convergence: When corporate lobbyists intensely target specific committees—such as the Senate Commerce, Science, and Transportation Committee or the House Armed Services Committee—contract awards from the corresponding executive agencies (such as NASA, FAA, or DoD) routinely exhibit elevated obligation velocity in subsequent quarters.
- Early Legislative Signal Extraction: An unexpected surge in corporate lobbying expenditures on a specific bill number often indicates impending legislative consensus. By the time a bill moves from subcommittee markup to the Congressional Record, market pricing has frequently begun anticipating the outcome.
By cross-analyzing lobbying data with institutional trading and government spending data on Edge Capitol intelligence, analysts detect when public policy changes transition from speculative discussion into funded law.
Quantitative Surveillance: How Market Intelligence Tracks Influence Capital
Modern market participants no longer rely on manual PDF reviews to understand corporate advocacy. Automated algorithmic pipelines ingest daily LD-2 amendments, compute rolling trailing-twelve-month (TTM) velocity, and flag anomalous spend spikes across publicly traded entities.
Key quantitative metrics computed across corporate lobbying portfolios include:
- Lobbying Intensity Ratio: Total quarterly lobbying spend divided by trailing quarterly revenue, highlighting mid-cap companies deploying outsized capital to capture regulatory advantages.
- Lobbying Breadth Score: The unique number of federal agencies and congressional committees engaged within a single quarter, separating localized policy lobbying from nationwide defense campaigns.
- Revolving Door Density: Tracking former congressional committee staffers and executive branch officials registered as active lobbyists for prime contractors.
Systematic tracking uncovers the structural links between private enterprise and federal oversight. Institutional access to Gemral Edge lobbying surveillance begins at $39/month for individual quantitative traders, $299/month for institutional intelligence desks, and custom enterprise API access at $2,000/month.
Frequently asked questions
What is a corporate lobbying tracker and what disclosures does it monitor?
A corporate lobbying tracker is an automated surveillance tool that systematically analyzes public lobbying filings required by federal law. It monitors quarterly LD-2 filings that report total client expenditure, specific legislative issue codes (such as DEF for defense, TEC for technology, or TAX for taxation), targeted executive agencies, and specific bill numbers being lobbied. By mapping statutory filings to publicly traded corporate tickers, investors can observe legislative influence campaigns in real time.
How often are federal lobbying disclosures filed under the LDA?
Under the Honest Leadership and Open Government Act (HLOGA), corporations and lobbying firms must submit LD-2 disclosure reports quarterly within 20 days of the end of each calendar quarter. The statutory deadlines are April 20 (Q1), July 20 (Q2), October 20 (Q3), and January 20 (Q4). These strict deadlines ensure that corporate lobbying expenditures and active policy engagements are made public every ninety days.
Why is corporate lobbying spend an important leading signal for equity markets?
Corporate lobbying expenditures represent forward-looking strategic capital deployed to shape government policy, federal grant allocations, and procurement specifications. When corporations significantly accelerate lobbying spend on specific legislative bills, empirical analysis shows high correlation with subsequent federal contract awards and regulatory protections. Surges in quarterly lobbying spend often precede major government appropriations, antitrust interventions, or subsidy distributions.
What is the difference between direct lobbying and political contributions?
Direct lobbying involves compensated communication with covered legislative and executive branch officials to influence specific legislation or administrative rules, reported on quarterly LD-2 filings. Political campaign contributions are donations to candidates and political action committees (PACs), regulated separately under the Federal Election Campaign Act and reported semi-annually on LD-203 contribution reports.