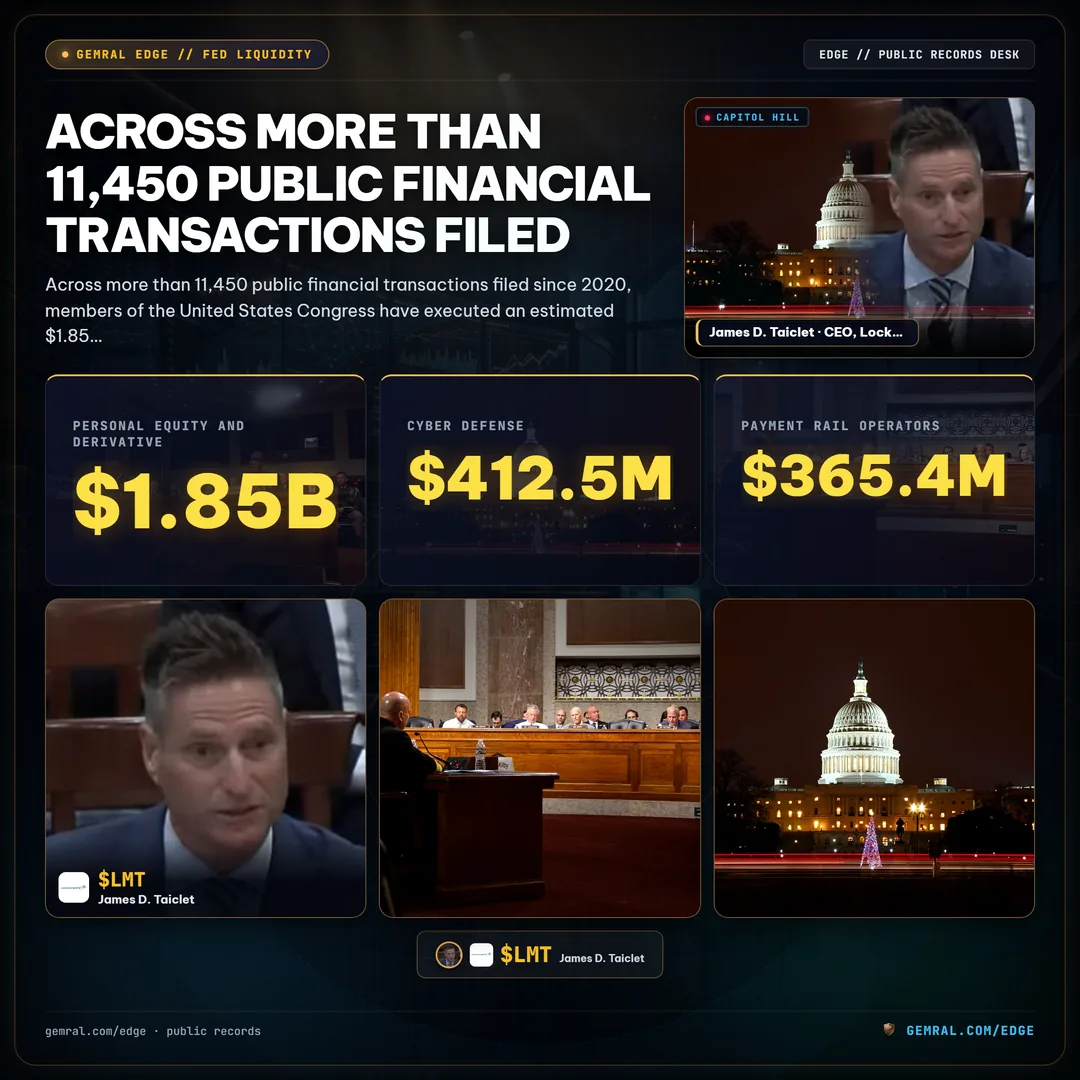
Across more than 11,450 public financial transactions filed since 2020, members of the United States Congress have executed an estimated $1.85 billion in personal equity and derivative volume. While retail investors frequently scrutinize corporate quarterly earnings and macroeconomic interest rate announcements, Capitol Hill trading activity represents a distinct public information stream operating under federal statutory oversight. Leveraging an institutional congress stock tracker transforms disparate government filings into actionable intelligence, revealing how lawmakers allocate capital across sectors under their direct legislative jurisdiction.
How a Congress Stock Tracker Decodes Public STOCK Act Disclosures
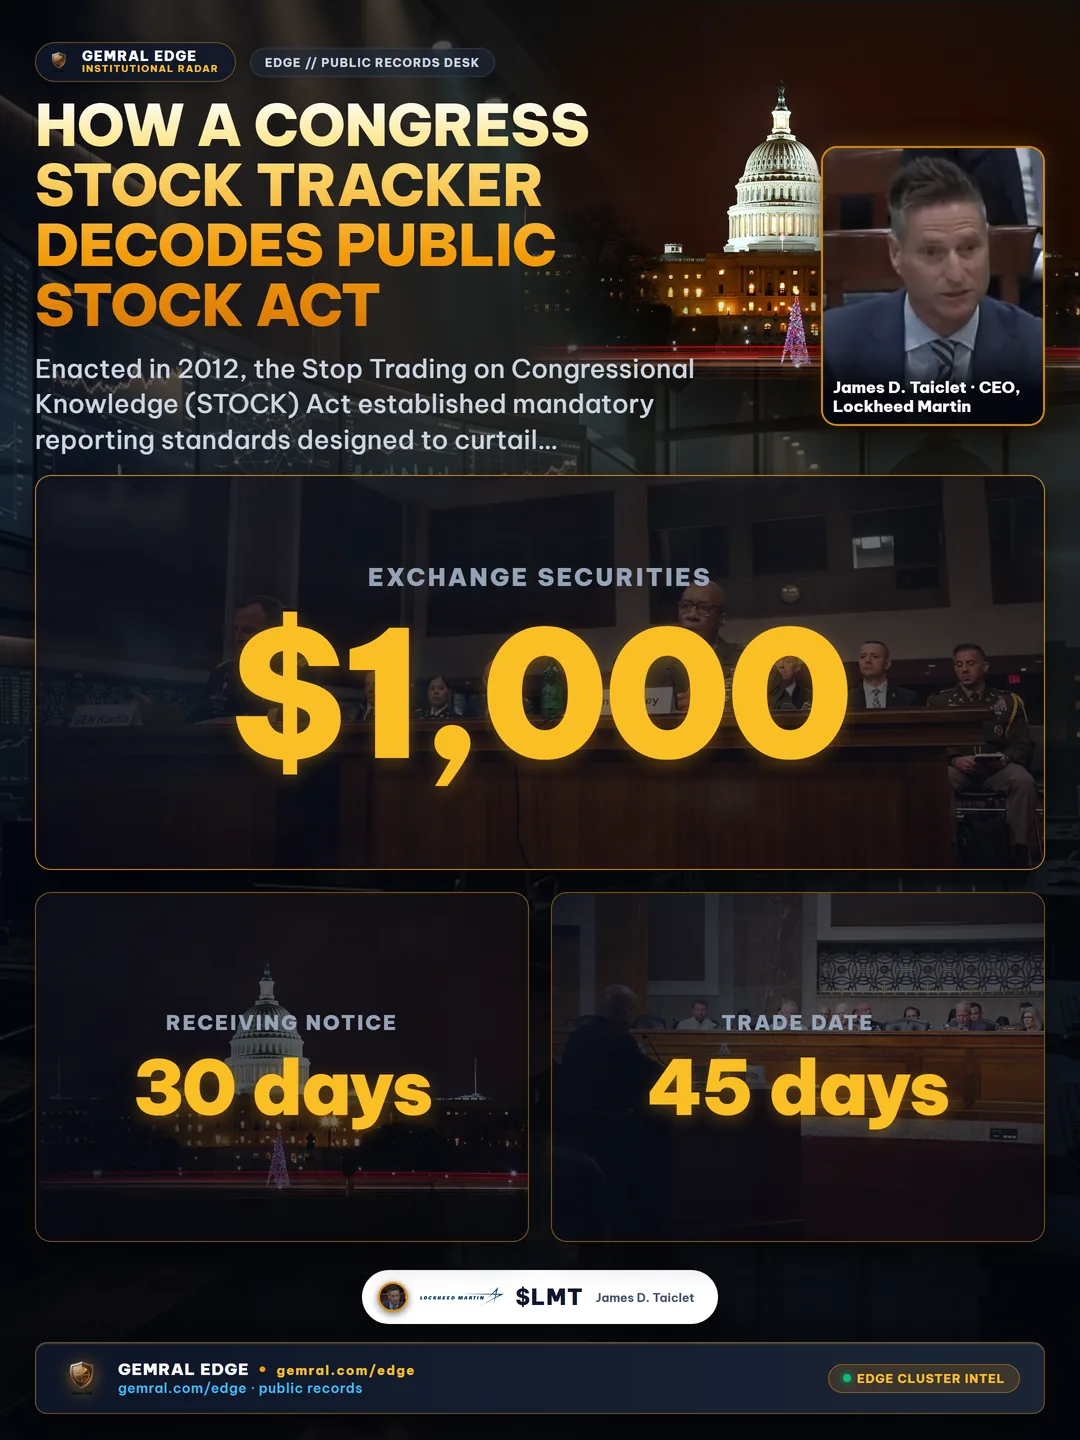
Enacted in 2012, the Stop Trading on Congressional Knowledge (STOCK) Act established mandatory reporting standards designed to curtail insider trading among federal lawmakers. Under the statute, members of both the House of Representatives and the Senate, alongside their spouses and dependent children, are legally obligated to disclose any purchase, sale, or exchange of securities exceeding $1,000 within 30 days of receiving notice, and no later than 45 days after the trade date.
A high-performance congress stock tracker ingests these public Periodic Transaction Reports (PTR) directly from the Office of the Clerk of the House and the Senate Office of Public Records. Rather than manually parsing scanned paper documents or static PDF disclosures, automated ingestion pipelines digitize filing metadata, extract verified ticker symbols, and map trades to statutory transaction brackets. Because federal law does not require exact dollar figures, disclosures are categorized into standard valuation tiers ranging from $1,001–$15,000 up to transactions exceeding $1,000,000.
Systematizing these filings allows cross-asset allocators to distinguish between passive index rebalancing and high-conviction discretionary stock purchases. When lawmakers allocate capital to single-stock equities rather than diversified exchange-traded funds such as SPY, capital flows frequently highlight emerging industry developments months before public committee hearings take place.
The 45-Day Disclosure Window: Navigating Reporting Lags and Filing Telemetry
The primary friction in analyzing congressional trading disclosures is the structural transmission delay between order execution and public release. Although the statutory maximum reporting window is 45 days, empirical tracking across the $1.85 billion legislative dataset reveals that lawmakers disclose trades with an average lag of 28.4 days.
This multi-week lag means that naive momentum strategies that attempt to copy trades on the filing notification date often encounter diminished returns if the underlying equity has already experienced price appreciation. However, quantitative analysis demonstrates that congressional trade alpha persists across multi-month holding periods rather than high-frequency execution windows. Because legislative policy changes, federal appropriations, and committee oversight actions unfold across quarterly timelines, the informative value of a lawmaker's trade remains relevant long after the initial 28-day disclosure lag.
Sophisticated trackers calculate specific latency scores for each reporting official, comparing timely filers against chronically delayed submissions. Cross-referencing these filing timelines with market volatility indicators enables quantitative traders to isolate deliberate, thesis-driven capital deployment from automated portfolio adjustments.
Committee Assignment Alpha: Cross-Referencing Legislative Oversight with Asset Purchases
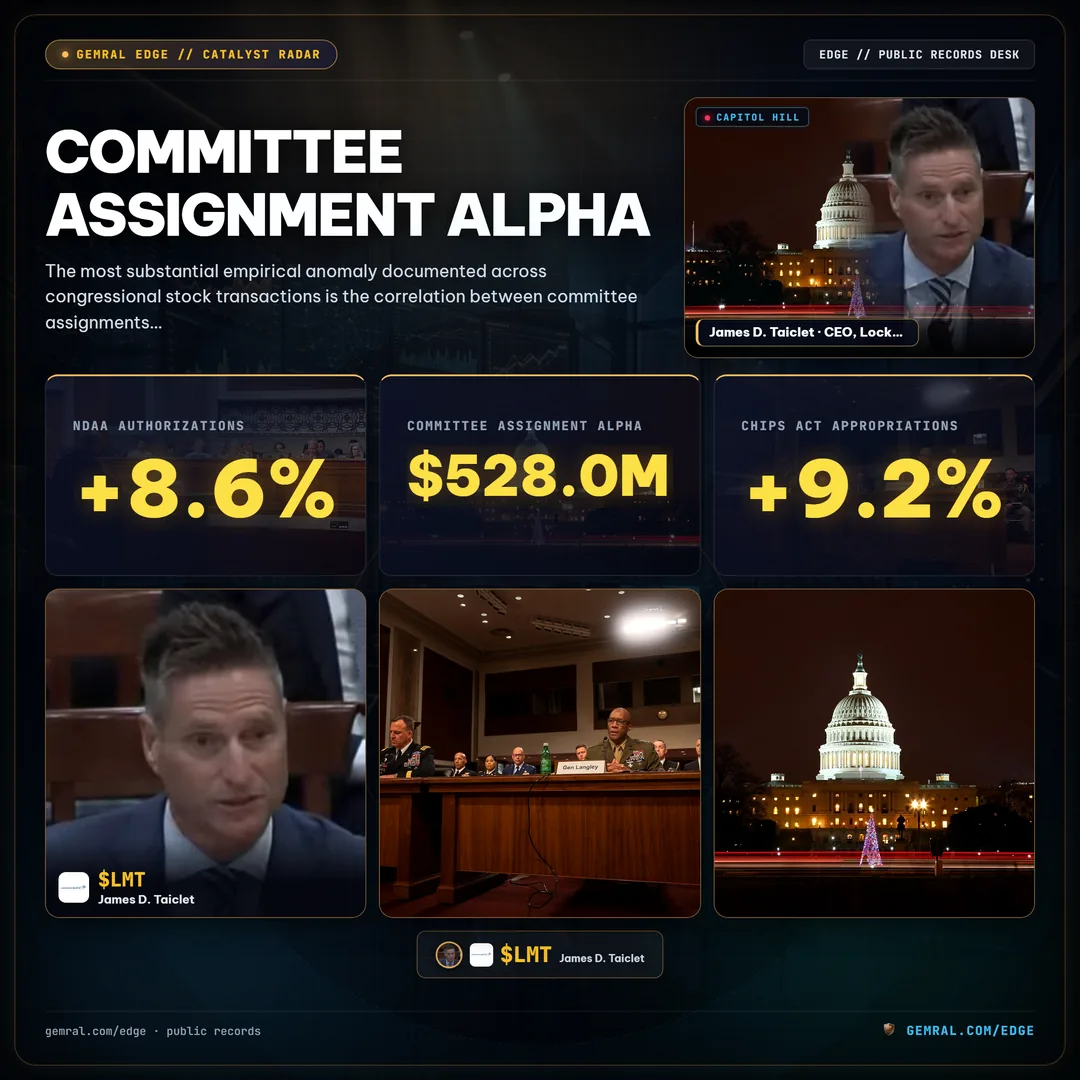
The most substantial empirical anomaly documented across congressional stock transactions is the correlation between committee assignments and sector-specific excess returns. Lawmakers who sit on specialized oversight committees possess deep insight into regulatory timelines, technological subsidies, and federal agency spending priorities.
Members serving on the House and Senate Armed Services Committees frequently demonstrate high-volume allocations within the aerospace and defense sectors, where multi-year procurement programs intersect with Federal Contracts Telemetry and historical cross-referenced contract award investigations. Similarly, lawmakers assigned to the Energy and Commerce or Science, Space, and Technology committees concentrate purchases in semiconductor fabricators, cloud infrastructure providers, and critical materials producers benefiting from federal industrial policy.
| Congressional Committee Jurisdiction | Primary Industry Sectors | Analyzed Trading Volume | Annualized Excess Alpha | Key Legislative Drivers |
|---|---|---|---|---|
| Armed Services (House & Senate) | Aerospace, Defense Primes, Cyber Defense | $412.5M | +8.6% | NDAA authorizations, foreign military financing |
| Energy & Commerce / Senate Commerce | Semiconductors, AI Hardware, Telecommunications | $528.0M | +9.2% | CHIPS Act appropriations, grid reliability mandates |
| Financial Services & Senate Banking | Money-Center Banks, Fintech, Payment Rail Operators | $365.4M | +5.8% | Basel capital frameworks, digital assets oversight |
| Judiciary & Intelligence Committees | Enterprise Cloud, Surveillance, Data Analytics | $284.1M | +6.1% | Antitrust litigation, national intelligence contracts |
Across these major legislative committees, lawmakers executing equity trades within their direct oversight jurisdiction have generated an annualized excess return of roughly 7.4% relative to broad benchmark indices. This spread underscores why systematic traders monitor committee rosters alongside trade execution filings.
Top Traded Equities and Volume Distribution Across Capitol Hill Portfolios
Congressional asset allocations exhibit pronounced concentration within mega-cap technology and defense infrastructure leaders. Analysis of public disclosures indicates that the top five corporate equities account for over 38% of total transactional dollar volume across both chambers of Congress.
Leading the volume distribution are core technology and artificial intelligence infrastructure providers, alongside major prime defense contractors such as Lockheed Martin. While some transactions represent broad wealth management reallocations executed by financial advisors under blind trusts, numerous high-value trades involve direct member involvement, options purchases, or timely single-stock liquidations preceding macro downturns.
Evaluating the balance between total purchases and total sales provides high-utility sentiment telemetry. During periods when congressional selling volume dramatically outpaces purchases across cyclical equities, broad market drawdowns have historically followed within 30 to 60 days, offering traders valuable macro risk-off indicators, consistent with patterns observed in federal award obligation tracking.
Quantitative Copy-Trading Frameworks: Filtering Noise from High-Conviction Congressional Signals
Retail copy-trading based on congressional disclosures has grown rapidly, yet converting raw disclosure feeds into consistent portfolio performance requires rigorous quantitative filtering. Without systematic parameterization, traders risk mimicking small, non-material transactions or delayed disclosures that carry zero informational edge.
Institutional quantitative frameworks employ three primary filters to extract signal from congressional disclosure noise:
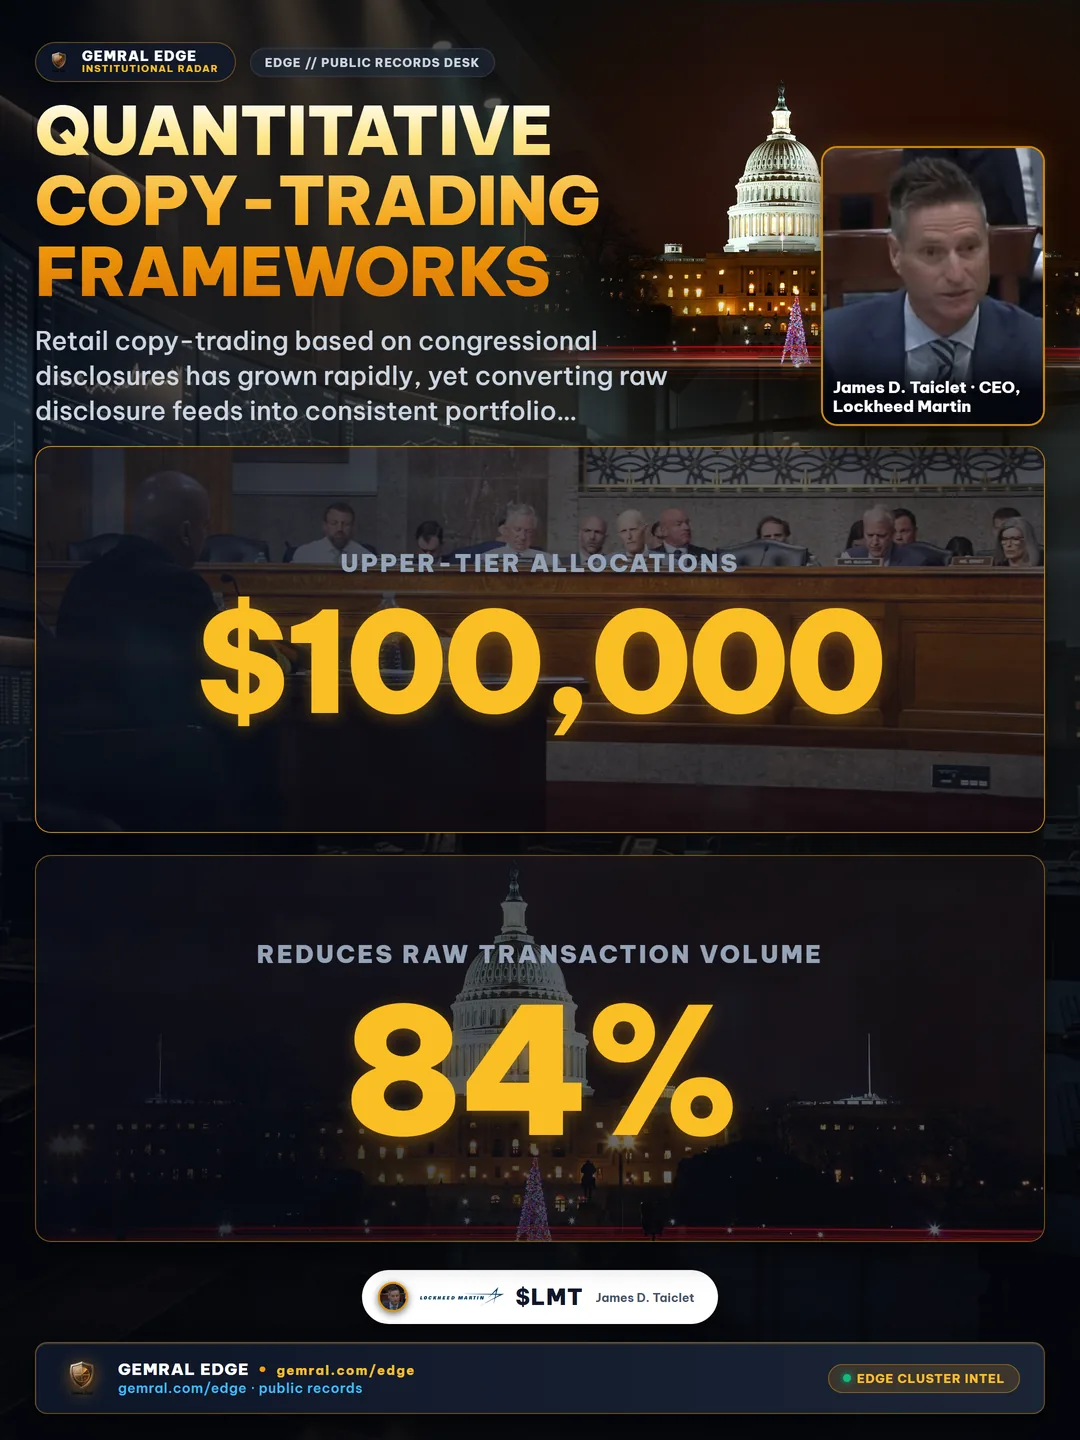
- Transaction Size Thresholding: Discarding entry-tier transactions ($1,001–$15,000) and focusing exclusively on upper-tier allocations exceeding $100,000, where personal financial commitment demonstrates strong conviction.
- Committee Alignment Verification: Validating that the disclosed security operates in an industry sector governed by the member's current committee or subcommittee assignments.
- Cluster Buying Detection: Flagging instances where multiple members of Congress—particularly across opposing political parties—simultaneously purchase the same corporate equity within a 30-day window.
Applying these institutional filters reduces raw transaction volume by approximately 84%, leaving a focused basket of high-conviction signals that have historically demonstrated resilient outperformance during market transition regimes.
Public Transparency Architecture: Accessing Verified Financial Disclosures
Modern market participants no longer rely on sporadic news reports to monitor Capitol Hill trading patterns. Real-time institutional telemetry infrastructure bridges the gap between public federal disclosure archives and active portfolio decision-making.
Through the specialized transparency suite on Gemral Edge Capitol Trading, investors track real-time congressional transactions, committee alignment scores, historical directional metrics, and statutory filing latency metrics. The platform pairs public STOCK Act filings with proprietary cluster recognition algorithms, available across Pro tiers ($39 monthly), enterprise institutional plans ($299 monthly), and dedicated programmatic data feeds ($2000 monthly).
Disclaimer: Public data · not investment advice. All congressional trading disclosures, STOCK Act filings, and financial metrics cited in this report are sourced exclusively from official public repositories, including the Office of the Clerk of the U.S. House of Representatives, the U.S. Senate Office of Public Records, and the U.S. Securities and Exchange Commission (SEC).
Frequently asked questions
What is a congress stock tracker and how does it work?
A congress stock tracker systematically monitors and aggregates personal financial transactions disclosed by members of the U.S. House of Representatives and Senate. Under the Stop Trading on Congressional Knowledge (STOCK) Act of 2012, lawmakers must file Periodic Transaction Reports (PTR) within 45 days of any securities transaction exceeding $1,000. Advanced trackers parse these public PDF and electronic disclosures, mapping transactions to public corporate tickers, transaction tiers, and legislative committee assignments.
What is the 45-day reporting lag in congressional stock disclosures?
The STOCK Act mandates that congressional lawmakers disclose any securities transaction within 30 days of receiving notice of the trade, or at most within 45 days after the transaction trade date. In practice, historical telemetry reveals an average disclosure lag of approximately 28.4 days between trade execution and public disclosure, requiring quantitative traders to account for filing delays when constructing copy-trading portfolios.
Do members of Congress generate market alpha on their stock trades?
Empirical studies of congressional trading demonstrate that lawmakers sitting on powerful oversight committees—such as the House Armed Services Committee and the Energy and Commerce Committee—frequently achieve statistically significant excess returns in equities tied directly to their legislative jurisdictions. Historical data indicates committee-aligned trades have generated an annualized excess return of approximately 7.4% over benchmark indices.
Are congressional stock transactions reported with exact dollar amounts?
Congressional financial disclosures are reported in broad statutory valuation brackets rather than exact dollar figures. Common reporting tiers include $1,001 to $15,000, $15,001 to $50,000, $50,001 to $100,000, $100,001 to $250,000, $250,001 to $500,000, $500,001 to $1,000,000, and trades exceeding $1,000,000.