
When institutional macro strategists evaluate multi-asset valuations across equities, sovereign debt, and digital assets, traditional single-nation metrics frequently obscure the broader financial landscape. Domestic interest rates and localized central bank policy rate announcements capture headline attention, yet the underlying tide determining asset market expansions is the Global M2 money supply. Tracking broad money aggregates across the world's major central banks reveals the total volume of fiat purchasing power circulating through commercial banking systems. For cross-asset allocators, understanding how the Global M2 aggregate expands and contracts provides transparent insight into liquidity cycles that precede equity re-ratings and cryptocurrency surges by months.
Global M2 Money Supply: Aggregate Formula and Central Bank Weighting
The Global M2 money supply is an aggregated macroeconomic metric designed to measure the total stock of broad money created across the world's most influential sovereign economies. While individual central banks publish domestic definitions of broad money—encompassing currency in circulation, demand deposits, overnight repurchase obligations, savings deposits, and institutional money market holdings—the global metric standardizes these disparate national data series into a single baseline denominated in US Dollars.
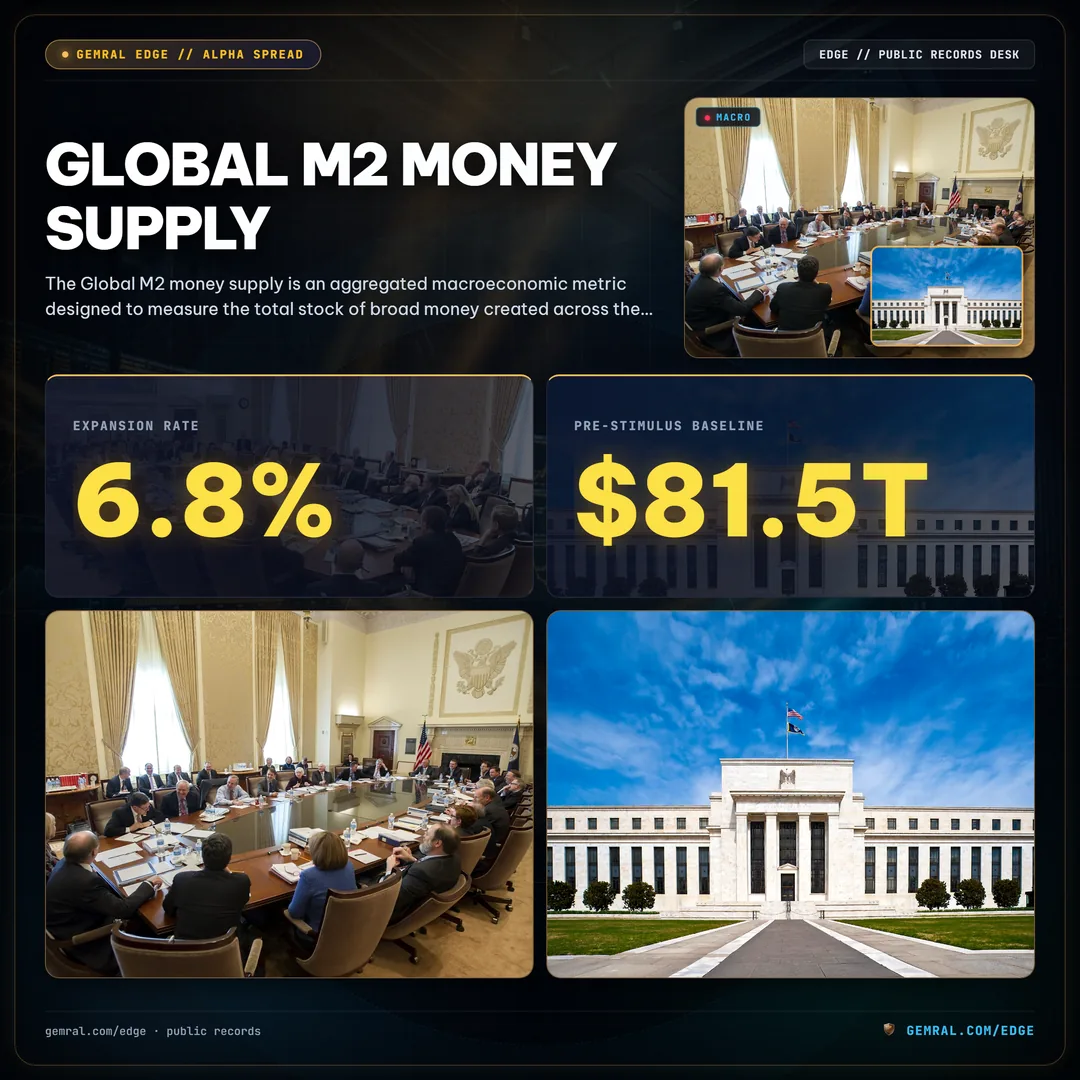
To construct an accurate Global M2 metric, quantitative researchers aggregate monthly and weekly central bank balance sheet telemetry from 12 major economic jurisdictions. These economies encompass the United States, China, the Eurozone, Japan, the United Kingdom, Canada, Australia, Switzerland, South Korea, India, Brazil, and Taiwan. Because each sovereign nation publishes monetary statistics in its domestic legal tender (such as Renminbi, Euros, Japanese Yen, or British Pounds), the aggregate calculation applies spot foreign exchange rates to convert each national M2 balance into US Dollars at current market valuations.
As of October 2026, the aggregate Global M2 money supply stands at approximately $108.2 trillion. This milestone reflects an annualized expansion rate of roughly 6.8%, representing a decisive breakout from the monetary contraction regime observed throughout 2022 and 2023. During the aggressive tightening cycle of 2022, Global M2 compressed to a cyclical trough of $94.6 trillion as simultaneous interest rate hikes and quantitative tightening programs drained banking liquidity. The current level of $108.2 trillion represents an expansion of $26.7 trillion compared to the pre-stimulus baseline of $81.5 trillion recorded in early 2020.
Core Macroeconomic Formula: Global M2 = ∑ (National M2_i × Spot FX Rate_i), where i represents the 12 sovereign central banking systems reporting standardized broad money series.
Because foreign national broad money totals are converted into US Dollars, the resulting Global M2 chart is driven by two distinct forces: organic credit creation within domestic banking systems and foreign exchange currency valuation swings. When the US Dollar Index (DXY) weakens against major reserve currencies, foreign money supplies naturally expand when measured in USD terms, injecting mechanical expansion into global liquidity readings. Conversely, periods of aggressive dollar strength compress foreign liquidity aggregates, creating synthetic tightening pressures across international cross-border lending channels. Researchers cross-reference these FX flows directly on institutional macro telemetry dashboards tracking sovereign debt and currency pairs.
How to Track Global M2 Money Supply Across Major Central Banks
Monitoring Global M2 requires standardizing diverse reporting conventions, reporting frequencies, and institutional publication schedules across 12 central banks. In the United States, the Federal Reserve Board publishes weekly updates for the M2 monetary aggregate through its H.6 statistical release, tracking approximately $21.4 trillion across commercial banking institutions and accessible via the Federal Reserve Bank of St. Louis Economic Data (FRED) system. The Federal Reserve's definition encompasses physical currency, demand deposits, checkable deposits, and small-denomination time deposits held across commercial banking institutions.
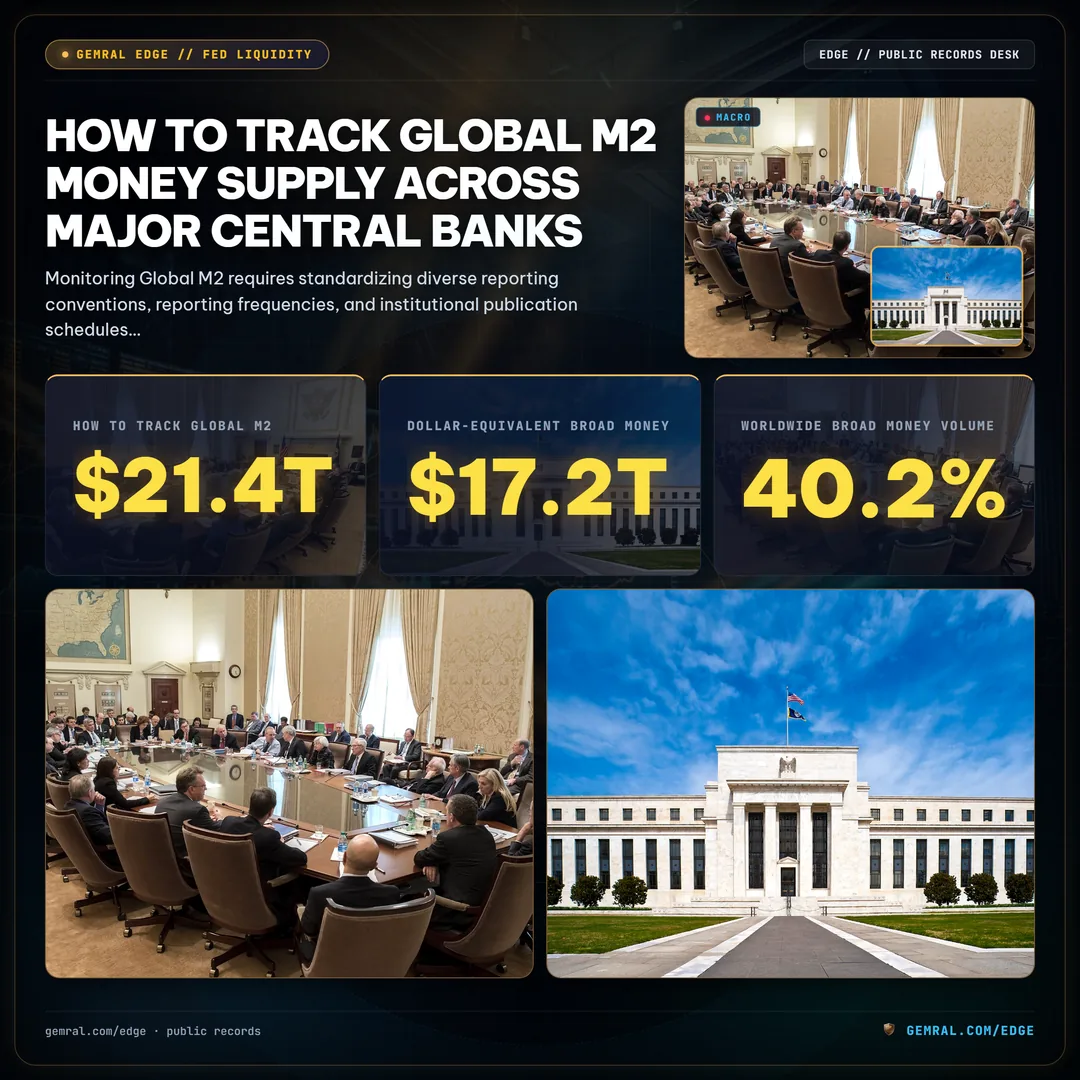
Across the European continent, the European Central Bank (ECB) publishes monthly broad money statistics under the Eurosystem consolidated monetary aggregates framework, accounting for $17.2 trillion in dollar-equivalent broad money. The ECB's M3 benchmark serves as the European equivalent of broad money, incorporating currency in circulation, overnight deposits, deposits with agreed maturity up to two years, repurchase agreements, and money market fund shares. Standardizing Eurozone broad money requires translating monthly statistical releases into continuous weekly estimates using interbank settlement telemetry.
In Asia, the People's Bank of China (PBOC) releases monthly monetary data detailing M2 broad money through the State Council Information Office and the National Bureau of Statistics. China's rapid commercial banking expansion and state-directed infrastructure lending mean PBOC releases account for over 40.2% of worldwide broad money volume ($43.5 trillion equivalent). Meanwhile, the Bank of Japan (BOJ) publishes both M2 and M3 money stock reports, detailing currency in circulation and corporate deposits across city banks, regional lenders, and trust banks totaling $10.8 trillion USD equivalent.
To construct a live, high-frequency tracker, quantitative desks deploy API ingestion pipelines that fetch central bank statistical releases as soon as national statistical bureaus publish their disclosures. By pairing national central bank releases with continuous foreign exchange feeds from the interbank currency market, analysts produce continuous daily estimates of Global M2 that reflect real-time shifts in global fiat liquidity well before quarterly economic revisions are finalized.
The Big Four Central Banks Driving Global M2 Expansion
Although global economic models track a dozen sovereign central banks, liquidity concentration remains heavily asymmetrical. In practice, four sovereign central banking authorities account for approximately 85.9% of the total Global M2 money supply, with aggregate holdings totaling $92.9 trillion out of the $108.2 trillion total.

The dominant contributor to total nominal broad money is the People's Bank of China. Driven by commercial bank asset growth, local government bond issuance, and state-backed development bank credit, China's M2 currently stands at 312.5 trillion CNY, which converts to approximately $43.5 trillion USD. This single monetary system accounts for 40.2% of the entire global broad money aggregate, expanding at a robust annualized pace of 8.4%.
The United States Federal Reserve occupies the second position, with US M2 standing at $21.4 trillion, representing roughly 19.8% of the global total. Following the Federal Reserve's quantitative easing pause and subsequent liquidity normalization, US broad money has rebounded to an annualized growth rate of 4.6%, driven by commercial bank deposit stability and corporate credit facility drawdowns.
The European Central Bank ranks third, managing a broad money stock of 15.8 trillion EUR, equivalent to approximately $17.2 trillion USD at prevailing exchange rates, or 15.9% of Global M2. Finally, the Bank of Japan maintains 1,640.0 trillion JPY in domestic broad money, translating to $10.8 trillion USD, or 10.0% of the worldwide total. The remaining central banking jurisdictions—including the UK, Canada, Switzerland, and Australia—collectively account for $15.3 trillion, or 14.1% of global broad money.
| Central Bank Authority | Currency | Domestic M2 Stock | USD Equivalent | Global Share | YoY Expansion Rate |
|---|---|---|---|---|---|
| People's Bank of China (PBOC) | CNY | 312.5 Trillion | $43.5 Trillion | 40.2% | +8.4% |
| US Federal Reserve | USD | 21.4 Trillion | $21.4 Trillion | 19.8% | +4.6% |
| European Central Bank (ECB) | EUR | 15.8 Trillion | $17.2 Trillion | 15.9% | +3.2% |
| Bank of Japan (BOJ) | JPY | 1,640.0 Trillion | $10.8 Trillion | 10.0% | +2.1% |
| Other G10 & Emerging Authorities | Multi | Various | $15.3 Trillion | 14.1% | Variable |
This distribution underscores why macro analysts closely monitor Beijing and Washington. Changes in monetary transmission policy across these two nations exert disproportionate influence on the worldwide supply of sovereign currency, dictating liquidity conditions for cross-border investments and institutional capital allocation globally.
The 60-to-90 Day Transmission Lag: How Global M2 Liquidity Reaches Risk Assets
A central tenet of macroeconomic liquidity analysis is that central bank credit creation does not influence financial asset valuations instantaneously. Instead, empirical market data documents a predictable transmission lag spanning 60 to 90 days (roughly 8 to 12 weeks) between turning points in Global M2 expansion and subsequent price responses across high-beta equities and cryptocurrency markets, moving across the $108.2 trillion global liquidity pool.

This transmission lag stems from the structural plumbing of modern banking. When central banks execute liquidity injections—whether through open market operations, targeted lending facilities, or reserve requirement reductions—the newly authorized reserves first accumulate on commercial bank balance sheets. Commercial institutions deploy these reserves through overnight reverse repurchase facilities, interbank money markets, and sovereign government bond auctions.
Over subsequent weeks, downward pressure on short-term yields encourages financial intermediaries and asset managers to extend along the risk curve. Institutional treasuries, corporate debt desks, and multi-strategy hedge funds begin reallocating capital into corporate credit, large-cap equities such as SPY, and high-growth technology shares. By the time this liquidity permeates through mutual funds, retail brokerage deposits, and private wealth networks, 60 to 90 days have elapsed since the initial central bank balance sheet expansion.
Historical regression studies validate this lag structure. During the liquidity inflection of late 2020, Global M2 expansion accelerated in March and April, yet the primary multi-asset rally reached peak velocity between July and November. Similarly, when Global M2 growth stalled in early 2022, equity indices and risk assets did not experience acute liquidity-driven liquidation until approximately 10 weeks later, confirming the predictive utility of tracking monetary aggregates.
Global M2 Money Supply vs Bitcoin: Analyzing the Fiat Debasement Correlation
Among all major investable asset classes, Bitcoin exhibits the highest structural sensitivity to fluctuations in the Global M2 money supply. While traditional equities depend heavily on corporate revenue growth, enterprise profit margins, and quarterly earnings performance, Bitcoin operates as an unencumbered, sovereign-neutral monetary asset governed by an unalterable supply cap of 21 million units, showing a high correlation coefficient of 0.82 with Global M2 year-over-year expansions.
Because Bitcoin possesses an inelastic supply curve, its market price functions primarily as a real-time barometer of fiat currency debasement. When sovereign central banks accelerate M2 expansion faster than the growth rate of real economic productivity, the relative purchasing power of fiat currency deteriorates. In response, global capital seeks refuge in provably scarce stores of value, including monetary gold and digital assets.
Quantitative tracking of Bitcoin market capitalization against the Global M2 year-over-year delta reveals a multi-year correlation coefficient of 0.82 during expansionary liquidity regimes. During major monetary expansion episodes—such as the liquidity surges of 2017, 2020 through 2021, and the current cycle across 2024 to 2026—Bitcoin price inflections consistently mirrored changes in the Global M2 growth trajectory after accounting for the standard 10-week transmission delay.
Conversely, during contractionary regimes such as 2018 and 2022, when global central banks initiated simultaneous monetary tightening and reduced broad money availability, Bitcoin experienced sharp cyclical drawdowns. The digital asset absorbed the contractionary impulse as liquidity was drained from financial intermediaries, illustrating that Bitcoin's multi-year macro trends are fundamentally reflections of global liquidity availability rather than isolated sector developments.
Tracking Global M2 Liquidity Cycles and Macro Signals: Regimes and Strategy
To transform high-level monetary statistics into actionable market intelligence, quantitative analysts categorize broad money movements into three discrete operational regimes based on historical cycle boundaries:
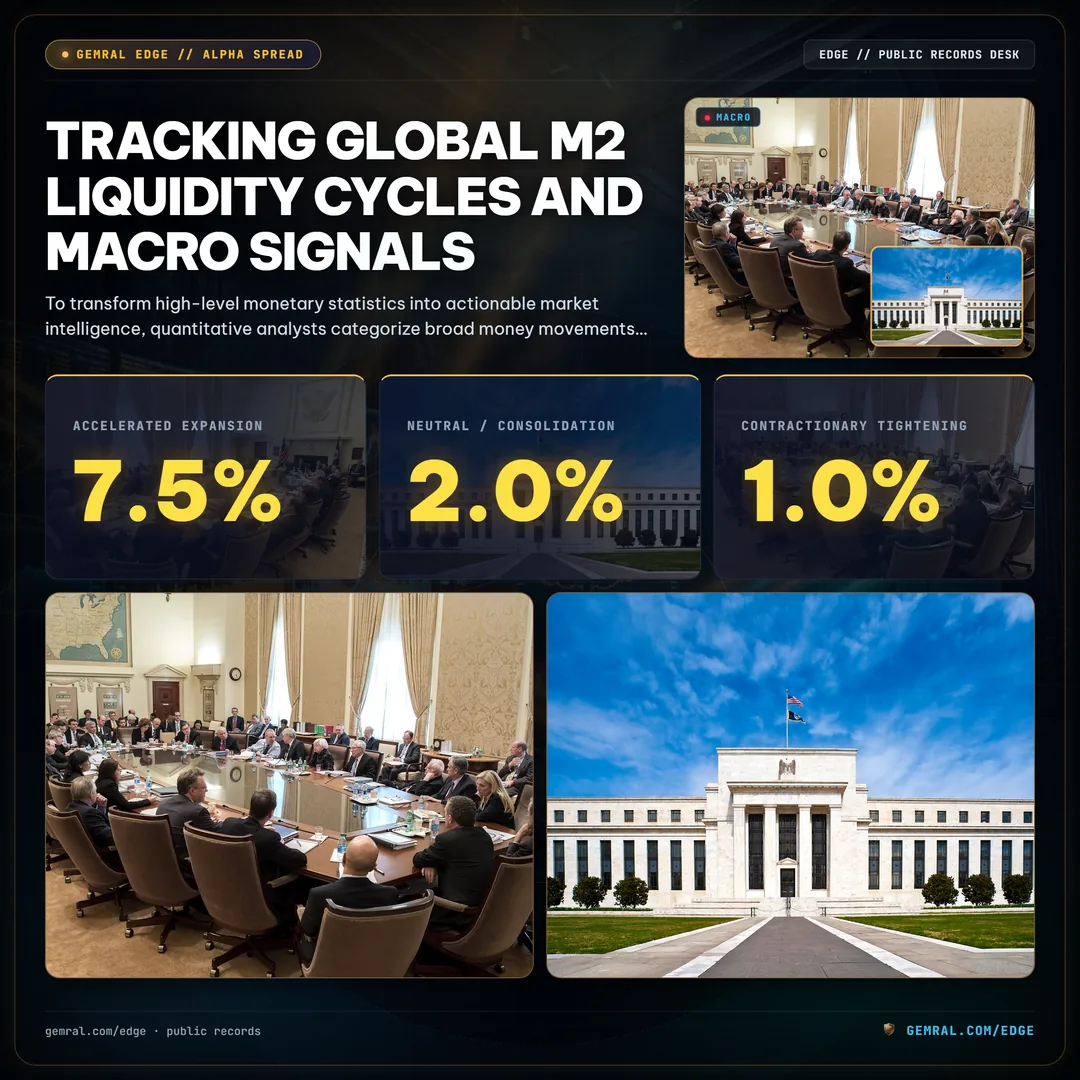
- Accelerated Expansion (YoY Growth > 7.5%): Characterized by aggressive central bank easing, coordinated rate cuts, and rapid commercial credit expansion. Historically coincides with multi-quarter upward expansions across equity indices, technology multiples, and Bitcoin.
- Neutral / Consolidation (YoY Growth 2.0% to 6.0%): Characterized by sustainable, trendline economic growth and balanced central bank policy. Financial markets typically experience selective sector rotation, range-bound index consolidation, and earnings-driven dispersion.
- Contractionary Tightening (YoY Growth < 1.0% or Negative): Characterized by quantitative tightening programs, interbank credit rationing, and systemic liquidity compression. Historically triggers severe deleveraging cascades, valuation compression, and broad multi-asset corrections.
Navigating these macro regimes requires continuous visibility into both aggregate broad money and high-frequency liquidity indicators. In our companion research on Fed Net Liquidity Dynamics and the SOFR Rate and Repo Stress Tracker, we examine how domestic banking reserves interact with global broad money. Through the institutional intelligence suite on Gemral Edge Macro Telemetry, traders and portfolio managers monitor real-time feeds tracking the US Federal Reserve Net Liquidity equation, Treasury General Account (TGA) cash drawdowns, Foreign Central Bank liquidity swaps, and the continuous Global M2 aggregate index with Pro tiers ($39 monthly), enterprise institutional plans ($299 monthly), or dedicated programmatic data feeds ($2000 monthly).
Disclaimer: Public data · not investment advice. All macroeconomic data, central bank figures, and monetary metrics cited in this report are sourced from official public disclosures, including the Federal Reserve Economic Data (FRED) system, the Bank for International Settlements (BIS), and respective national central bank statistical bureaus.
Frequently asked questions
What is included in the Global M2 money supply calculation?
Global M2 combines currency in circulation, demand deposits, savings deposits, money market funds, and small-denomination time deposits across major sovereign jurisdictions. The standard global aggregate aggregates data from the Federal Reserve (USD), PBOC (CNY), ECB (EUR), BOJ (JPY), Bank of England (GBP), Swiss National Bank (CHF), Bank of Canada (CAD), and Reserve Bank of Australia (AUD), converting all national currencies into US Dollars at current spot exchange rates.
Why does Global M2 lead Bitcoin and equity prices by 60 to 90 days?
When central banks expand balance sheets or commercial banking systems accelerate credit creation, new liquidity initially settles within interbank repo markets, commercial bank reserves, and institutional treasury operations. It requires approximately 8 to 12 weeks for this newly created liquidity to circulate through institutional asset allocators, hedge funds, and corporate treasuries before flowing into high-beta risk assets like technology stocks and Bitcoin.
Which central bank has the largest share of Global M2 money supply?
The People's Bank of China (PBOC) accounts for the largest individual share of Global M2, representing approximately $43.5 trillion equivalent (over 40% of the global aggregate), driven by decades of rapid bank lending and infrastructure credit expansion. The US Federal Reserve ranks second at approximately $21.4 trillion, followed by the European Central Bank at $17.2 trillion and the Bank of Japan at $10.8 trillion.
How does currency fluctuation impact the Global M2 chart in USD?
Because foreign central bank broad money totals must be converted into US Dollars, a weakening US Dollar (declining DXY index) mechanically inflates the USD value of foreign money supplies, accelerating Global M2 growth. Conversely, a strengthening US Dollar compresses the foreign component of Global M2, even if local currency credit continues to grow.