SOFR Rate Chart and History: Tracking Secured Overnight Financing Rate Volatility and Repo Spreads
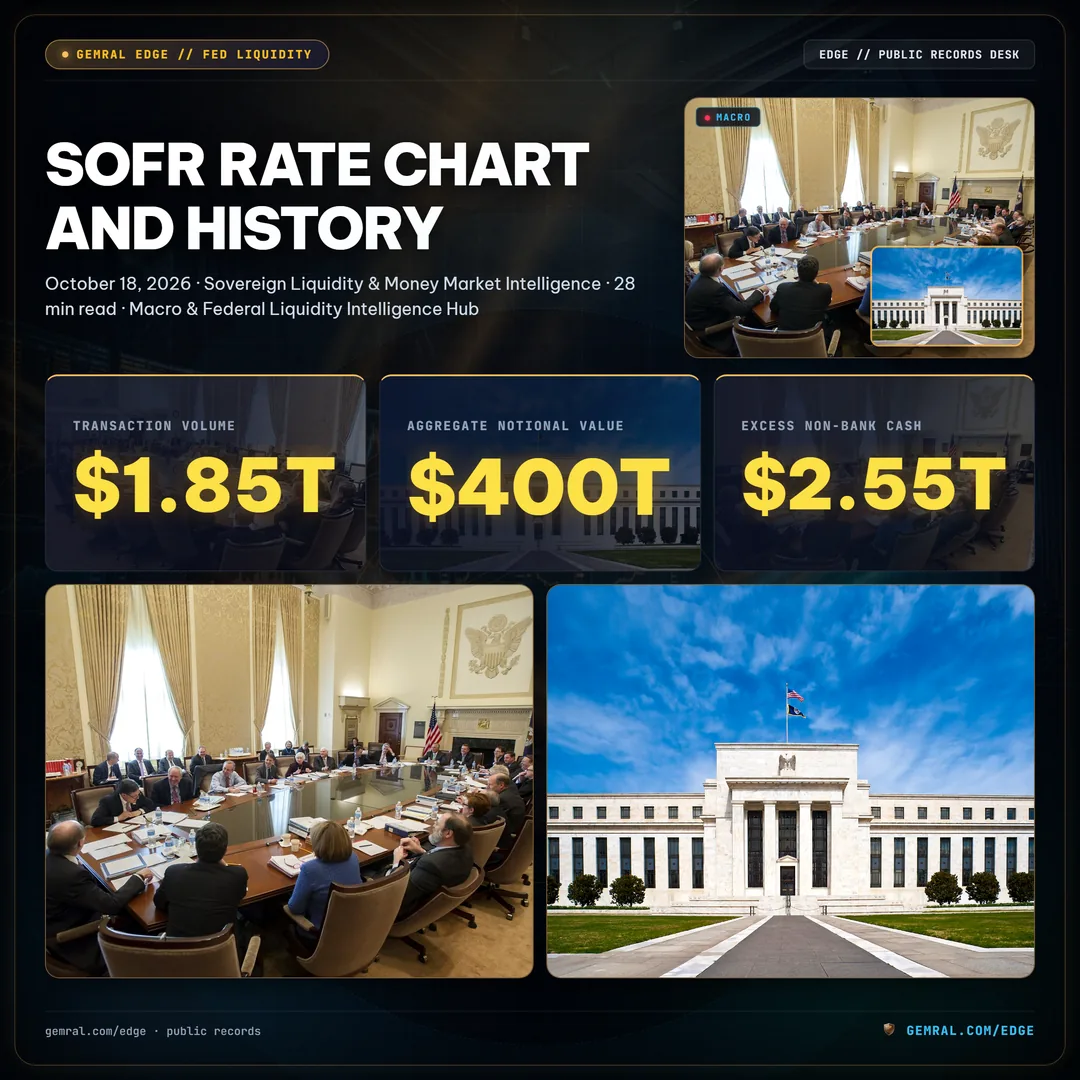
The fundamental benchmark anchoring the United States dollar financial system is the Secured Overnight Financing Rate (SOFR). In this comprehensive institutional report, we examine the multi-year evolution of the sofr rate chart, dissecting the structural mechanics of secured repurchase agreement (repo) markets, quantifying historical spread anomalies across Federal Reserve policy corridors, and auditing the operational plumbing that coordinates over $1.85 trillion in daily transaction volume across sovereign debt clearing networks.
Following the structural phase-out of the London Interbank Offered Rate (LIBOR), global derivative contracts, corporate debt facilities, and commercial loans exceeding $400 trillion in aggregate notional value migrated to SOFR. For portfolio managers, corporate treasurers, and macro allocators tracking liquidity conditions through our Macro & Federal Liquidity Intelligence Hub, tracking daily rate variance, collateral velocity, and repo spread dispersion provides essential foresight into balance sheet friction and systemic liquidity stress. When combined with insights from our research on the Standing Repo Facility Liquidity Analysis and broader Federal Reserve Net Liquidity Engine dynamics, the SOFR rate chart serves as an indispensable barometer of real-time cash settlement health.
SOFR Rate Chart and History: Deconstructing the Secured Overnight Financing Rate Benchmark
To interpret a modern sofr rate chart, one must first deconstruct the underlying transaction data feeding the calculation engine operated by the Federal Reserve Bank of New York in cooperation with the Office of Financial Research (OFR). Unlike historical unsecured rates that relied upon subjective expert submissions from panel banks, SOFR is a volume-weighted median of transaction-level market data collected from three distinct segments of the overnight repo market. Each business morning at approximately 8:00 AM Eastern Time, the New York Fed calculates and publishes the benchmark based on borrowing transactions executed the prior business day.
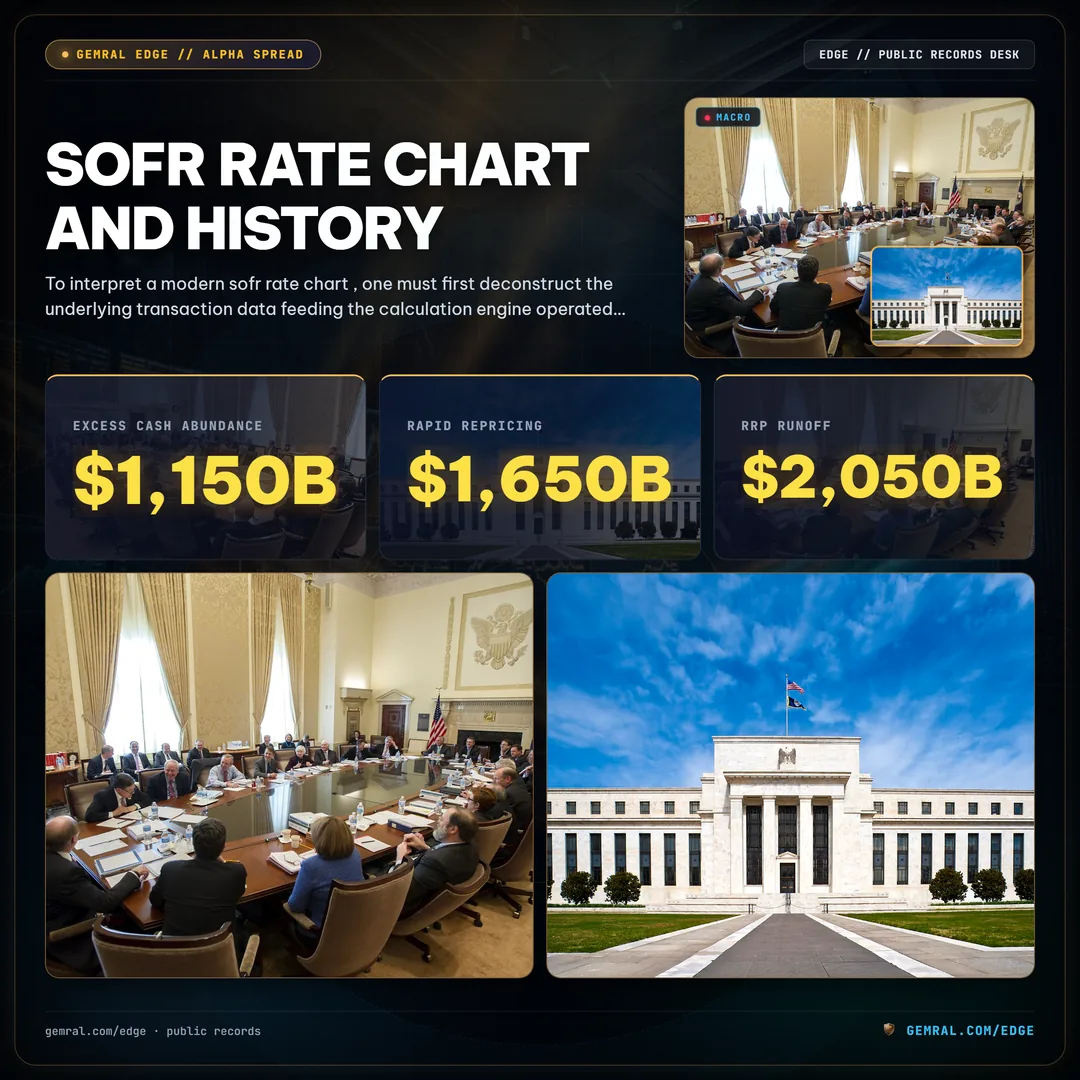
The daily sample population is exceptionally robust, regularly aggregating between $1.85 trillion and $2.14 trillion in actual collateralized funding transactions. This immense transactional foundation renders SOFR virtually immune to individual institution manipulation. The rate represents the exact cost of securing overnight cash against general United States Treasury collateral, encompassing Treasury bills, nominal coupon notes, long-term bonds, Treasury Inflation-Protected Securities (TIPS), and Floating Rate Notes (FRNs).
The historical trajectory of SOFR captures the macro policy cycle with remarkable precision. During the zero-interest-rate policy (ZIRP) regime of 2020 and 2021, SOFR hovered tightly between 0.05% and 0.08%, supported by massive central bank quantitative easing and an expanding Overnight Reverse Repo (ON RRP) balance that absorbed over $2.55 trillion in excess non-bank cash. Beginning in March 2022, as the Federal Open Market Committee (FOMC) initiated the most aggressive monetary tightening campaign in four decades, the SOFR rate chart climbed steadily from 0.25% to reach a plateau corridor between 5.30% and 5.35% by mid-2023. Throughout this cycle, the New York Fed also published 30-day, 90-day, and 180-day SOFR compounded averages, alongside the SOFR Index, enabling institutional market participants to calculate compounded interest across standardized lending tenors.
| Historical Policy Regime | Observation Window | Median SOFR Level | Average Daily Volume | Primary Market Characteristic |
|---|---|---|---|---|
| ZIRP & QE Expansion | 2020 – 2021 | 0.05% – 0.08% | $950B – $1,150B | Excess cash abundance; ON RRP absorption buffer active |
| Aggressive Rate Hike Cycle | 2022 – 2023 | 0.25% – 5.33% | $1,200B – $1,650B | Rapid repricing of sovereign collateral; RRP balance peak at $2.55T |
| Terminal Plateau & QT Runoff | 2023 – 2024 | 5.30% – 5.40% | $1,750B – $2,050B | ON RRP runoff from $2.55T to $285B; interdealer volume expansion |
| Policy Easing & Calibrated QT | 2025 – 2026 | 4.60% – 4.90% | $1,850B – $2,140B | SOFR trading near IORB; periodic quarter-end collateral friction |
Analyzing historical data series highlights how the benchmark responds to systemic liquidity absorption. As commercial bank reserves held at Federal Reserve Banks fluctuated between $3.10 trillion and $3.55 trillion, the day-to-day variance of SOFR remained well-contained during normal operational cycles, while widening predictably during quarterly financial statement reporting dates.
The Tri-Party Repo Plumbing: How TGCR, BGCR, and SOFR Measure Overnight Cash Settlement
A sophisticated reading of overnight funding conditions requires understanding the hierarchical taxonomy of repo rates published by the New York Fed. The central bank does not rely solely on SOFR; rather, it produces three complementary reference rates that capture progressively wider tiers of collateralized cash settlement: the Tri-Party General Collateral Rate (TGCR), the Broad General Collateral Rate (BGCR), and the Secured Overnight Financing Rate (SOFR).
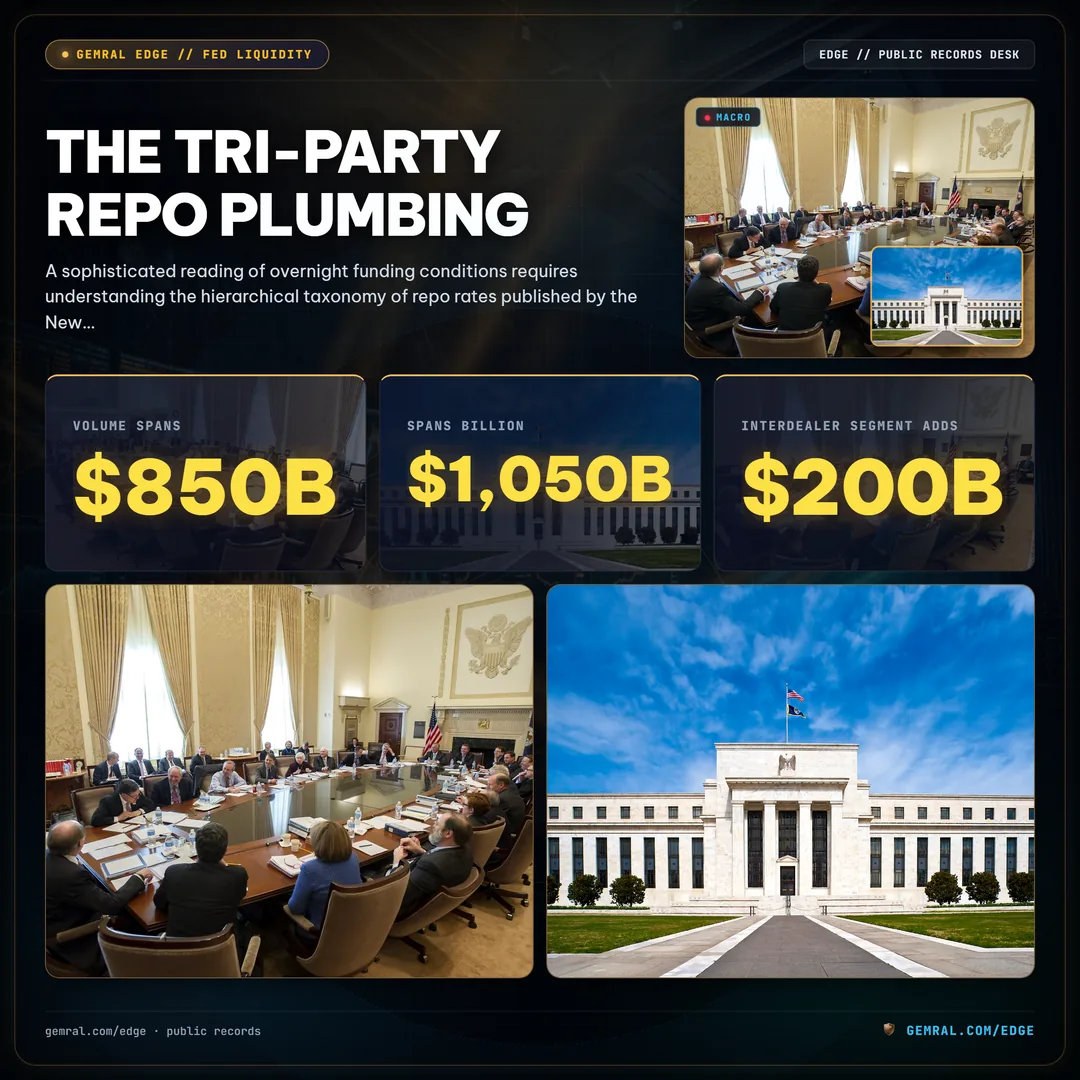
The foundation of this architecture is the Tri-Party General Collateral Rate (TGCR). Tri-party repo transactions are executed through a specialized clearing custodian—predominantly The Bank of New York Mellon—which acts as a neutral tri-party agent managing collateral custody, valuation, margin calculation, and daily operational settlement. In a tri-party trade, cash lenders such as institutional money market funds, government-sponsored enterprises (GSEs), and corporate treasuries provide funding to cash borrowers, primarily broker-dealers and commercial banks. The transactions in TGCR represent pure general collateral financing where specific security Cusips are not negotiated. Daily TGCR volume typically spans $850 billion to $1,050 billion.
The second tier is the Broad General Collateral Rate (BGCR). The BGCR incorporates all transactions included in TGCR, but adds qualifying General Collateral Finance (GCF) repo trades cleared through the Fixed Income Clearing Corporation (FICC). GCF repo allows primary dealers and FICC member banks to trade general collateral anonymously among themselves on an interdealer basis using interdealer brokers. This interdealer segment adds approximately $200 billion to $350 billion in daily transactional activity, lifting total BGCR daily volume into the range of $1,100 billion to $1,400 billion.
Finally, SOFR represents the apex of the reference rate hierarchy. In addition to all transactions captured within BGCR, SOFR incorporates bilateral, cleared sovereign repo transactions executed through the FICC's Delivery-versus-Payment (DVP) repo service. In DVP repo, specific Treasury securities are identified, matched, and settled against cash on a trade-for-trade basis. By including cleared bilateral trades, SOFR captures an additional $650 billion to $850 billion of vital interdealer and dealer-to-customer repo volume, bringing aggregate daily SOFR coverage to over $1.85 trillion.
• TGCR: Pure Tri-Party General Collateral Repo (Custody Cleared via BNY Mellon)
• BGCR: TGCR + FICC Cleared General Collateral Finance (GCF) Interdealer Repo
• SOFR: BGCR + FICC Cleared Bilateral Delivery-versus-Payment (DVP) Repo
Because SOFR includes bilateral DVP transactions, it captures both general collateral financing and "specials" trading—transactions where specific Treasury issues trade at an interest rate lower than general collateral because cash lenders are willing to accept a reduced yield in order to borrow that specific security. When demand for a particular Treasury note surges due to short-selling or hedging activity, that security trades on special, exerting downward pressure on bilateral repo rates. Conversely, when broad dealer inventories are saturated with newly issued Treasury paper, bilateral borrowing rates rise, elevating SOFR relative to TGCR.
Historical Rate Corridors: SOFR Trajectory Across Fed Hikes, Cuts, and Balance Sheet Runoff
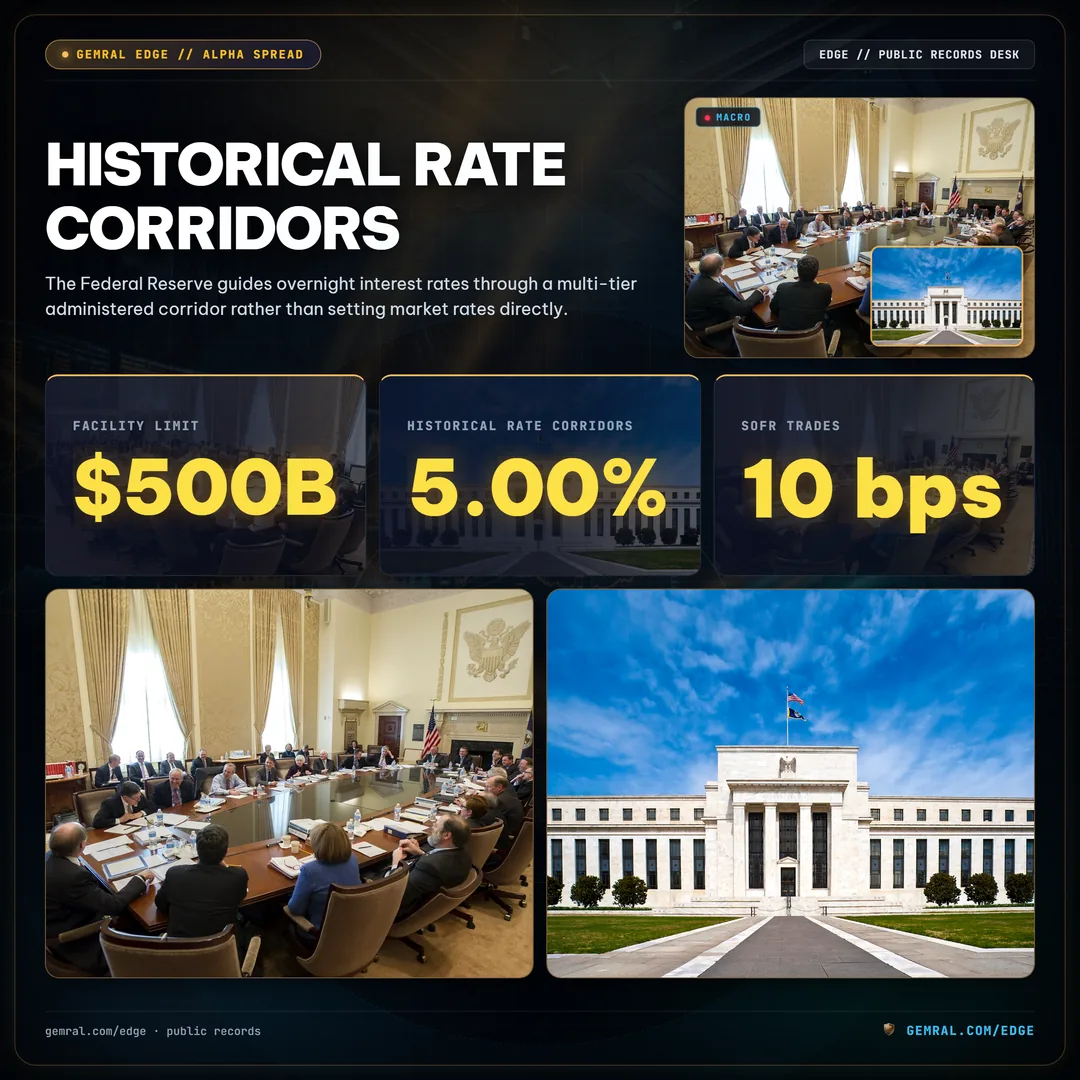
The Federal Reserve guides overnight interest rates through a multi-tier administered corridor rather than setting market rates directly. Understanding the positioning of SOFR within this administrative corridor is fundamental to diagnosing whether money markets are operating in an environment of abundant reserves or reserve scarcity. The corridor is bounded by three critical administrative tools operated by the central bank:
First, the Interest on Reserve Balances (IORB) rate establishes the anchor for commercial bank funding costs. As the rate paid by Federal Reserve Banks on balances maintained by eligible depository institutions, IORB represents the risk-free opportunity cost for commercial banks holding cash reserves. When SOFR trades below IORB, commercial banks have an economic incentive to borrow cash in the repo market at SOFR and deposit the proceeds at the Federal Reserve to earn IORB, creating a natural arbitrage that pulls SOFR upward toward the policy floor.
Second, the Overnight Reverse Repo Facility (ON RRP) offering rate provides a strict structural floor for non-bank institutional cash. Because major institutional money market funds and GSEs are legally ineligible to earn IORB at the central bank, they could historically be forced to lend at sub-market rates during periods of structural cash gluts. The ON RRP facility allows eligible non-bank counterparties to invest cash directly with the New York Fed against Treasury collateral at an administered rate set slightly below IORB. Throughout 2022 and 2023, the ON RRP absorbed up to $2.55 trillion in surplus liquidity, maintaining an absolute floor beneath SOFR.
Third, the Standing Repo Facility (SRF) establishes the administrative ceiling for collateralized financing. Designed to prevent rate dislocations, the SRF allows primary dealers and eligible banks to borrow overnight cash directly from the New York Fed against Treasury collateral at a rate set equal to the top of the FOMC's federal funds target range, with an aggregate daily facility limit of $500 billion.
| Administrative Parameter | Current Benchmark Level | Primary Function | Target Counterparty Base |
|---|---|---|---|
| Standing Repo Facility (SRF) | 5.00% (Ceiling) | Hard administrative rate cap on overnight secured funding | 24 Primary Dealers & Approved Depository Institutions |
| Interest on Reserve Balances (IORB) | 4.90% (Corridor Anchor) | Central operational anchor for commercial bank reserve demand | Master Account Depository Institutions (Commercial Banks) |
| Secured Overnight Financing Rate (SOFR) | 4.82% – 4.88% (Market Print) | Volume-weighted median cost of collateralized Treasury funding | Tri-Party, GCF, and Cleared Bilateral Market Participants |
| Overnight Reverse Repo (ON RRP) | 4.80% (Structural Floor) | Liquidity absorption floor for non-bank cash pools | Money Market Funds, GSEs, Primary Dealers |
Across the historical rate chart, the spread between SOFR and IORB (SOFR – IORB) serves as the primary metric of structural liquidity slack. When reserves are abundant, SOFR typically trades 5 to 10 basis points below IORB, reflecting the balance sheet intermediation costs incurred by primary dealers who borrow from money funds and lend to levered accounts. However, as quantitative tightening (QT) balance sheet runoff contracts aggregate commercial bank reserves from $4.2 trillion toward the $3.25 trillion threshold, SOFR begins drifting higher within the corridor, occasionally touching or exceeding IORB during settlement stress dates.
SOFR vs EFFR Spread Dynamics: Comparing Treasury Collateral Against Unsecured Interbank Funding
One of the most revealing market indicators tracked by fixed income strategists is the spread between the Secured Overnight Financing Rate and the Effective Federal Funds Rate (SOFR vs EFFR spread). While both benchmarks measure overnight domestic United States dollar borrowing costs, they operate on opposite sides of credit risk and collateralization mechanics.
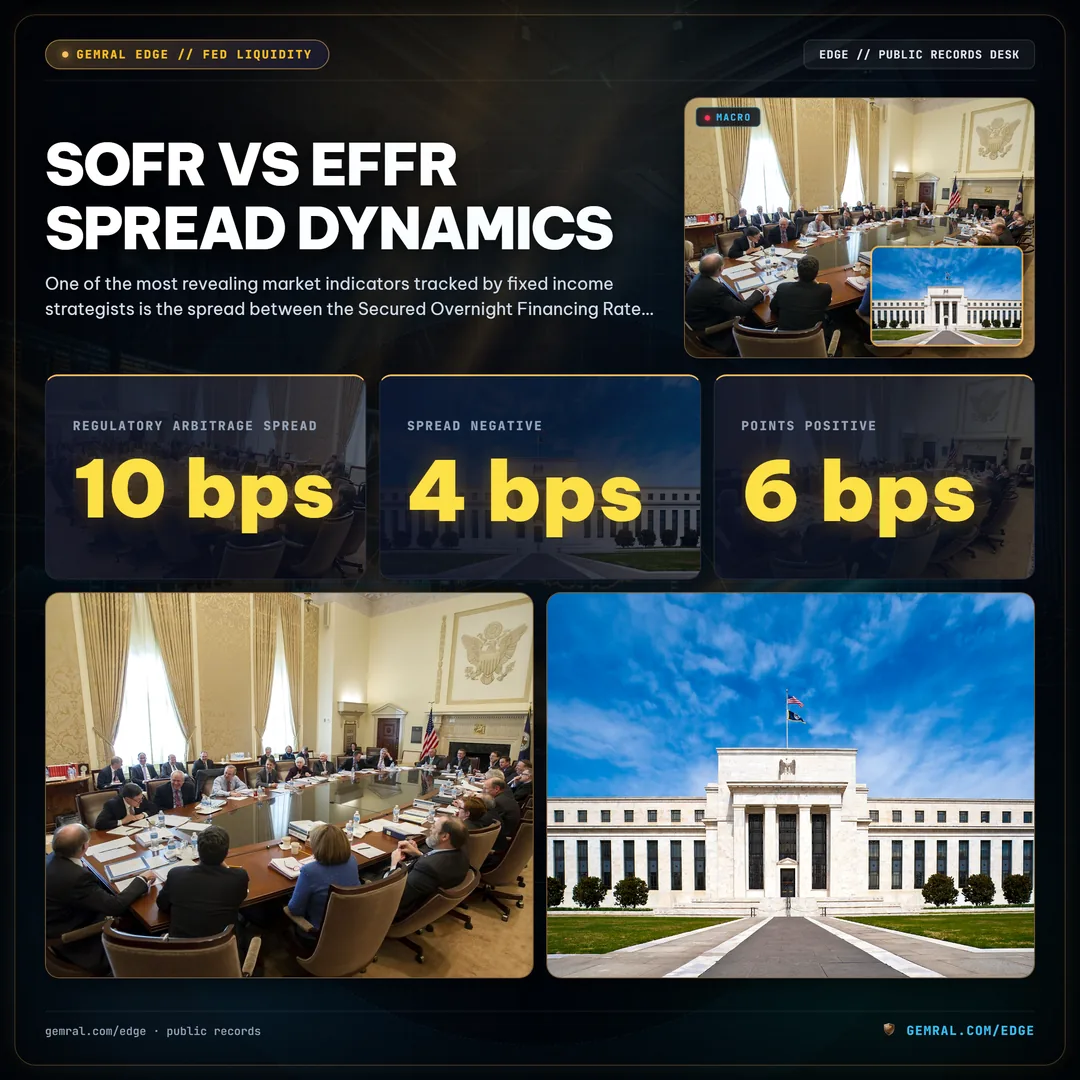
The Effective Federal Funds Rate (EFFR) measures unsecured overnight borrowing transactions between depository institutions and eligible entities—primarily Federal Home Loan Banks (FHLBs)—in the federal funds market. Because federal funds transactions are completely unsecured, economic theory suggests that EFFR should trade at a persistent spread above SOFR, which is fully collateralized by United States Treasuries with a zero percent risk weighting under Basel regulatory frameworks.
In practice, however, empirical financial history reveals that SOFR frequently trades above EFFR, presenting a fascinating structural paradox that reflects market segmentation and regulatory capital constraints:
When the SOFR vs EFFR spread widens into positive territory (SOFR printing higher than EFFR), it indicates acute balance sheet strain among primary dealers. Dealers are forced to pay a premium to secure cash against their Treasury holdings, even though the collateral is sovereign-guaranteed. During the money market stresses of late 2023 and mid-2024, the SOFR minus EFFR spread flipped from negative 4 basis points to positive 6 basis points, signaling to Federal Reserve officials that market intermediation capacity was reaching temporary capacity limits.
A continuous audit of this spread is crucial for institutional macro strategies. A widening positive spread between SOFR and EFFR signals tightening repo conditions, increasing carry costs for hedge funds executing leveraged Treasury cash-futures basis trades, and presaging volatility in wider equity and credit markets as margin leverage contracts.
Quarter-End Volatility Spikes: Analyzing Balance Sheet Window Dressing and Collateral Constraints
Examining any multi-year sofr rate chart immediately reveals periodic upward spikes occurring on the final business days of March, June, September, and December. These quarter-end rate spikes are not random statistical anomalies; they are direct structural manifestations of bank balance sheet regulation and global window dressing practices.
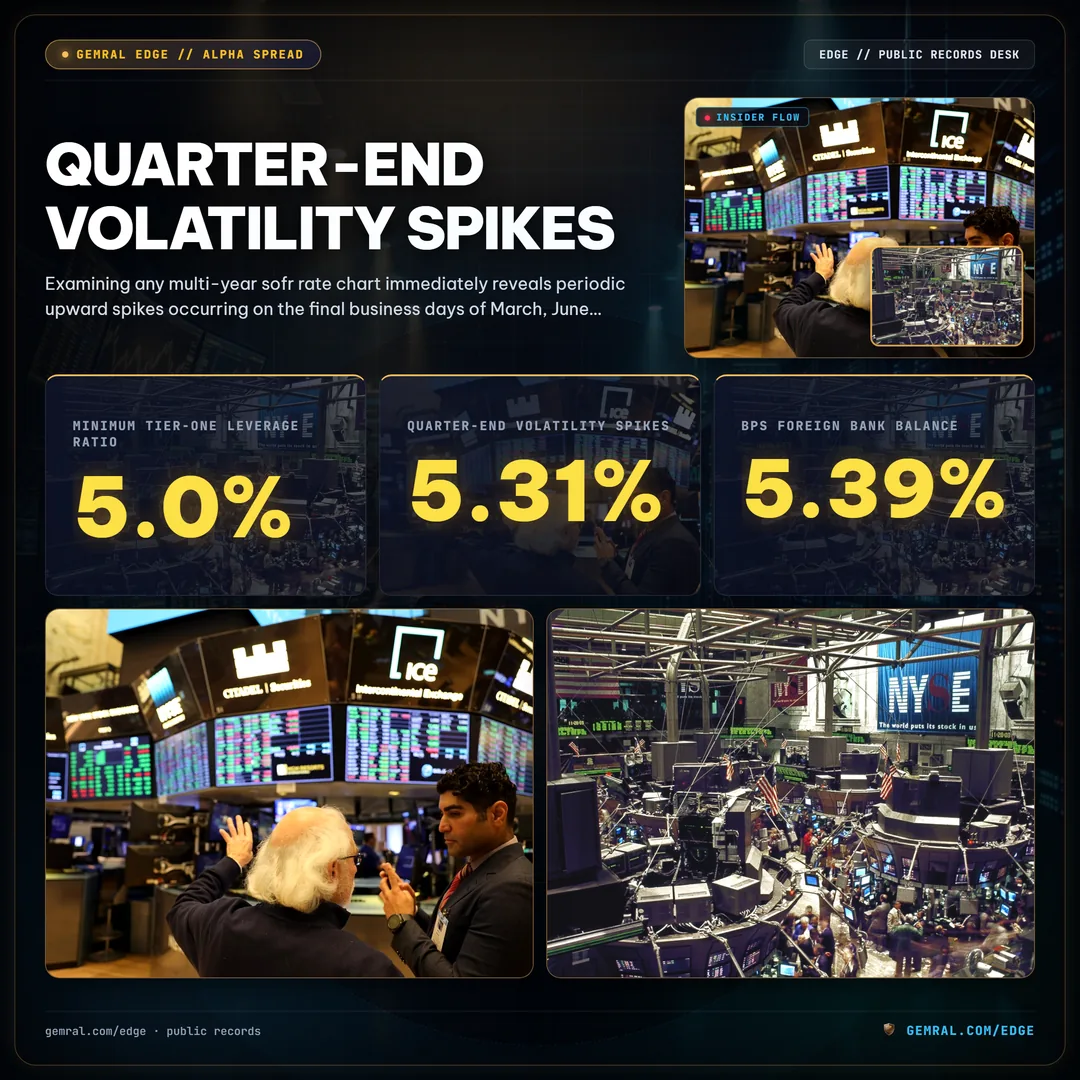
The primary regulatory driver behind quarter-end repo volatility is the Supplementary Leverage Ratio (SLR) and its global counterpart, the Basel III leverage framework. Under standard regulatory accounting rules, global systemically important banks (G-SIBs) are required to maintain a minimum tier-one leverage ratio of 5.0% against their total leverage exposure. Critically, the standard leverage ratio does not risk-weight assets: a zero-risk Treasury repo transaction requires the identical regulatory capital allocation as a higher-yielding commercial asset.
On quarter-end regulatory reporting dates, European and Japanese banking institutions calculate their leverage ratios based on single-day balance sheet snapshots. Consequently, foreign bank broker-dealers aggressively contract their repo borrowing and lending activities in the final 48 hours of each quarter to shrink their total balance sheets, temporarily reducing their leverage denominators. When major foreign dealers withdraw hundreds of billions of dollars in repo intermediation capacity simultaneously, domestic U.S. cash borrowers are forced to compete aggressively for a sharply diminished pool of available overnight funding, driving SOFR sharply higher.
| Quarter-End Settlement Date | Pre-Quarter SOFR Base | Quarter-End Spike Level | Intraday Spread Expansion | Underlying Market Driver |
|---|---|---|---|---|
| September 30, 2023 | 5.31% | 5.39% | +8 bps | Foreign bank balance sheet contraction & Treasury coupon settlement |
| December 29, 2023 | 5.35% | 5.40% | +5 bps | Year-end balance sheet window dressing & G-SIB surcharge score mitigation |
| March 28, 2024 | 5.31% | 5.34% | +3 bps | Moderate dealer balance sheet friction; SRF counterparty testing active |
| June 28, 2024 | 5.33% | 5.41% | +8 bps | Corporate quarterly tax date drain combined with Treasury auction settlement |
| September 30, 2024 | 4.85% | 4.97% | +12 bps | Acute dealer inventory absorption limit; SOFR breached IORB by 7 bps |
| December 31, 2025 | 4.62% | 4.78% | +16 bps | Year-end balance sheet lockup; $85B interdealer volume repriced higher |
The table above underscores the systematic nature of these dislocations. While market infrastructure reforms and standing backstops have prevented a recurrence of the extreme 311 basis point spike observed in September 2019, modern quarter-end spreads frequently widen by 8 to 16 basis points above baseline levels. For active cash managers and systematic quantitative funds, forecasting quarter-end SOFR volatility enables tactical cash deployment into high-yielding repo facilities, capturing annualized premium returns with sovereign collateral security.
The Standing Repo Facility and Discount Window: Central Bank Liquidity Backstops Under Stress
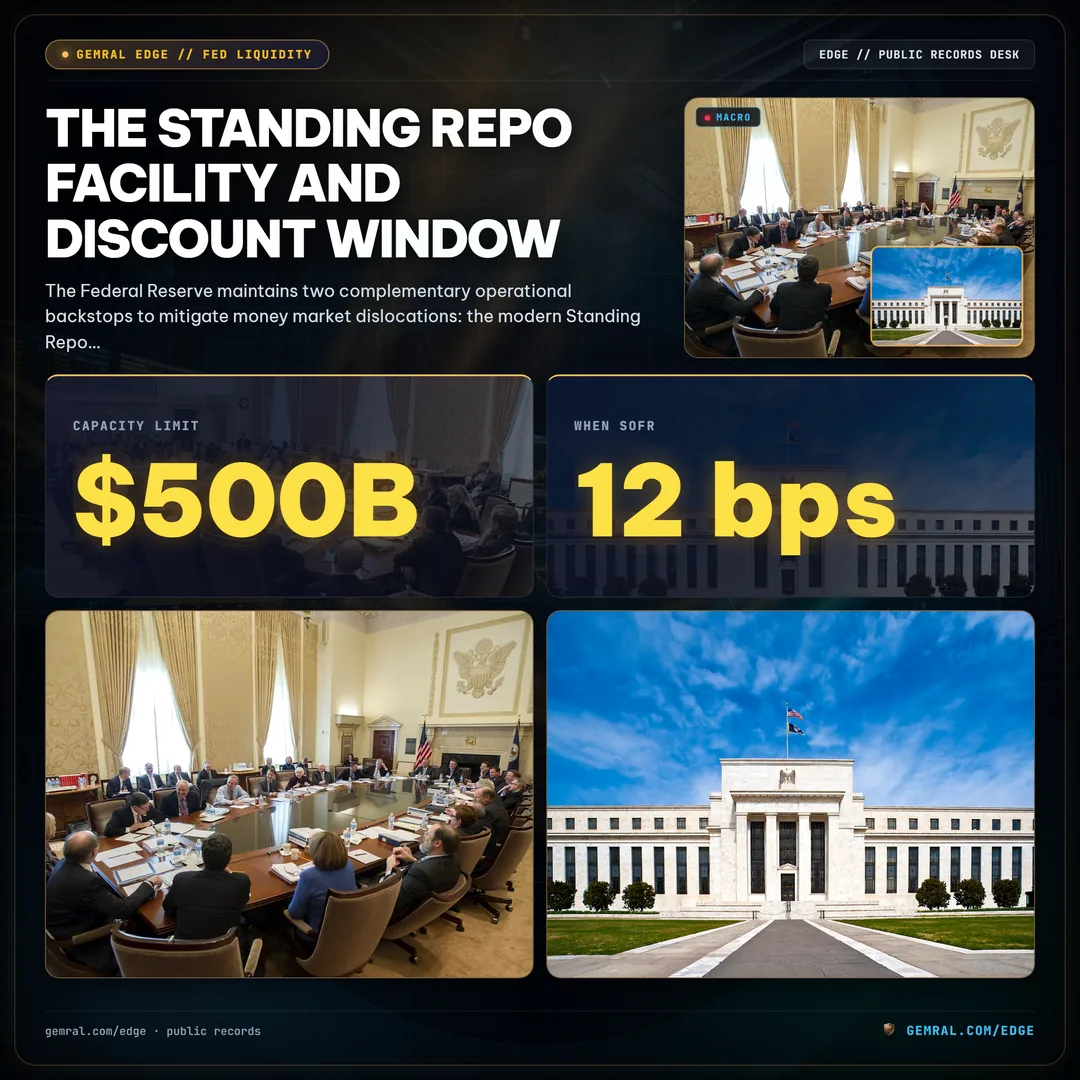
The Federal Reserve maintains two complementary operational backstops to mitigate money market dislocations: the modern Standing Repo Facility (SRF) and the traditional Discount Window. While both facilities provide emergency cash from the central bank, their operational parameters, legal mechanisms, and institutional perception differ fundamentally.
The Discount Window, operated under Section 10B of the Federal Reserve Act as Primary Credit, offers overnight advances to solvent commercial banks against an extensive variety of collateral, including commercial loans, municipal bonds, and corporate debt. However, the Discount Window suffers from a well-documented and historically persistent institutional affliction: borrowing stigma. Market participants historically feared that borrowing from the Discount Window would signal financial distress to regulators, rating agencies, and counterparties. During the March 2023 regional banking panic, many distressed banks delayed accessing the Discount Window despite severe deposit runs, exacerbating liquidity contagion.
In contrast, the standing repo facility was engineered from inception to be stigma-free and operationally proactive. The facility conducts standard repo operations—true sales with commitments to repurchase—rather than collateralized credit advances. Furthermore, the New York Fed actively encourages eligible counterparties to utilize the SRF during regular operational test windows to normalize participation. Key operational distinctions include:
- Target Counterparties: The Discount Window interfaces exclusively with depository commercial banks. The SRF bridges both depository institutions and designated primary dealers, ensuring non-bank broker-dealers holding primary sovereign debt inventories can access central bank cash directly.
- Eligible Collateral Spectrum: The Discount Window accepts wide-ranging bank assets subject to variable haircuts. The SRF strictly restricts collateral to Tier-1 System Open Market Account (SOMA) eligible paper: U.S. Treasury securities, Agency debt, and Agency mortgage-backed securities.
- Pricing Mechanism: SRF operations execute at an administered minimum bid rate set at the top of the FOMC's federal funds target band, serving as an automatic economic circuit-breaker whenever private repo rates spike above policy boundaries.
- Operational Daily Ceiling: The SRF maintains an aggregate daily capacity limit of $500 billion, with the Desk empowered to expand capacity immediately should systemic financial dislocations require unlimited collateralized backstops.
During the market stress episode of late September 2024, when SOFR spiked 12 basis points on quarter-end balance sheet contraction, primary dealers accessed the Standing Repo Facility for several billion dollars in overnight financing. The facility functioned precisely as intended: private repo rates were capped, dealer balance sheets stabilized, and the dislocation dissipated within 24 hours without spilling into wider commercial credit channels.
Quantitative Tightening and Sovereign Debt Issuance: Primary Dealer Absorption Capacity
The broader macroeconomic environment governing the sofr rate chart is dictated by the interaction between the Federal Reserve's balance sheet reduction program—commonly known as quantitative tightening (QT)—and the United States Department of the Treasury's unprecedented sovereign debt issuance schedule.

Since the initiation of balance sheet runoff in June 2022, the Federal Reserve has allowed up to $60 billion in Treasury securities and $35 billion in Agency MBS to mature each month without reinvestment. This process steadily contracts the central bank's assets from a peak near $8.96 trillion toward $6.80 trillion. On the liability side of the Fed's balance sheet, QT is funded through two primary mechanisms: the drawdown of the Overnight Reverse Repo (ON RRP) facility and the contraction of commercial bank reserves.
Throughout 2022 and 2023, the drawdown of the ON RRP facility acted as a massive liquidity sponge in reverse, sterilizing the contractionary impact of QT. Non-bank money market funds shifted cash out of the Fed's RRP facility to purchase newly issued Treasury bills offering attractive yields. As a result, the RRP facility collapsed from $2.55 trillion in early 2023 to under $285 billion by late 2024, leaving commercial bank reserves insulated near $3.25 trillion.
Simultaneously, the U.S. Treasury's Quarterly Refunding Announcements (QRA) have established historical records for net sovereign debt issuance. The Treasury must fund annual federal budget deficits exceeding $1.9 trillion while refinancing maturing debt tranches. In 2025 and 2026, total marketable Treasury debt outstanding expanded beyond $28.5 trillion.
Because primary dealers are legally obligated to underwrite and absorb Treasury auctions, dealer inventories of unsold sovereign paper surge whenever auction sizes increase. Primary dealers finance this mounting debt inventory by borrowing cash in the overnight repo market. When dealer warehouses are filled with hundreds of billions of dollars in Treasury notes, dealers become aggressive cash borrowers, driving SOFR and general collateral repo rates upward relative to central bank policy rates. This structural dynamic establishes a durable upward floor for repo spreads throughout the remainder of the sovereign debt issuance cycle.
Operationalizing Repo Signals: Quantitative Frameworks for Institutional Portfolio Allocation
For institutional asset managers, hedge funds, and corporate treasury teams, the historical sofr rate chart provides actionable quantitative signals that extend far beyond money market desks. Cross-asset research demonstrates that overnight financing stress serves as a leading indicator for broader market volatility, equity factor performance, and fixed income term premia.
To institutionalize these insights, macro quantitative frameworks deploy three primary repo-based monitoring rules:
1. The SOFR-IORB Compression Signal: Tracking the daily spread between SOFR and Interest on Reserve Balances (SOFR minus IORB). Under normal conditions of abundant reserves, this spread trades consistently negative (-5 to -10 basis points). When the spread compresses toward zero or turns positive for three consecutive business days, the model flags an early-stage liquidity drain. Historical backtesting indicates that sustained positive SOFR-IORB spreads precede volatility regime shifts in the S&P 500 and Russell 2000 by an average lead time of 8 to 14 trading days.
2. The Treasury Cash-Futures Basis Leverage Monitor: Quantitative hedge funds engage extensively in the Treasury basis trade—purchasing cash Treasury notes, shorting Treasury futures contracts, and leveraging the small yield discrepancy through overnight and term repo markets by 20x to 50x leverage. When SOFR rates spike unexpectedly on quarter-end dates, the borrowing cost to finance cash Treasury legs surges. If financing costs exceed the basis yield, funds are forced to rapidly unwind positions, selling cash Treasuries and triggering sudden curve steepening. Tracking SOFR volatility enables macro managers to anticipate basis trade de-leveraging events.
3. Corporate Treasury Cash Allocation Optimization: Corporate finance departments managing multi-billion-dollar liquidity reserves utilize real-time SOFR tracking to optimize sweep accounts. By shifting cash between direct bank deposits, Government money market funds, and bilateral repo facilities, corporate treasurers capture annualized yield enhancements of 15 to 35 basis points during quarter-end funding crunches without expanding credit risk.
Frequently asked questions
What is the SOFR rate chart and what does it measure?
A SOFR rate chart displays the historical daily benchmark interest rate for overnight collateralized financing backed by U.S. Treasury securities, calculated and published each business morning at 8:00 AM Eastern Time by the Federal Reserve Bank of New York.
What is the difference between SOFR, TGCR, and BGCR?
The Tri-Party General Collateral Rate (TGCR) measures solely tri-party repo transactions. The Broad General Collateral Rate (BGCR) includes TGCR plus cleared GCF repo trades. SOFR is the broadest benchmark, encompassing BGCR plus cleared bilateral repo transactions executing through FICC DVP clearing services.
Why does SOFR experience quarter-end volatility spikes?
Quarter-end and month-end SOFR spikes occur due to commercial bank and primary dealer balance sheet constraints under Basel III leverage ratio (SLR) calculations, which cause dealers to contract repo intermediation and drive cash borrowers to bid up collateralized overnight borrowing rates.
How does the Standing Repo Facility (SRF) backstop SOFR volatility?
The Federal Reserve's Standing Repo Facility (SRF) serves as an administrative ceiling for overnight rates. Eligible counterparties can pledge Treasury collateral directly to the Fed at a predetermined minimum bid rate (top of the target corridor), absorbing up to $500 billion daily and preventing severe rate spikes above official policy boundaries.