Congress Stock Trading in 2025: What 2,243 House Stock Trades Show
In our records, congress stock trading in 2025 came down to a short list of names. Across the House stock transactions dated in calendar 2025 that our dataset captured from Periodic Transaction Reports, we counted 2,243 trades filed by 71 members. Four of those members account for 1,248 trades, or 55.6% of the year. Ten members account for 1,702 trades, or 75.9%. One member alone, Rep. Lisa C. McClain (R-MI), reported 640 trades, which is 28.5% of every House stock trade in the dataset.
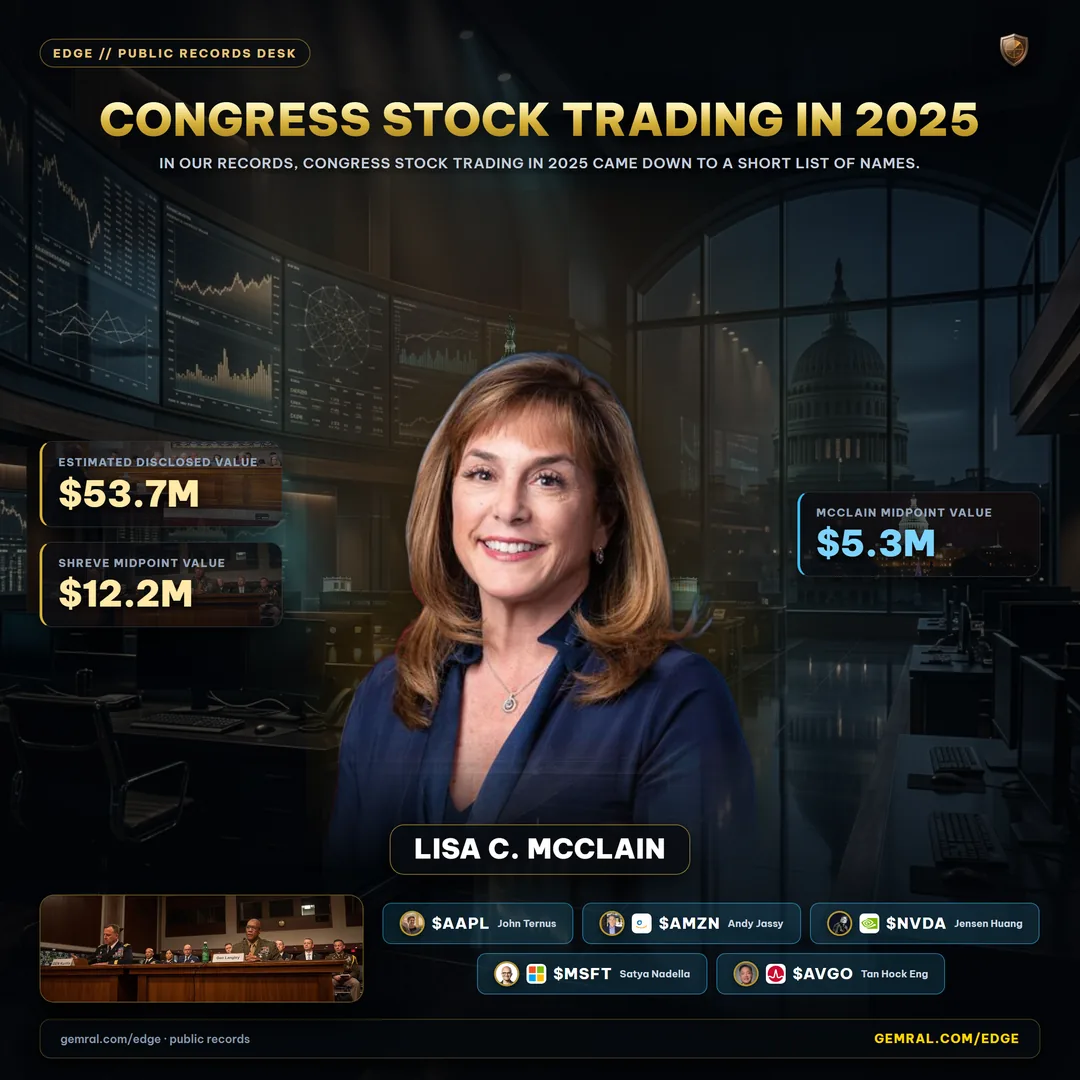
The other numbers in this study run in the same direction. 77.0% of trades sit in the smallest reporting band, $1,001 to $15,000. 56.5% were made in accounts belonging to a spouse, a dependent child, or held jointly rather than by the member alone. 13.9% carry a filing date more than 45 days after the trade on both date fields we check, the outer limit the STOCK Act sets for reporting. And during the four trading days of the April 2025 tariff selloff, the House trades in our records number 108, with purchases outnumbering sales 61 to 47.
Every figure below was computed directly from the transaction records and can be checked line by line against the original filings, which the House Clerk publishes as PDF documents. The full method, including what we excluded and why, sits in the methodology section at the end. Readers who want to follow individual members can open each profile on the congressional trading tracker, and the congressional trading leaderboard ranks members by activity.
Congress Stock Trading in 2025: The Full-Year Numbers
The House of Representatives seats 435 voting members plus non-voting delegates. In our 2025 records, 71 of them reported at least one stock trade with a 2025 transaction date. That figure describes our dataset, not the whole chamber: this study is not a complete census of congressional trading. Some high-volume filers are not captured in our 2025 records, and trackers that also count options, funds, bonds and Senate filings report several times more transactions for the year. The patterns below describe the 2,243 trades we can verify line by line, and the shares should be read as properties of that sample.

Those 71 members reported 2,243 stock transactions spread across 775 distinct securities. Purchases made up 1,182 of the trades, sales made up 1,054, and 7 were reported as exchanges. Put another way, 52.7% of the year's House stock trades were buys. The split is close enough to even that it tells you very little about the direction of the market. What it does show is that the House, as a body of traders, was rebalancing in both directions all year rather than piling into one side.
| Measure (House, transactions dated 2025) | Value |
|---|---|
| Stock trades reported | 2,243 |
| Members with at least 1 trade | 71 |
| Distinct securities traded | 775 |
| Purchases / sales / exchanges | 1,182 / 1,054 / 7 |
| Trades in the $1,001 to $15,000 band | 1,726 (77.0%) |
| Midpoint estimate of disclosed value | about $53.7 million |
| Median days from trade to filing | 29 |
The disclosed value deserves a caution before anyone quotes it. Members do not report exact dollar amounts. They report a band, such as $1,001 to $15,000 or $15,001 to $50,000. To produce a single figure we took the midpoint of each band and added them up, which gives about $53.7 million for the year. The true total could sit well above or below that line, because the bands are wide and the top bands are open-ended. Treat it as an order of magnitude, not an audited sum.
We also checked the Senate. Senate stock trades dated in 2025 in our records number only 58, from 5 senators, which is too thin a sample to compare against the House on equal terms. This study therefore covers the House only, and we say so in every headline figure.
Four Members, More Than Half the Trades
The single clearest pattern in 2025 is concentration. If you lined up all 71 trading members by trade count, the first four would cover more ground than the remaining 67 combined.
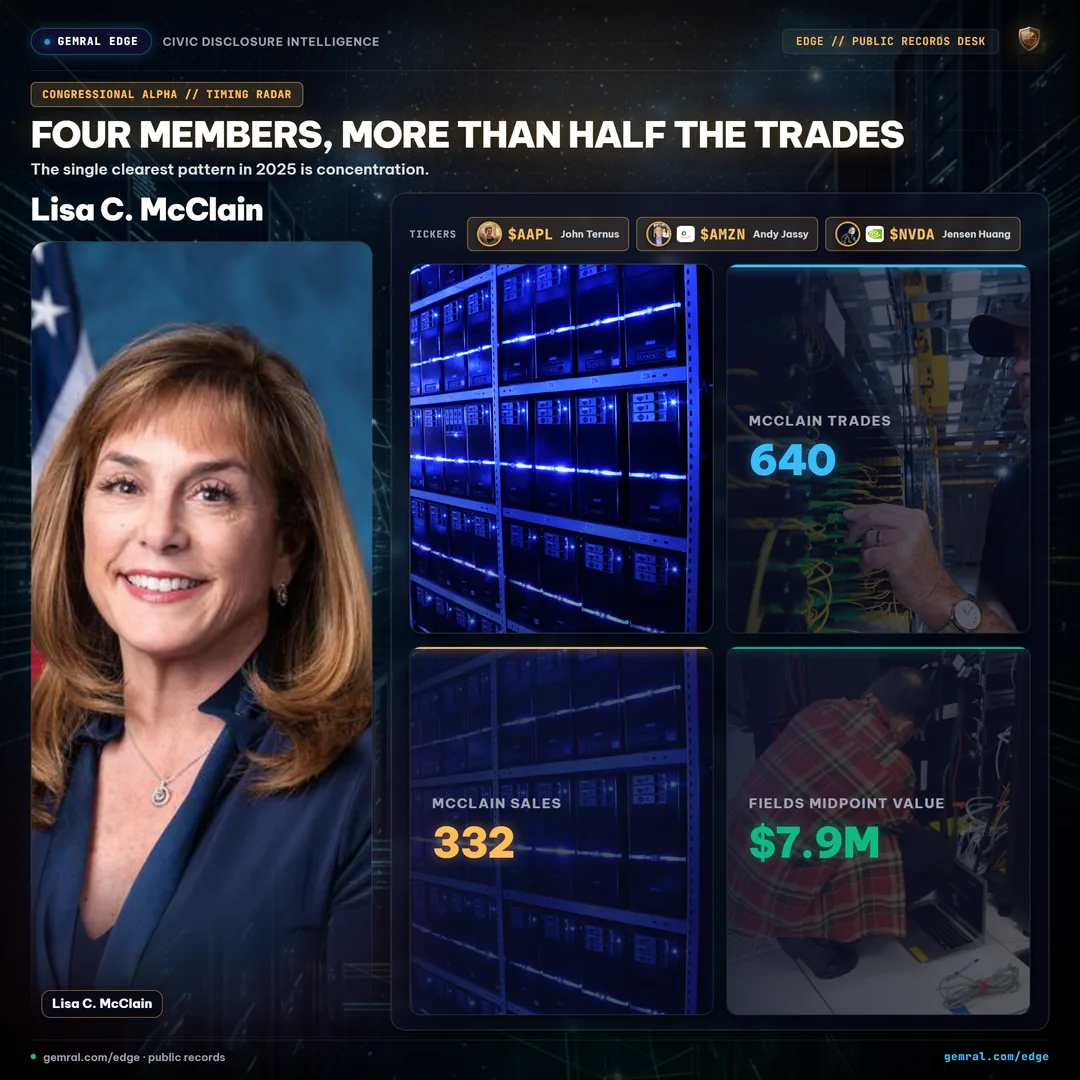
| Member | Trades | Buys / Sells | Distinct tickers | Midpoint value |
|---|---|---|---|---|
| Rep. Lisa C. McClain (R-MI) | 640 | 308 / 332 | 390 | $5.3M |
| Rep. Jefferson Shreve (R-IN) | 249 | 104 / 144 | 173 | $12.2M |
| Rep. Julie Johnson (D-TX) | 237 | 79 / 157 | 150 | $2.0M |
| Rep. Marjorie Taylor Greene (R-GA) | 122 | 122 / 0 | 62 | $1.1M |
| Rep. Bruce Westerman (R-AR) | 98 | 51 / 47 | 74 | $0.9M |
| Rep. Cleo Fields (D-LA) | 95 | 89 / 6 | 26 | $7.9M |
| Rep. Josh Gottheimer (D-NJ) | 88 | 58 / 30 | 61 | $0.7M |
Rep. McClain's 640 trades touched 390 different tickers, which works out to fewer than two trades per ticker on average. That profile, many names and small tickets, looks more like a broadly managed account than a handful of concentrated positions. The filings themselves do not say who places the orders, and this study makes no claim about it. What the numbers do show is that a single member's filing volume can move any "most active trader in Congress" ranking by itself, so headline rankings built on raw trade counts mostly measure account style.
Dollar value tells a different story. Rep. Jefferson Shreve reported 249 trades, under half of Rep. McClain's count, yet the midpoint value of his trades comes to about $12.2 million, the largest of any House member in our 2025 records. Rep. Cleo Fields reported only 95 trades across 26 tickers, and 89 of them were purchases, for a midpoint value of about $7.9 million. Count and value rank members very differently, and any story about "the biggest trader in Congress" has to say which one it means.
Rep. Marjorie Taylor Greene stands out for direction rather than size: all 122 of her reported 2025 trades were purchases, with 0 sales, and her median filing came 3 days after the trade, the shortest median among the 12 most active House traders in our records.
At the other end of the distribution, 19 members reported exactly 1 trade for the whole year and another 18 reported between 2 and 5. Those 37 members are more than half of everyone who traded, yet together they contribute only a sliver of the volume.
| Trades reported in 2025 | Members |
|---|---|
| 1 | 19 |
| 2 to 5 | 18 |
| 6 to 20 | 16 |
| 21 to 100 | 14 |
| More than 100 | 4 |
The Most-Traded Stocks in Congress in 2025
Ranking tickers by raw trade count would reward whichever stock a single high-volume account happened to rebalance most. A more useful question is which stocks drew the most separate members. Ranked that way, Apple leads the House in 2025.
| Ticker | Members trading it | Trades | Buys / Sells |
|---|---|---|---|
| AAPL (Apple) | 16 | 34 | 23 / 11 |
| UNH (UnitedHealth) | 14 | 19 | 11 / 8 |
| AMZN (Amazon) | 12 | 21 | 18 / 3 |
| PG (Procter & Gamble) | 12 | 15 | 9 / 6 |
| NVDA (Nvidia) | 11 | 34 | 31 / 3 |
| MSFT (Microsoft) | 11 | 19 | 14 / 5 |
| AVGO (Broadcom) | 10 | 18 | 15 / 3 |
| META (Meta Platforms) | 9 | 22 | 16 / 6 |
Nvidia is the most one-sided name on the list. Of the 34 Nvidia trades House members reported with 2025 transaction dates, 31 were purchases and 3 were sales. Nine different members bought it. Broadcom shows the same tilt, 15 buys against 3 sells, and so does Amazon, 18 buys against 3 sells. Those three tickers are the core of the AI and cloud build-out trade that dominated equity markets in 2025, and House members leaned into them on the buy side.
UnitedHealth is the opposite kind of entry. It drew 14 different members, the second-widest participation of any stock, but the trades split almost evenly, 11 buys and 8 sells. UnitedHealth was one of the most volatile large-cap stocks of 2025, after the company suspended its guidance and its chief executive stepped down in May. House members traded it in both directions, and the filings record the trade, not the reason.
The broad spread matters as much as the leaders. 775 distinct securities appear in the House trading record for 2025. The eight names above account for 182 trades between them, so most congressional trading happens in a long tail of stocks that rarely draw more than one or two members.
Republican vs Democratic Trading Patterns in 2025
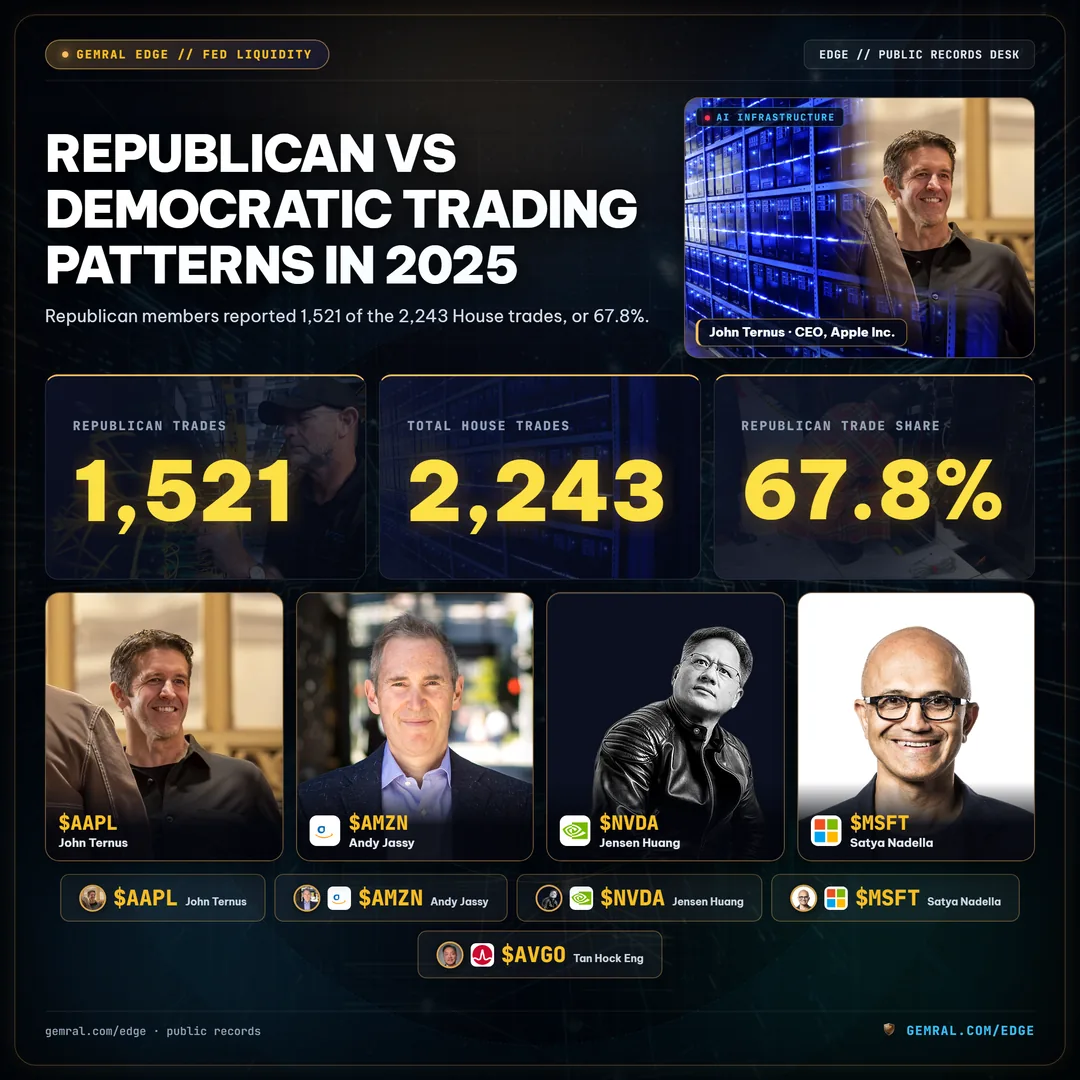
Republican members reported 1,521 of the 2,243 House trades, or 67.8%. Democratic members reported 722. The member counts are closer than the trade counts: 39 Republicans and 32 Democrats reported at least one trade. That works out to about 39.0 trades per trading Republican and about 22.6 per trading Democrat, a gap that shrinks considerably once you remember that Rep. McClain's 640 trades sit on the Republican side of the ledger.
| Party | Members trading | Trades | Buys / Sells | Midpoint value | Most widely traded tickers |
|---|---|---|---|---|---|
| Republican | 39 | 1,521 | 814 / 705 | $29.9M | AAPL (11 members), UNH (10), AMZN (9), UPS (8), JNJ (7) |
| Democratic | 32 | 722 | 368 / 349 | $23.8M | NVDA (6 members), MSFT (6), AVGO (6), AAPL (5), NFLX (5) |
The ticker lists are where the parties separate. The most widely traded stocks among Republican members lean toward large consumer, healthcare and logistics names: Apple, UnitedHealth, Amazon, UPS and Johnson & Johnson. Among Democratic members, the top of the list is semiconductors and software: Nvidia, Microsoft and Broadcom, each traded by 6 Democratic members. Democratic members also traded Nvidia 26 times, the most trades of any ticker on either party's list above.
The midpoint values are closer than the trade counts suggest. Republicans reported about $29.9 million in midpoint value and Democrats about $23.8 million, because several Democratic members traded in fewer, larger tickets. On a dollars basis, the partisan gap in House stock trading in 2025 was far narrower than a simple trade count implies.
Month by Month: When the House Traded in 2025
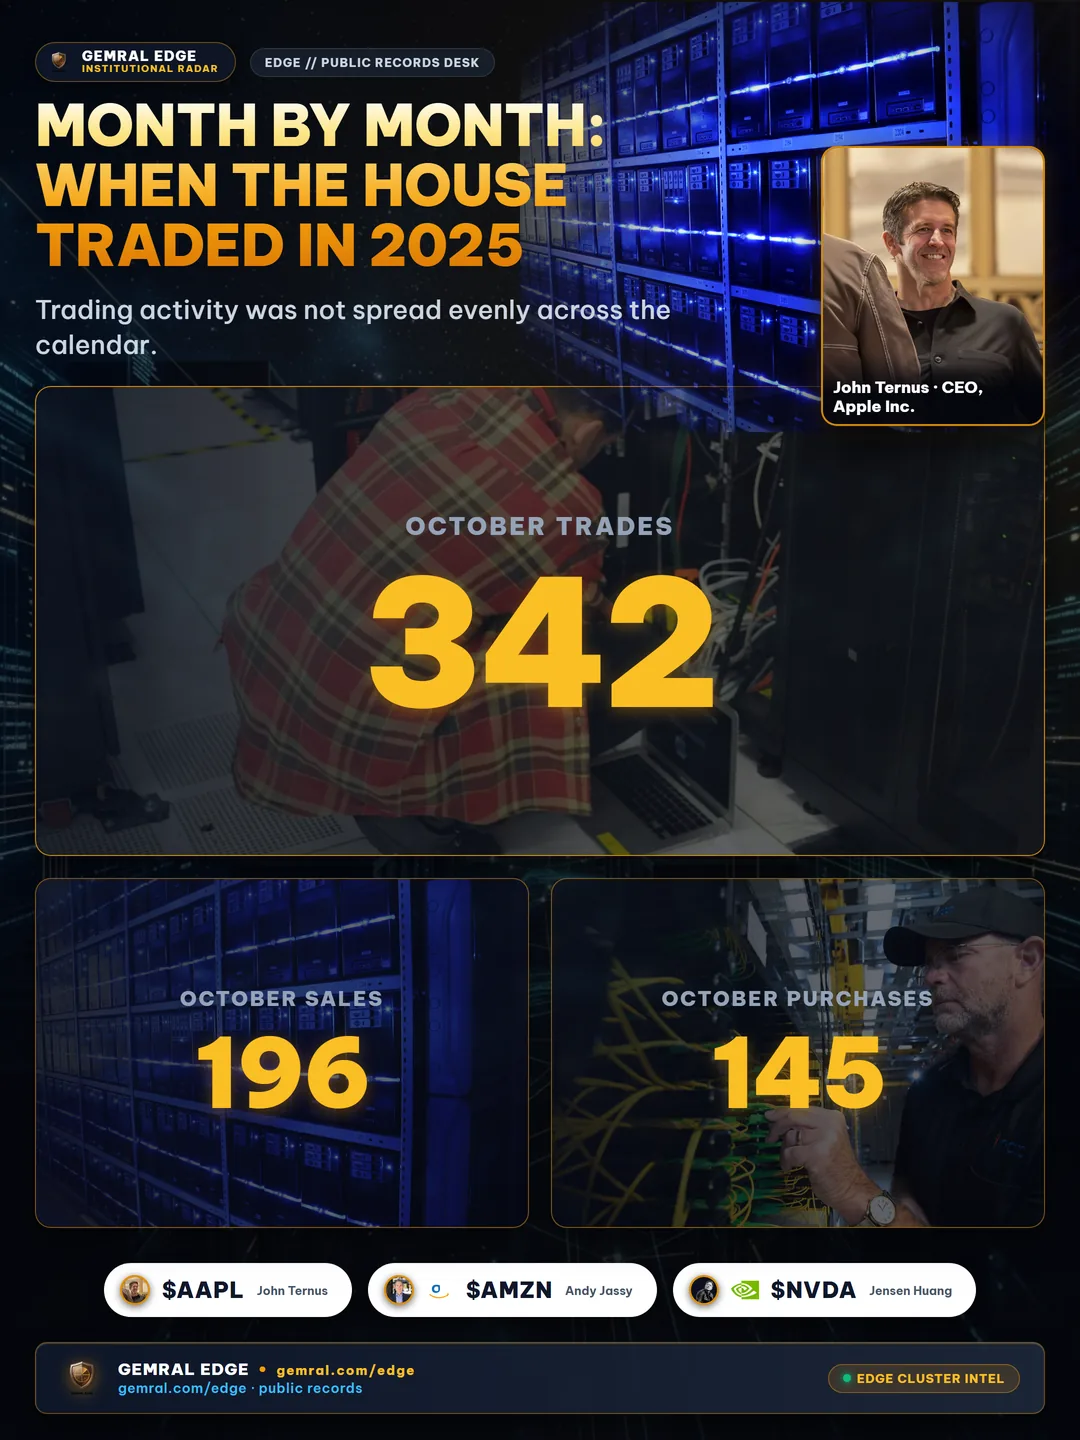
Trading activity was not spread evenly across the calendar. October 2025 was the busiest month, with 342 trades from 25 members, and it was a selling month: 196 sales against 145 purchases. March 2025 came second with 305 trades, split almost exactly down the middle at 152 purchases and 153 sales. November was the quietest month of the year, with 58 trades from 14 members.
| Month (2025) | Trades | Buys | Sells | Members |
|---|---|---|---|---|
| January | 130 | 99 | 31 | 21 |
| February | 132 | 88 | 43 | 25 |
| March | 305 | 152 | 153 | 26 |
| April | 260 | 109 | 151 | 21 |
| May | 177 | 77 | 100 | 16 |
| June | 266 | 188 | 78 | 22 |
| July | 188 | 93 | 94 | 20 |
| August | 149 | 91 | 58 | 22 |
| September | 135 | 61 | 74 | 16 |
| October | 342 | 145 | 196 | 25 |
| November | 58 | 42 | 15 | 14 |
| December | 101 | 37 | 61 | 23 |
Two months show a clear direction. January leaned hard toward buying, 99 purchases against 31 sales. June leaned the same way, 188 purchases against 78 sales, the widest buy margin of any month. April and May leaned toward selling: 151 sales against 109 purchases in April, and 100 sales against 77 purchases in May.
Between April 3 and April 8, 2025, the four trading days after the White House announced broad new tariffs on April 2 and before the 90-day pause was announced on April 9, our records hold 108 House trades from 10 members. Purchases outnumbered sales 61 to 47. In the following week, April 9 to April 15, activity fell to 28 trades from 14 members, 18 purchases and 10 sales.
That April pattern is worth stating carefully. Within our records, the members who traded were net buyers during one of the sharpest market drops of the year, and trading volume fell once the pause was announced. Other newsroom counts that include more filers and asset types report far higher April volume, so the 108 figure is a floor, not a total. The filings do not show why any member traded, and buying into a falling market is also what a long-term investor or an automated rebalancing account would be expected to do. The data supports the timing; it does not support any claim about motive.
Spouses, Joint Accounts and Dependents: Who Owns the Trade
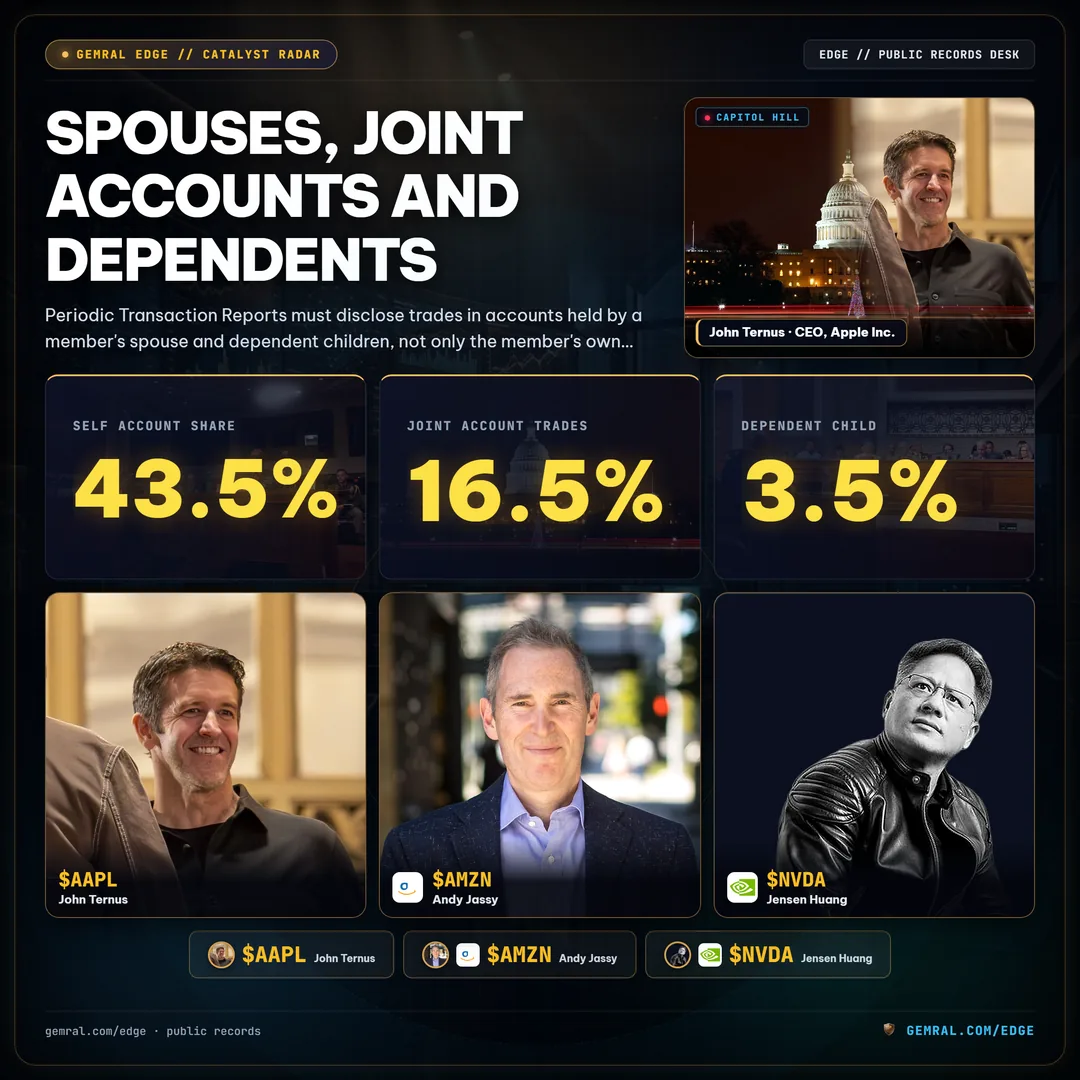
Periodic Transaction Reports must disclose trades in accounts held by a member's spouse and dependent children, not only the member's own accounts. In 2025, most of the House's stock trades fell into those other categories.
| Account owner listed on the filing | Trades | Share |
|---|---|---|
| Member (self) | 975 | 43.5% |
| Spouse | 818 | 36.5% |
| Joint | 371 | 16.5% |
| Dependent child | 79 | 3.5% |
Taken together, 1,268 trades, or 56.5% of the year, were made in an account that was not the member's alone. That number is central to the policy debate. Several of the trading-ban bills introduced in recent sessions would extend restrictions to spouses and dependents, while others would cover only the member. A ban limited to the member's own accounts would, on 2025 numbers, have left 1,268 of 2,243 trades outside its scope. For the current state of those bills, see our explainer on the congressional stock trading ban debate.
The spouse share also explains why individual members can show trading patterns that look nothing like their public profile. A member who never discusses markets can still have a spouse whose account trades weekly, and the law treats both the same way for disclosure purposes.
The Reporting Clock: How Fast Members Disclosed Their Trades
The STOCK Act of 2012 requires members to report a covered transaction within 30 days of learning about it, and in no case later than 45 days after the transaction itself. We measured the gap between each trade and its filing date for all 2,243 House trades dated in 2025.

| Days from trade to filing | Trades | Share |
|---|---|---|
| 30 days or fewer | 1,191 | 53.1% |
| 31 to 45 days | 614 | 27.4% |
| More than 45 days on both date fields | 311 | 13.9% |
| More than 45 days on one date field only | 127 | 5.7% |
The median trade was filed 29 days after it happened. 80.5% of trades were filed inside the 45-day line. The 311 trades in the third row, 13.9% of the year, came from 10 members and show a filing date more than 45 days after the transaction no matter which of the two filing dates in the record we use.
We are deliberately conservative here. Our records carry two date fields for each filing, and in 127 cases they disagree about whether the 45-day line was crossed, usually because a report was later amended or re-filed. Those 127 trades are counted separately and are not described as late. A filing date past 45 days is also not, on its own, proof of a violation: amendments that correct an earlier timely report, and trades the member legitimately learned about later, can both produce a long gap. We are therefore not naming individual members in this section. Journalists who want to examine a specific case can match any trade to its original PDF on the House Clerk's disclosure site, where the filing date is printed on the document.
For background on how the reporting window works in practice, our guide to how congressional stock disclosures work walks through the 30-day and 45-day rules.
Small Tickets, Big Totals: The Dollar Bands Behind 2025 Trades
The image of congressional trading as a stream of large, well-timed bets does not match most of the record. 1,726 of the 2,243 House trades, 77.0%, were reported in the lowest band, $1,001 to $15,000. Another 348, or 15.5%, sat in the $15,001 to $50,000 band.

| Reported amount band | Trades |
|---|---|
| $1,001 to $15,000 | 1,726 |
| $15,001 to $50,000 | 348 |
| $50,001 to $100,000 | 82 |
| $100,001 to $250,000 | 60 |
| $250,001 to $500,000 | 9 |
| $500,001 to $1,000,000 | 3 |
| Above $1,000,000 | 2 |
Only 14 trades in the entire year were reported in bands above $250,000. Those 14 trades, however, carry a large share of the estimated dollar value, which is why the midpoint total of about $53.7 million is driven far more by a few large tickets than by the 1,726 small ones. When a story leads with the dollar value of congressional trading, it is mostly describing a few dozen trades; when it leads with trade counts, it is mostly describing small, frequent rebalancing.
The band system itself limits what anyone can say. A trade reported as $1,001 to $15,000 could be worth $1,001 or $15,000, a 15-fold range. Until disclosure rules require exact amounts, any total value figure for congressional trading, including ours, is an estimate.
Methodology and Limitations
This study covers stock transactions reported on Periodic Transaction Reports by members of the U.S. House of Representatives, with a transaction date between January 1, 2025 and December 31, 2025, as recorded in our congressional trading dataset on October 14, 2026. The dataset is compiled from the public filings the House Clerk posts as PDF documents. Each transaction keeps a link to its source filing.
- Scope: House members only. Senate transactions dated in 2025 number 58 in our records, too few for a fair comparison, and are excluded.
- Counting: Each line item on a filing counts as 1 trade. A member who buys the same stock twice on different days appears twice.
- Value: Dollar figures use the midpoint of each reported band. They are estimates, not exact amounts.
- Timing: Days to filing are measured from transaction date to filing date. A trade is described as past 45 days only when both filing date fields in our record agree.
- Late filings and corrections: Trades from 2025 that are reported after October 14, 2026 are not included. Counts can change slightly as late reports and amendments arrive.
- No inference about intent: Disclosure filings record that a trade happened. They do not record who made the decision or why. Nothing in this study suggests any member traded on non-public information.
Reporters and researchers who want the underlying tables for a story, including per-member and per-ticker breakdowns for 2025, can request them through the congressional trading tracker, or browse the live member-by-member view at Gemral Edge congressional intelligence. Individual filings can be verified on the House Clerk financial disclosure search, and the text of the STOCK Act is available on Congress.gov.
Disclaimer: Public data · not investment advice. This study describes transactions reported in public congressional disclosure filings for research and journalism. It makes no recommendation to buy or sell any security and makes no allegation of wrongdoing by any member of Congress.
Frequently asked questions
How many stock trades did members of Congress make in 2025?
Our dataset holds 2,243 House stock trades with 2025 transaction dates from 71 members: 1,182 purchases, 1,054 sales and 7 exchanges. It is not a complete census; trackers that also count options, funds, bonds and Senate filings report more transactions.
Which member of Congress traded the most stocks in 2025 in this dataset?
In our records, Rep. Lisa C. McClain (R-MI) reported 640 trades across 390 tickers, 28.5% of the 2,243 House stock trades captured. By estimated dollar value, Rep. Jefferson Shreve (R-IN) led with about $12.2 million in midpoint value across 249 trades.
What stocks did Congress trade most in 2025?
Apple was traded by the most House members (16), followed by UnitedHealth (14), Amazon and Procter & Gamble (12 each), and Nvidia and Microsoft (11 each). Nvidia was the most one-sided: 31 purchases against 3 sales.
How many congressional stock trades were reported late in 2025?
311 of 2,243 House trades, or 13.9%, show a filing date more than 45 days after the transaction on both date fields in the record. The median trade was filed 29 days after it happened. A long gap alone does not prove a violation, because amendments can produce it.