Global Liquidity Index: Tracking Central Bank Balance Sheets, M2 Expansion, and the $170 Trillion Sovereign Money Wave
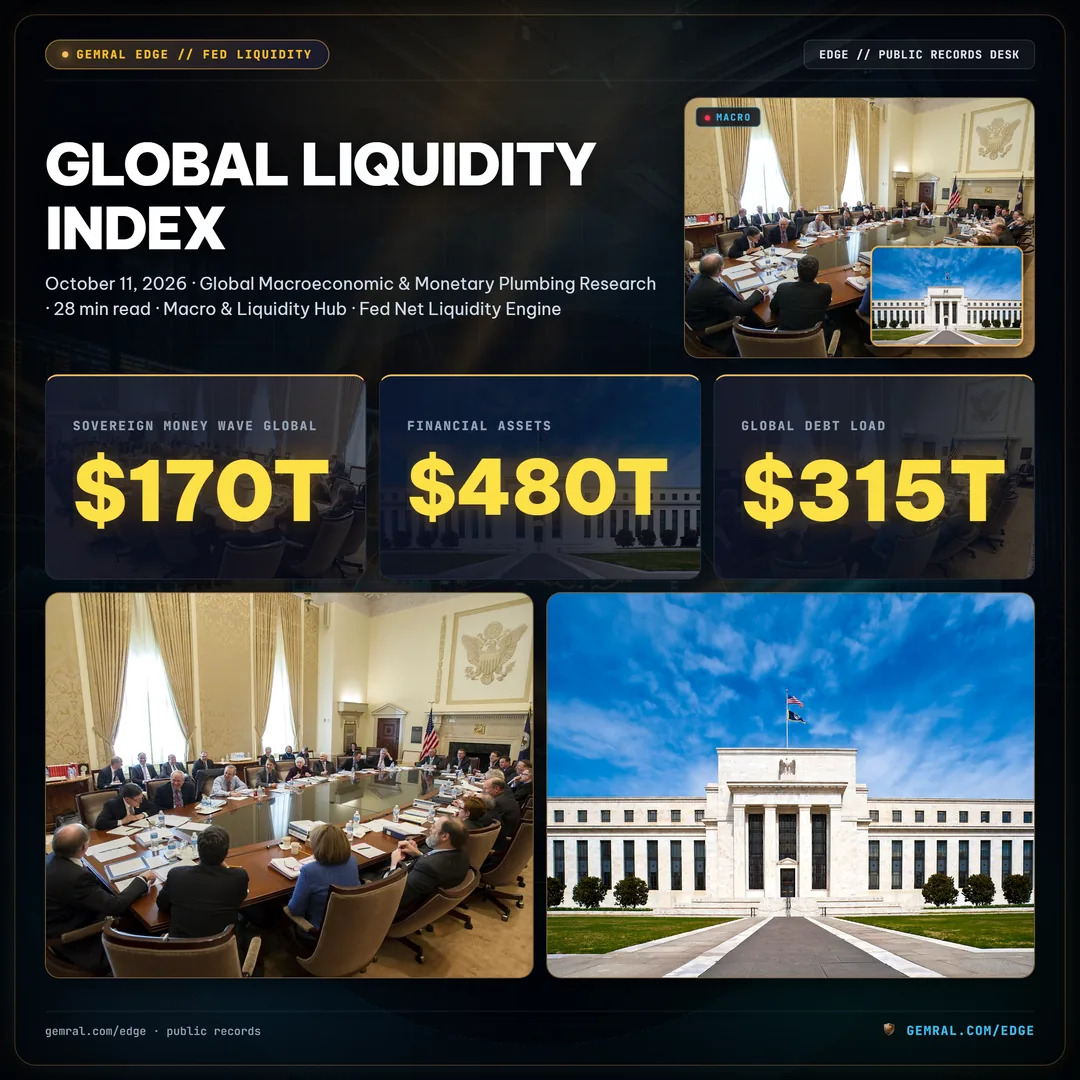
Across the spectrum of macroeconomic intelligence, financial headlines remain transfixed by lagging corporate earnings announcements and isolated interest rate decisions. Yet institutional capital allocators operating at the sovereign scale recognize that asset prices do not trade on corporate press releases. In modern capital markets, asset prices are primarily determined by the ebbs and flows of the global liquidity index: an aggregate monetary ocean measuring over $170 trillion in unencumbered credit, central bank reserves, and cross-border broad money supply.
When the global liquidity index surges, risk assets across global equities, high-yield credit, precious metals, and cryptocurrencies experience violent upward multiple expansions. Conversely, when central banks orchestrate coordinated balance sheet runoffs or fiscal authorities lock sovereign cash in central bank vaults, market valuations compress regardless of corporate profitability. As detailed in our comprehensive coverage at the Macro & Liquidity Hub, tracing the quantitative plumbing of this $170 trillion pool provides an indispensable operational edge for institutional investors.
The Global Liquidity Index Framework: Tracking the $170 Trillion Sovereign Money Pool
The global liquidity index serves as the definitive aggregate benchmark for total purchasing power circulating throughout the world's formal and shadow banking systems. Developed to rectify the analytical blindness of tracking single-nation monetary metrics in an intensely interconnected financial ecosystem, the index aggregates the balance sheets of the major global central banks alongside commercial banking broad money aggregates, cross-border credit facilities, and non-bank institutional collateral velocity.
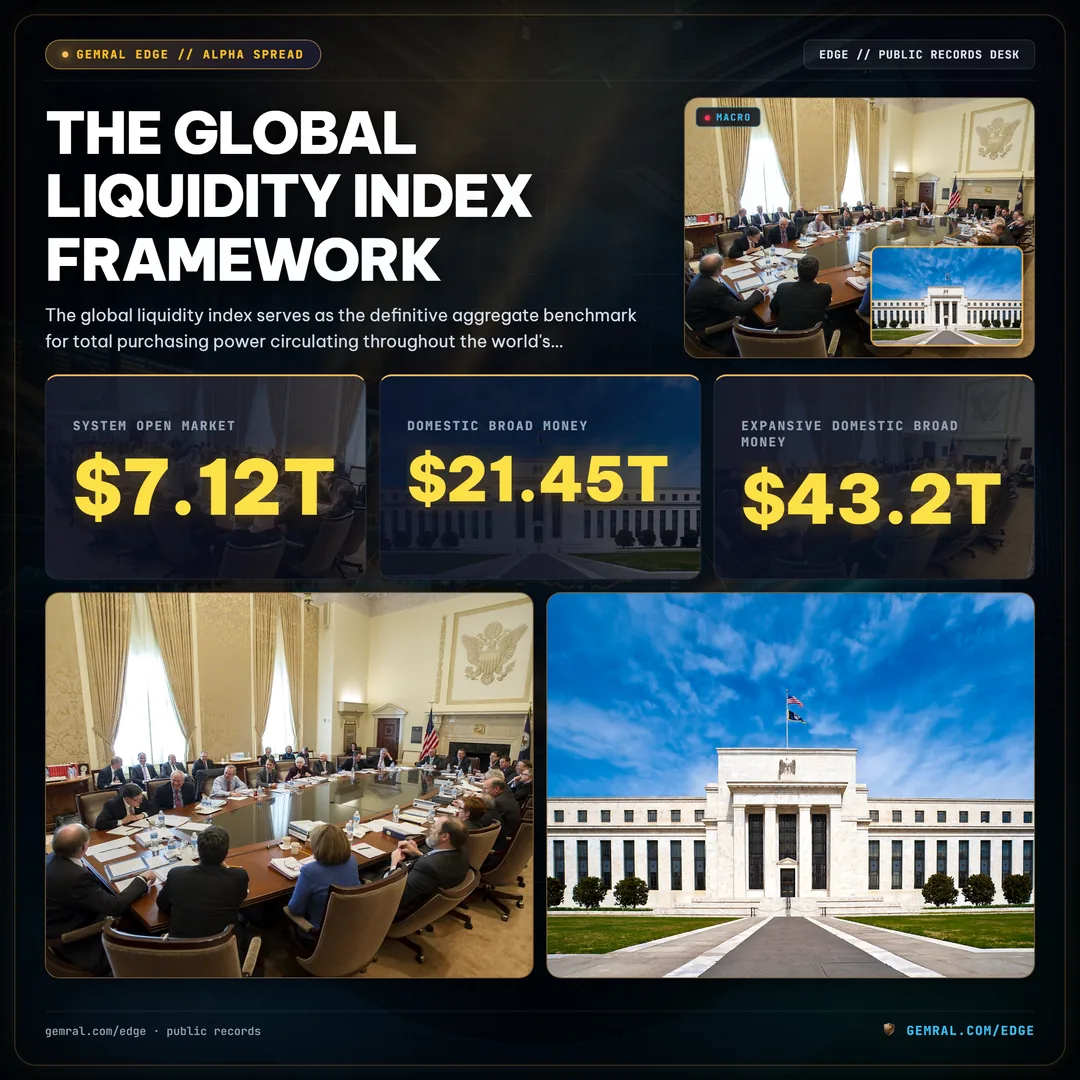
At its core, global liquidity is not merely cash in circulation. Rather, it represents the ease with which sovereign balance sheets, financial intermediaries, multinational corporations, and sovereign wealth funds can access unencumbered settlement media to fund obligations and finance asset purchases. Today, the world's total financial assets exceed $480 trillion, supported by a global debt load of $315 trillion. When total debt outweighs annual gross domestic product by more than 3.2 to 1, financial systems cease to function as traditional capital-raising mechanisms. Instead, they transform into giant debt-refinancing engines where constant liquidity injections are mandatory simply to prevent structural settlement insolvencies.
Tracking the global liquidity index reveals that monetary conditions are driven by four dominant sovereign jurisdictions, often termed the "Big 4":
- The Federal Reserve (United States): Holding $7.12 trillion in total system open market account assets, with domestic broad money M2 reaching $21.45 trillion and the global reserve currency status establishing dollar funding as the primary determinant of international credit conditions.
- The People's Bank of China (PBoC): Overseeing an expansive domestic broad money M2 supply of $43.2 trillion (converted at USD/CNY 7.12), representing the single largest source of raw credit creation in global manufacturing and infrastructure finance.
- The European Central Bank (ECB): Maintaining total balance sheet assets of $6.85 trillion (€6.32 trillion), directing euro-denominated banking credit and commercial paper liquidity across 20 eurozone member nations.
- The Bank of Japan (BoJ): Controlling $5.38 trillion (¥812 trillion) in balance sheet assets, where monetary policy decisions, yield curve control parameters, and foreign exchange interventions directly influence trillions of dollars in global yen carry trade leverage.
Together with secondary sovereign central banks—including the Bank of England ($1.15 trillion balance sheet), the Swiss National Bank ($935 billion), and the Bank of Canada ($320 billion)—these institutions govern the baseline creation of high-powered sovereign base money that underpins the entire global financial superstructure.
The Quantitative Equation: How the Global Liquidity Index Is Calculated Across Central Banks
To construct a rigorous, actionable global liquidity index, quantitative analysts must transcend simple balance sheet additions. Raw asset numbers fail to account for cash held idle inside central bank facilities, nor do they capture currency fluctuations against the world's primary pricing unit, the U.S. dollar.

$$\text{GLI} = \sum_{i=1}^{n} \left[ \left( \text{CB\_Assets}_i - \text{Gov\_Cash}_i - \text{Reverse\_Repo}_i \right) \times \text{FX}_i \right] + \text{Commercial\_Credit} + \text{Shadow\_Collateral}$$ Where central bank assets are adjusted downward for sovereign government cash balances (such as the U.S. Treasury General Account) and sterile deposit facilities (such as the Overnight Reverse Repurchase Facility), converted to U.S. dollars at spot exchange rates.
Let us examine the mechanics of each sovereign constituent within the mathematical pipeline:
- Adjusted Federal Reserve Net Liquidity: Fed total assets ($7.12 trillion) minus the Treasury General Account balance ($850 billion) minus the Overnight Reverse Repo facility ($294 billion), yielding $5.976 trillion in net domestic high-powered reserves. As explored in our deep-dive on the Treasury General Account Balance and Bank Reserves, a surge in the TGA directly extinguishes this pool.
- Adjusted European Central Bank Net Liquidity: Total Eurosystem balance sheet assets (€6.32 trillion) minus government deposits (€285 billion) minus the deposit facility surplus, converted at spot EUR/USD 1.085, adding $6.55 trillion to the global liquidity aggregate.
- Adjusted People's Bank of China Credit Impulse: PBoC central bank claims plus commercial bank medium-term lending facilities (MLF) and required reserve ratio (RRR) adjustments, tracking quarterly net injections converted at spot USD/CNY 7.12, providing approximately $11.85 trillion in effective baseline liquidity.
- Adjusted Bank of Japan Liquidity Footprint: BoJ balance sheet assets (¥812 trillion) minus government current accounts, converted at USD/JPY 151.2, contributing $5.37 trillion in sovereign base money, supplemented by substantial domestic commercial bank liquidity pools.
| Central Bank Entity | Gross Assets (Local Currency) | Gross Assets (USD Equivalent) | Government Cash & Sterilization Deductions | Net High-Powered Liquidity (USD) | Year-over-Year Velocity |
|---|---|---|---|---|---|
| Federal Reserve (FED) | $7.12 Trillion USD | $7.12 Trillion | $1.144 Trillion (TGA + RRP) | $5.976 Trillion | +4.2% (Reserve expansion) |
| People's Bank of China (PBoC) | ¥45.2 Trillion CNY | $6.35 Trillion | ¥3.8 Trillion (Gov fiscal deposits) | $5.815 Trillion | +8.8% (RRR rate cuts) |
| European Central Bank (ECB) | €6.32 Trillion EUR | $6.85 Trillion | €285 Billion (Government accounts) | $6.541 Trillion | -3.1% (APP/PEPP runoff) |
| Bank of Japan (BoJ) | ¥812 Trillion JPY | $5.38 Trillion | ¥42 Trillion (Treasury current balances) | $5.102 Trillion | +1.8% (JGB reinvestments) |
| Secondary Central Banks (BoE, SNB, BoC, RBA) | Multiple Local Currencies | $3.85 Trillion | $480 Billion (Aggregate fiscal buffers) | $3.370 Trillion | +0.6% (Neutral policy stance) |
| Aggregate Core Sovereign Liquidity | Multi-Currency Composite | $29.55 Trillion | $2.749 Trillion | $26.804 Trillion | +3.9% Net Annual Pulse |
Central Bank Balance Sheets, M2 Money Supply, and the Dollar Index: The Four Primary Pillars of Global Liquidity
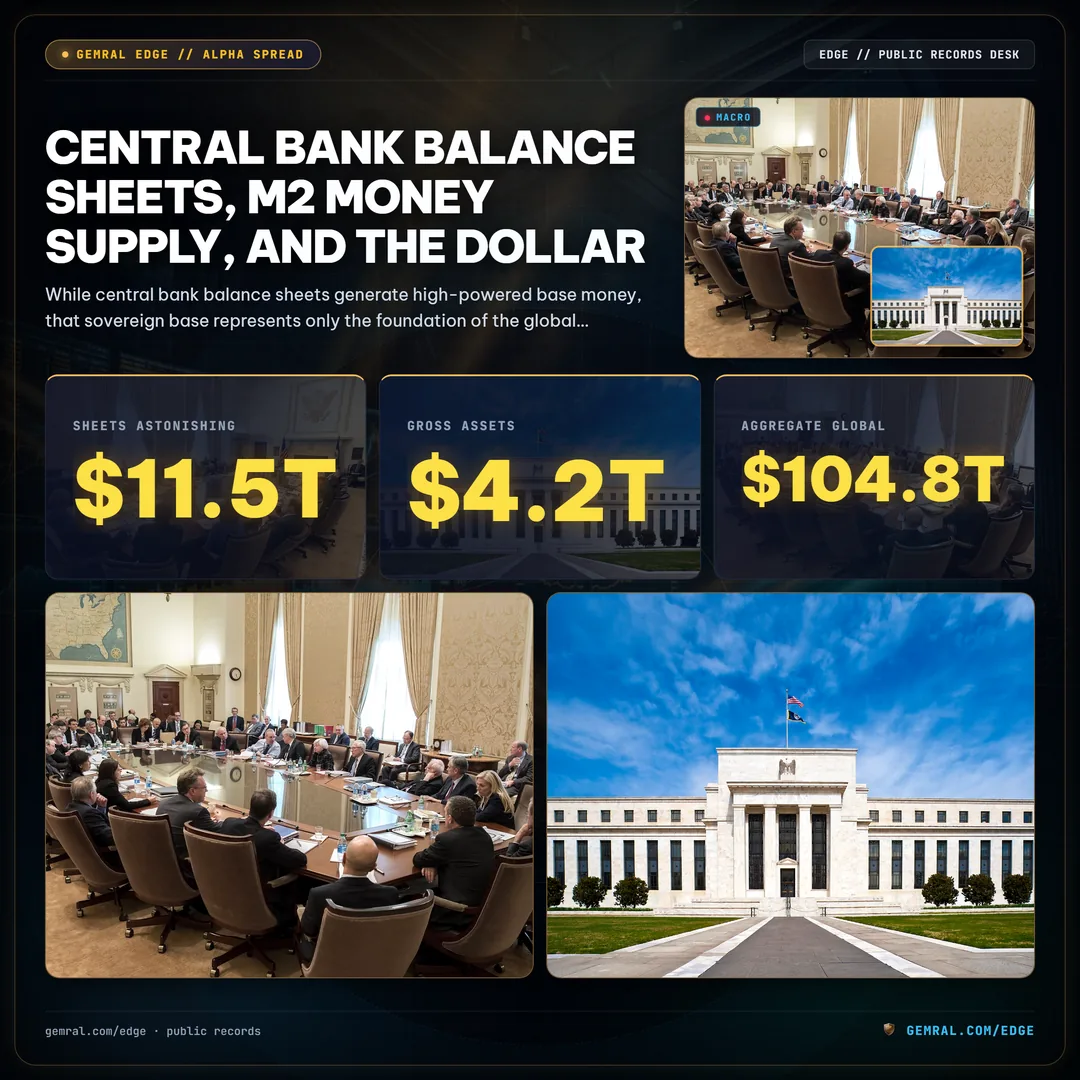
While central bank balance sheets generate high-powered base money, that sovereign base represents only the foundation of the global liquidity index. The true volume of purchasing power circulating in asset markets depends upon four interrelated monetary engines that amplify or throttle the transmission of capital.
Engine 1: Central Bank Balance Sheet Expansion and Contraction (Quantitative Easing vs Quantitative Tightening)
When central banks engage in open market asset purchases, they exchange freshly minted digital reserve balances for government bonds and mortgage-backed securities held by primary dealers. This mechanical transaction immediately expands the asset side of the central bank's ledger and injects equivalent liquidity into commercial clearing accounts. Between March 2020 and March 2022, the Big 4 central banks expanded their collective balance sheets by an astonishing $11.5 trillion, fueling the largest synchronized asset rally in human history. Conversely, the ensuing Quantitative Tightening (QT) cycle from June 2022 to mid-2026 drained over $4.2 trillion in gross assets, forcing risk assets into sustained valuation compression.
Engine 2: Broad Money (M2) Growth and Private Banking Credit Creation
Base money created by central banks remains inert unless commercial banks multiply it into broad money (M2) through lending and securities purchases. Across the OECD and major emerging markets, aggregate global M2 currently stands at $104.8 trillion. In the United States, commercial bank loans and leases total $12.45 trillion, while China's total social financing aggregate exceeds $54 trillion. When commercial banks expand their loan portfolios, private credit creation accelerates, driving corporate cash flow velocity and capital expenditure expansion.
Engine 3: The U.S. Dollar Index (DXY) as the Global Collateral Deflator
Because roughly 85% of foreign exchange transactions and more than 60% of international debt issuances are denominated in U.S. dollars, the value of the U.S. Dollar Index (DXY) acts as a worldwide financial conditions lever. A strengthening dollar (DXY rising above 104.5) dramatically tightens the global liquidity index by increasing the nominal debt-servicing burden on offshore dollar borrowers and triggering contractionary foreign exchange hedging requirements. Conversely, a softening dollar (DXY drifting toward 98.0) acts as a potent worldwide liquidity tailwind, loosening borrowing costs across emerging markets and expanding multi-currency balance sheet capacity.
Engine 4: Non-Bank Shadow Banking and Repo Collateral Velocity
In modern market architecture, repo markets and shadow banking conduits intermediate hundreds of billions in intraday liquidity. Using sovereign debt as collateral, hedge funds, primary dealers, and money market funds generate short-term leverage. When the velocity of sovereign collateral increases—meaning a single pristine 10-year Treasury note is rehypothecated multiple times across dealer financing desks—effective market liquidity multiplies without requiring a single dollar of new central bank base issuance.
Central bank balance sheet expansion does not guarantee instant market inflation if commercial banks hoard reserves or if a soaring dollar index strangles offshore borrowers. True liquidity expansion occurs only when sovereign base money expansion aligns with a weakening dollar and expanding commercial credit velocity.
Commercial Bank Reserve Dynamics and the Sovereign Collateral Multiplier
To comprehend how the global liquidity index impacts asset markets on a weekly basis, one must inspect the plumbing of commercial bank reserve balances held at primary central banks. In the United States, commercial bank reserves maintained at the Federal Reserve currently hover near $3.28 trillion, down from their historic peak of $4.25 trillion in late 2021.

Bank reserves are the apex asset of the domestic settlement system. Under post-2008 regulatory frameworks—including Dodd-Frank, the Basel III Liquidity Coverage Ratio (LCR), and the Net Stable Funding Ratio (NSFR)—tier-one commercial banks are required to maintain extensive buffers of High-Quality Liquid Assets (HQLA) to withstand severe 30-day liquidity runs. When the Federal Reserve's balance sheet runs off via QT at a cadence of $60 billion monthly ($25 billion in Treasuries and $35 billion in agency MBS), or when the Treasury Department accelerates sovereign debt issuance to replenish its TGA cash balances, commercial bank reserves absorb the blow.
Consider the collateral multiplier mechanism operating across primary dealer desks:
- Primacy of Collateral: Primary dealers rely on tri-party and bilateral repurchase agreements to finance their sovereign debt inventories. Daily Treasury repo transaction volumes routinely exceed $2.2 trillion.
- The SOFR-EFFR Spread: When bank reserves are abundant, the Secured Overnight Financing Rate (SOFR) trades comfortably below the Interest on Reserve Balances (IORB) rate of 4.90%. However, when sovereign bond issuances inundate the market and bank reserves contract toward the "Lowest Comfortable Level of Reserves" (LCLoR, estimated by the Fed at $3.0 trillion to $3.1 trillion), repo rates spike violently, forcing dealer desks to de-gross risk assets.
- The Standing Repo Facility Safety Valve: To prevent a recurrence of the catastrophic September 2019 repo freeze, the Federal Reserve established the Standing Repo Facility (SRF), as audited in our report on Standing Repo Facility Liquidity Stress. By allowing primary dealers and depository institutions to swap Treasuries for cash at the top of the fed funds target range, the SRF puts a hard ceiling on funding rates, yet activation of the facility serves as an explicit warning that collateral plumbing has reached critical stress.
- Cross-Border Reserve Spillover: When U.S. bank reserves contract, global commercial banks operating branches in New York must bid aggressively for overnight funds, transmitting domestic liquidity tightness directly into European and Asian interbank funding markets.
Global Liquidity Index vs Bitcoin and Equities: Correlation Dynamics and Asset Spillover
The empirical relationship between the global liquidity index and major asset classes reveals one of the most reliable and consistent predictive patterns in modern quantitative finance. Rather than responding to corporate earnings growth or traditional valuation multiples like price-to-earnings, macro risk assets act as hyper-sensitive seismographs registering changes in the global money supply.

Among all investable asset classes, Bitcoin (BTC) exhibits the highest pure beta and cleanest statistical correlation to the global liquidity index. Because Bitcoin possesses a fixed programmatic supply cap of 21,000,000 coins and carries zero counterparty liability, industrial utility, or corporate balance sheet debt, its exchange price functions as a pure, unencumbered thermometer of fiat currency debasement and liquidity expansion.
| Asset Class / Benchmark | Historical Correlation (R) to GLI | Empirical Lead / Lag Transmission Time | Beta Sensitivity to 10% GLI Surge | Dominant Liquidity Transmission Vector |
|---|---|---|---|---|
| Bitcoin (BTC) | 0.83 (Directional alignment) | 8 to 12 Weeks (Leading indicator) | +38.5% to +52.0% | Pure monetary debasement reflection & crypto fiat on-ramps |
| NASDAQ 100 (QQQ) | 0.76 (High structural fit) | 4 to 6 Weeks (Intermediate lag) | +14.2% to +18.5% | Discount rate compression & duration equity valuation surge |
| S&P 500 (SPY) | 0.71 (Broad market transmission) | 6 to 8 Weeks (Standard economic lag) | +9.5% to +12.0% | Corporate credit availability & earnings multiple expansion |
| Gold (XAU/USD) | 0.68 (Monetary hedge) | Coincident to 4 Weeks (Immediate) | +8.0% to +11.5% | Real yield suppression & central bank sovereign reserve shifts |
| High-Yield Credit Spreads (HYG) | -0.79 (Inverted spread behavior) | 2 to 4 Weeks (Rapid transmission) | -65 to -95 bps (Spread tightening) | Corporate refinancing ease & default risk suppression |
Quantitative analysis spanning 2012 through 2026 demonstrates that shifts in the rate of change (YoY momentum) of the global liquidity index lead Bitcoin price movements by approximately 8 to 12 weeks. When global liquidity bottomed in October 2022 at $158 trillion and began its multi-year expansion toward $171.4 trillion in late 2026, Bitcoin bottomed at $15,500 and surged toward historic highs of $73,700 and beyond, tracking the liquidity wave with astonishing fidelity.
Similarly, the tech-heavy Nasdaq 100 exhibits an empirical elasticity of 1.4x to 1.8x relative to liquidity expansions. When central banks inject liquidity, risk-free discount rates decline and institutional allocators are forced out on the risk curve, bidding up long-duration technology equities that promise cash flows far in the future. As explored in our market report on BTC Liquidation and Squeeze Dynamics, structural leverage unwinds in crypto derivatives frequently coincide with localized contractions in the underlying fiat liquidity stream.
The Offshore Dollar System and Cross-Currency Basis Swaps: Shadow Banking Plumbing
A fatal error committed by retail macro commentators is confining their analysis to the domestic borders of the United States. In reality, the true engine of international trade and leverage operates offshore: the Eurodollar market. Spanning London, Zurich, Tokyo, Singapore, and the Cayman Islands, the offshore shadow banking system creates and circulates dollar-denominated liabilities completely outside the regulatory jurisdiction of the Federal Reserve.
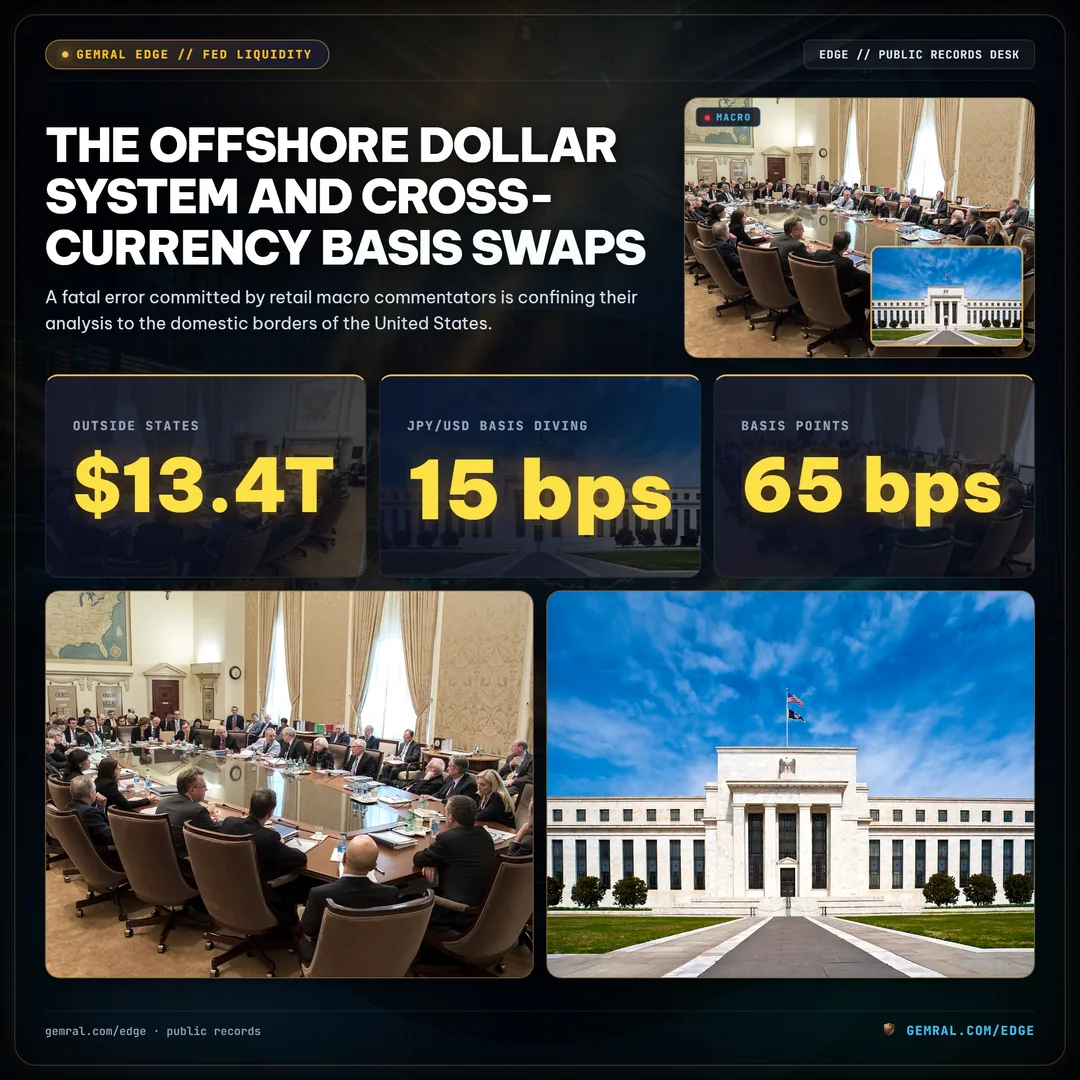
According to the Bank for International Settlements (BIS), offshore dollar debt owed by non-bank borrowers outside the United States exceeds $13.4 trillion, supplemented by more than $85 trillion in foreign exchange swaps and forward contracts. This monumental debt structure requires an uninterrupted stream of daily dollar clearing liquidity to roll over maturing obligations.
The health of this offshore funding conduit is measured directly by the Cross-Currency Basis Swap Spread:
- Covered Interest Parity (CIP) Failure: In theoretical textbook economics, covered interest parity dictates that interest rate differentials between two currencies should exactly match the forward exchange rate spread. However, since the 2008 financial crisis, cross-currency basis swap spreads have traded persistently negative, reflecting an institutional premium demanded by global banks to lend U.S. dollars against foreign currency collateral.
- The EUR/USD and JPY/USD Basis Swaps: When dollar funding becomes constrained, the cross-currency basis spread widens negatively (for instance, the 3-month JPY/USD basis diving from -15 basis points to -65 basis points). This price action indicates that foreign financial institutions are willing to pay steep premium penalties simply to secure overnight and term dollar liquidity.
- The Central Bank Liquidity Swap Network: To alleviate offshore funding freezes, the Federal Reserve maintains permanent bilateral standing swap lines with five key foreign central banks: the Bank of Canada, Bank of England, Bank of Japan, European Central Bank, and Swiss National Bank. By providing dollars to foreign central banks in exchange for local currency collateral, the Fed serves as the ultimate international lender of last resort, expanding the global liquidity index during acute cross-border credit panics.
- Transmission to Domestic Liquidity: When offshore dollar funding strains intensify, global financial institutions dump marketable U.S. Treasury securities and repatriate domestic capital, triggering sudden liquidity drains inside the United States financial clearing architecture.
Forecasting the Liquidity Wave: 65-Month Debt Refinancing Cycles and Portfolio Positioning
One of the most profound discoveries in quantitative macroeconomics is the existence of an overarching 65-month structural debt refinancing cycle that dictates the long-term rhythm of the global liquidity index. Pioneered through empirical audits of sovereign debt maturity schedules, this 5-to-6 year harmonic cycle reflects the natural lifecycle of corporate debt issuances, sovereign treasury refundings, and central bank monetary policy oscillations.
The structural drivers of the 65-month cycle are anchored in physical financial commitments:
- Average Corporate Debt Duration: The median maturity of corporate debt issued across OECD nations averages 5.2 to 5.8 years. Following a major credit expansion, corporate treasurers must return to credit markets to refinance maturing notes, demanding an expansion in system-wide liquidity.
- Sovereign Debt Roll Schedules: The United States Treasury maintains an average debt maturity profile of approximately 72 months across its $35 trillion sovereign debt stock. Concentrated debt issuance clusters require synchronized central bank accommodative windows to prevent auction tail failures.
- The Cycle Phases:
- Phase 1: Liquidity Contraction / Bottoming (Months 0 to 12): Central banks fight late-cycle inflation by raising policy rates and shrinking balance sheets. Corporate earnings compress, default rates rise, and speculative assets suffer severe drawdowns. The cycle bottoms as interbank funding stress forces a policy pivot.
- Phase 2: Early Recovery / Injection (Months 13 to 30): Coordinated central bank easing programs, rate cuts, and reserve injections reignite base money growth. High-beta assets (Bitcoin, growth tech) stage accelerated front-running rallies.
- Phase 3: Broad Expansion / Multiple Boom (Months 31 to 48): Commercial bank credit creation accelerates, M2 surges across major nations, and equity benchmarks advance to historic peaks supported by expanding liquidity multiples.
- Phase 4: Late-Cycle Inflation / Tightening (Months 49 to 65): Real resource constraints, wage pressures, and commodity price spikes compel central banks to withdraw accommodation, concluding the cycle and initiating the next contractionary phase.
Empirical data tracking the global liquidity index confirms that the global credit cycle entered Phase 2 in late 2024 and is currently progressing through early Phase 3. With global central banks orchestrating synchronized rate-easing cycles and the People's Bank of China unleashing major credit stimulus packages, the 65-month liquidity wave is projected to expand toward mid-2027, establishing a sustained multi-year tailwind for global equities and digital assets.
Institutional Regimes: Identifying Liquidity Inflection Traps Before Price Collapses
While the long-term trend of the global liquidity index provides strategic macroeconomic orientation, institutional risk managers must navigate short-term localized liquidity traps. Market crashes and sudden 20% drawdowns rarely occur during tranquil periods; they strike when market participants confuse nominal equity price momentum with underlying liquidity health.

To detect liquidity inflection traps before asset prices collapse, institutional desks monitor four quantitative warning signals:
- Divergence Between Equity Prices and Net Liquidity: When the S&P 500 or Nasdaq prints new all-time highs while the global liquidity index or Fed Net Liquidity rolls over and contracts for more than 4 consecutive weeks, a dangerous liquidity divergence trap is triggered. Historical precedent (such as the fourth quarter of 2021 and early 2020) indicates that price eventually capitulates to match the underlying liquidity trajectory.
- Treasury General Account Replenishment Siphons: As the U.S. Treasury Department refills its TGA balance following debt ceiling suspensions or heavy quarterly refunding announcements, tens of billions in cash are pulled from commercial bank clearing accounts into the government vault. If the Overnight Reverse Repo facility cannot buffer the outflow, commercial bank reserves plummet, sparking localized liquidity shocks.
- Surges in Primary Dealer Inventories: When primary dealer holdings of coupon Treasuries swell beyond absorption limits and auction bid-to-cover ratios deteriorate, dealers are forced to reduce balance sheet allocations to corporate debt and equities, causing broad market breadth to collapse.
- Cross-Currency Swap Dislocations: A sudden negative blowout in EUR/USD or JPY/USD cross-currency basis spreads signals acute offshore dollar shortages. These shortages invariably prompt global financial institutions to liquidate their most liquid domestic holdings—frequently mega-cap tech stocks and cryptocurrencies—to raise urgent dollar settlement cash.
By integrating real-time telemetry from the global liquidity index into systematic trading models, allocators insulate portfolios against catastrophic tail-risk events while capturing the full wealth-generation velocity of the $170 trillion sovereign money wave.
Global Liquidity Transmission Dataset: https://gemral.com/edge/s/macro-global-liquidity-index-tracker
Frequently asked questions
What is the Global Liquidity Index?
The Global Liquidity Index is a macroeconomic aggregate benchmark that quantifies the total volume of central bank reserves, commercial bank broad money (M2), cross-border credit, and short-term financing available across the world's major economies. It tracks how monetary policy adjustments and sovereign balance sheet operations transmit into real asset prices.
How is the Global Liquidity Index calculated?
The Global Liquidity Index aggregates the balance sheet assets of the world's dominant central banks—principally the Federal Reserve, European Central Bank, People's Bank of China, and Bank of Japan—adjusted downward for sterile government cash balances (such as the US Treasury General Account) and reverse repo facilities, normalized by global M2 broad money supply and trade-weighted spot foreign exchange rates.
How does the Global Liquidity Index correlate with Bitcoin and equities?
Global liquidity exhibits an exceptionally high historical correlation with risk assets: Bitcoin demonstrates an 83% directional correlation to global liquidity expansion on an 8-to-12 week lead time, while global equities like the S&P 500 and Nasdaq typically track liquidity trends with a 4-to-8 week lag.
Why does the U.S. Dollar Index (DXY) impact global liquidity?
Because approximately 85% of international currency transactions and over $13.4 trillion in foreign corporate debt are denominated in U.S. dollars, a surging dollar index increases offshore debt-servicing burdens and forces cross-border banks to shrink lending, contracting the global liquidity pool. Conversely, a softening dollar acts as an immediate worldwide liquidity catalyst.