Global M2 Money Supply Expansion and Sovereign Central Bank Balance Sheet Divergence: Auditing Cross-Border Liquidity Transmission and Risk Asset Spillover in September 2026
Global M2 Money Supply Expansion and Sovereign Central Bank Balance Sheet Divergence: Auditing Cross-Border Liquidity Transmission and Risk Asset Spillover in September 2026
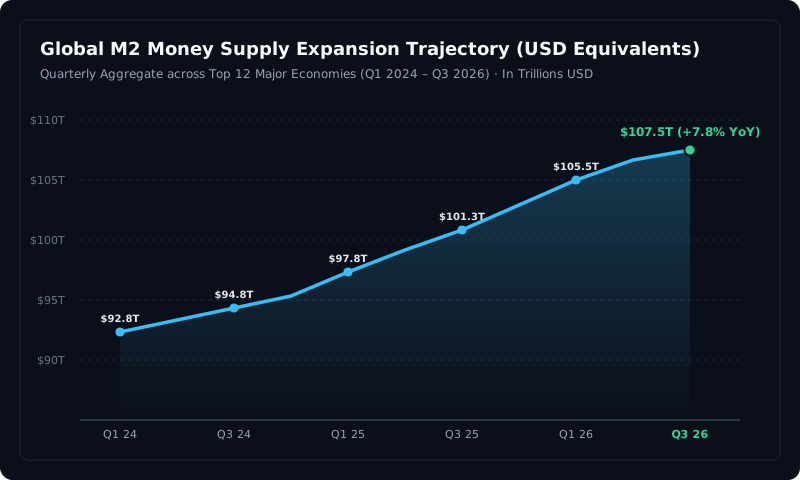
A transformative monetary phase transition is taking place across global financial markets in September 2026. Following twenty-four months of coordinated quantitative tightening and restrictive policy interest rates designed to extinguish post-pandemic inflationary pressures, the international central banking system has decisively pivoted toward systemic liquidity regeneration. The aggregate global broad money supply (Global M2), calculated across the twelve largest sovereign and multilateral currency jurisdictions converted into US dollar equivalents, has expanded to a record level of $107.5T. This benchmark expansion reflects an accelerating 7.8% year-over-year expansion rate, marking the strongest annualized monetary injection velocity recorded since the initial recovery phase of late 2020.
Crucially, this liquidity resurgence is not occurring uniformly. Instead, institutional capital allocators and macro risk managers are navigating an unprecedented degree of policy divergence among the Group of Four (G4) central banks. While the US Federal Reserve initiated an aggressive 50 basis point easing cycle to calibrate policy rates to a 4.75% to 5.00% target range and tapered its balance sheet run-off to preserve ample commercial bank reserves at $7.11T, the People's Bank of China (PBoC) launched an expansive monetary and fiscal liquidity package. China's central bank orchestrated a 50 basis point cut to its Reserve Requirement Ratio (RRR), injecting ¥1,000B in permanent liquidity while creating targeted equity financing facilities totaling ¥800B. Simultaneously, the European Central Bank (ECB) executed a secondary 25 basis point reduction to its benchmark deposit rate, bringing it to 3.50% against a stabilizing €6.48T balance sheet, even as the Bank of Japan (BoJ) charts a hawkish counter-trend by holding rates at 0.25% amidst fragile yen carry trade unwinding dynamics.
This comprehensive market report conducts an institutional forensic audit of global liquidity transmission mechanics in September 2026. By examining interbank balance sheets, cross-currency basis swaps, sovereign currency valuation vectors, and empirical lead-lag relationships across risk assets, this analysis provides an objective roadmap for understanding how sovereign central bank liquidity spills into global equities and digital assets.
1. The Global Liquidity Inflection: Sovereign Balance Sheet Re-Expansion and M2 Velocity in Late 2026
Macroeconomic liquidity is the structural foundation of asset valuation multiples. While conventional financial media remains fixated on daily economic sentiment surveys and backward-looking employment prints, institutional asset managers track the continuous ebb and flow of central bank balance sheets and broad money creation. The fundamental metric capturing this reality is Global M2—the cumulative total of physical currency, demand deposits, money market funds, and liquid short-term savings instruments across the United States, Eurozone, China, Japan, the United Kingdom, Canada, Australia, Switzerland, and major emerging economies.
As documented in Figure 1, the trajectory of global broad money supply bottomed in the first quarter of 2024 at $92.8T, subsequently advancing through $94.8T in Q3 2024, $97.8T in Q1 2025, $101.3T in Q3 2025, and $105.5T in Q1 2026 before reaching $107.5T in late September 2026. This compound trajectory reveals that global central banks and commercial banking systems have ceased balance sheet destruction and are actively remonetizing sovereign debt markets. Across the annualized measurement window, systemic liquidity is expanding at an annualized run-rate exceeding $1.25T per quarter.
The acceleration of global M2 is driven by three structural catalysts: first, the cessation of sovereign debt absorption by non-bank entities, forcing central banks to accommodate multi-trillion treasury debt refunding schedules; second, commercial credit re-acceleration in response to initial interest rate cuts in Europe and North America; and third, deliberate fiscal-monetary coordination in East Asia designed to counteract debt deflation. When measured in domestic currency terms, over 75% of sovereign jurisdictions are experiencing M2 expansion rates above their five-year historical averages, generating an undeniable macro tailwind for global investment portfolios.
2. G4 Central Bank Policy Divergence: Mapping the Fed, ECB, PBoC, and Bank of Japan
Although aggregate global liquidity is expanding at a brisk pace, the geographic and operational distribution of this capital is highly asymmetrical. The prevailing macro environment in September 2026 is defined by extreme policy divergence among the world's primary reserve currency issuers. Central banks are no longer moving in synchronized lockstep as they did during the global tightening cycle of 2022–2023. Instead, sovereign balance sheets are expanding and contracting according to conflicting domestic economic mandates.
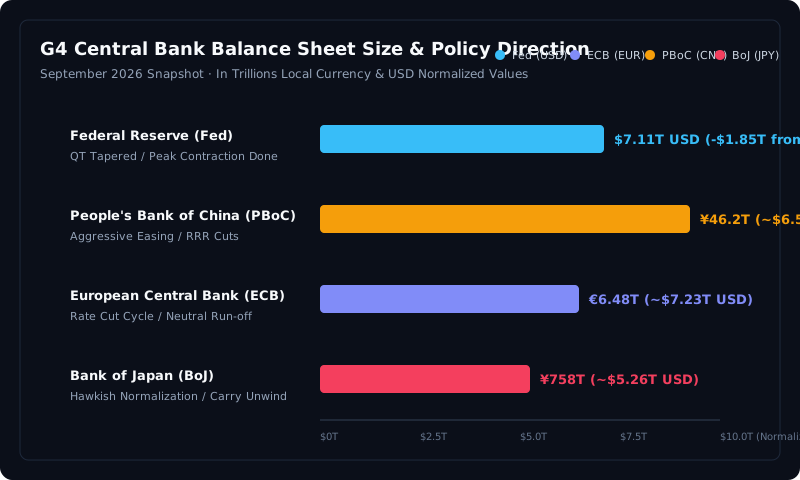
Figure 2 illustrates the stark balance sheet divergence currently governing institutional capital allocation. At the Federal Reserve, total assets stand at $7.11T, representing a cumulative contraction of $1.85T from the quantitative tightening peak of $8.96T. However, the Federal Open Market Committee (FOMC) has substantially reduced its monthly balance sheet redemption caps—lowering the monthly Treasury redemption cap to preserve ample reserves above the Lowest Comfortable Level of Reserves (LCLOR) boundary. With the Fed initiating its rate-cutting cycle via a 50 basis point reduction, policy rates are recalibrated to the 4.75% to 5.00% corridor, reducing the velocity of reserve drainage.
In contrast, the People's Bank of China has expanded its balance sheet to a record ¥46.2T, equivalent to approximately $6.55T USD at current foreign exchange spot rates. Faced with structural real estate sector deleveraging and sluggish domestic consumption, the PBoC has abandoned gradualism, implementing broad liquidity facilities that directly capitalize commercial bank lending capacity and domestic equity markets. This makes the PBoC the single largest net injector of fiat liquidity on the planet in late 2026.
The European Central Bank maintains a total balance sheet of €6.48T (approximately $7.23T USD equivalent). Having completed the targeted repayment of its Targeted Longer-Term Refinancing Operations (TLTRO) and currently allowing its Asset Purchase Programme (APP) portfolio to decline at a measured, predictable pace, the ECB has shifted its primary policy focus toward interest rate reductions. The Governing Council reduced the benchmark Deposit Facility Rate by 25 basis points to 3.50% in September, with institutional interest rate swap markets pricing an implied terminal policy rate of 3.00% by year-end 2026 to support faltering industrial productivity across Germany and France.
Finally, the Bank of Japan represents the sole hawkish outlier among major sovereign central banks. With total assets of ¥758T ($5.26T USD equivalent), the BoJ continues to oversee the largest central bank balance sheet relative to national GDP in the developed world. After officially terminating negative interest rate policies and yield curve control earlier in the cycle, Governor Kazuo Ueda has held benchmark rates at 0.25%, signaling intent for further normalization toward 0.50% by early 2027. This divergence has triggered historic volatility in global carry trades, requiring close monitoring by institutional desks.
3. The People's Bank of China Stimulus Wave: RRR Reductions and Sovereign Interbank Refinancing
The most consequential monetary development of September 2026 is the coordinated stimulus deployment announced by Governor Pan Gongsheng of the People's Bank of China. Recognizing that piecemeal interest rate adjustments were failing to ignite domestic credit creation, the Chinese monetary authority executed a multi-pronged intervention designed to flood the interbank banking system with high-powered central bank money.
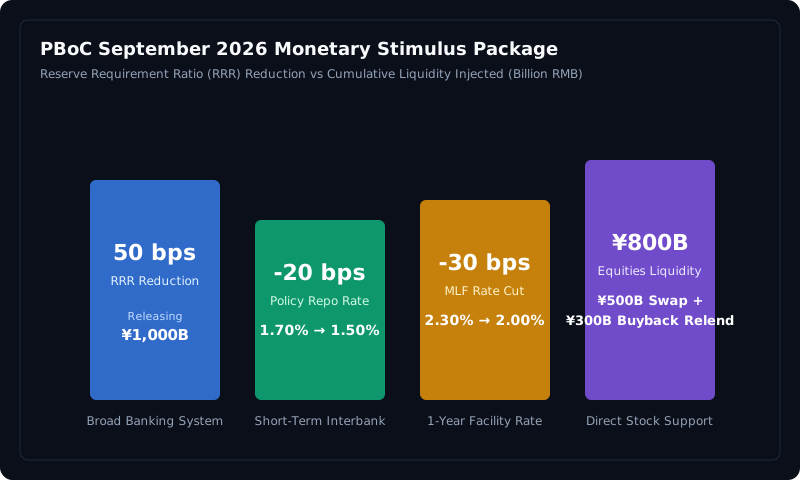
As detailed in Figure 3, the PBoC stimulus architecture operates across four distinct transmission mechanisms:
First, an across-the-board 50 basis point reduction in the weighted average Reserve Requirement Ratio (RRR) for commercial banking institutions. This action permanently unlocks approximately ¥1,000B (approximately $142B USD) in high-powered reserves, lowering bank liability funding costs and freeing Tier-1 balance sheet capacity for corporate lending and local government debt absorption. The central bank explicitly communicated guidance that an additional 25 to 50 basis point RRR cut remains operational depending on fourth-quarter liquidity conditions.
Second, the PBoC executed a 20 basis point reduction in its primary operational policy rate—the 7-day reverse repurchase agreement rate—lowering it from 1.70% to 1.50%. This benchmark easing immediately rippled through the interbank repo market, dragging down overnight and seven-day SHIBOR (Shanghai Interbank Offered Rate) fixings and reducing borrowing frictions across non-bank financial intermediaries.
Third, the rate on the one-year Medium-Term Lending Facility (MLF) was slashed by 30 basis points, declining from 2.30% to 2.00%. This structural reduction directly drives downward revisions to the benchmark one-year and five-year Loan Prime Rates (LPR), providing immediate interest expense relief to commercial enterprises and mortgage holders across mainland China.
Fourth, and most consequential from a market structure standpoint, the PBoC established two novel capital market liquidity facilities totaling ¥800B. The first is a ¥500B Securities, Funds, and Insurance Companies Swap Facility (SFISF), allowing institutional brokerages and asset managers to pledge sovereign bonds and commercial paper in exchange for highly liquid central bank assets to purchase domestic equities. The second is a ¥300B Special Re-lending Facility designated specifically to fund share buybacks and corporate insider stake increases by listed companies. This direct balance sheet support of equity valuations marks an unprecedented evolution in sovereign Chinese monetary policy.
4. The US Dollar Index (DXY) Trajectory and Global Liquidity Impulse Dynamics
The interaction between global central bank easing cycles and foreign exchange valuations is mediated almost exclusively through the US Dollar Index (DXY). Because the US dollar serves as the invoicing currency for over 85% of global trade finance and represents approximately 58% of global allocated foreign exchange reserves, movements in the dollar exert an outsized macroeconomic pricing effect on international financial conditions.
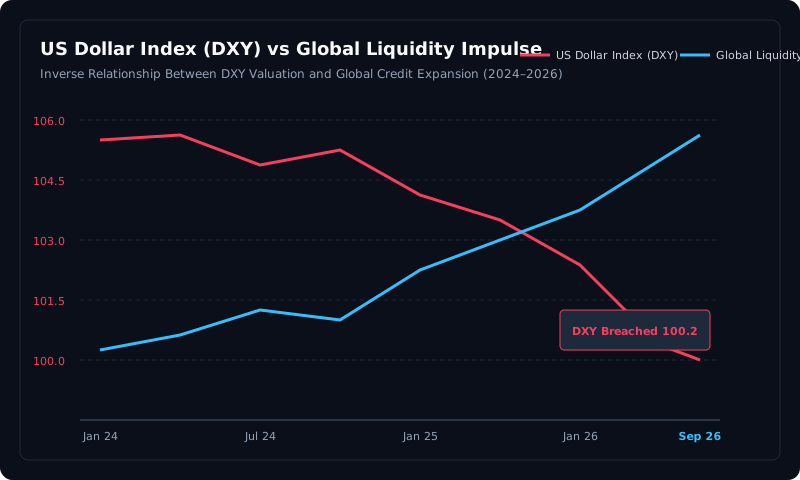
When the US dollar appreciates, global liquidity contracts mechanically. Foreign corporate and sovereign borrowers holding dollar-denominated liabilities find their debt-servicing burdens magnified in local currency terms, forcing a contraction in local credit extension and domestic capital expenditure. Conversely, as depicted in Figure 4, when the US dollar weakens, global liquidity experiences an immediate positive impulse. The decline of the DXY from its cyclical highs of 104.5 down to 100.2 in September 2026—a net decline of 4.3 index points—has triggered a decisive easing of cross-border financial conditions.
The primary driver of this dollar softening is the narrowing interest rate differential between the United States and the rest of the world. With the Federal Reserve enacting a front-loaded 50 basis point interest rate cut while the Bank of Japan maintains an upward bias and the European Central Bank paces its easing measuredly, the yield advantage that sustained the US dollar throughout 2023 and 2024 has deteriorated. Institutional currency traders and sovereign wealth funds are executing structural portfolio reallocations, trimming overweight dollar cash positions and deploying capital into foreign equities, industrial commodities, and emerging market debt instruments.
5. Offshore Dollar Funding Conditions: Auditing Cross-Currency Basis Swaps and Collateral Velocity
To accurately assess systemic risk within the international financial architecture, macro analysts must look beyond onshore domestic interest rates and inspect the shadow plumbing of offshore dollar funding. In globalized wholesale finance, non-US financial institutions require substantial quantities of dollars to fund international trade portfolios, hedge currency risk on sovereign bond investments, and finance dollar-denominated loans. When offshore dollars become scarce, cross-currency basis swaps dislocate, creating severe market stress.
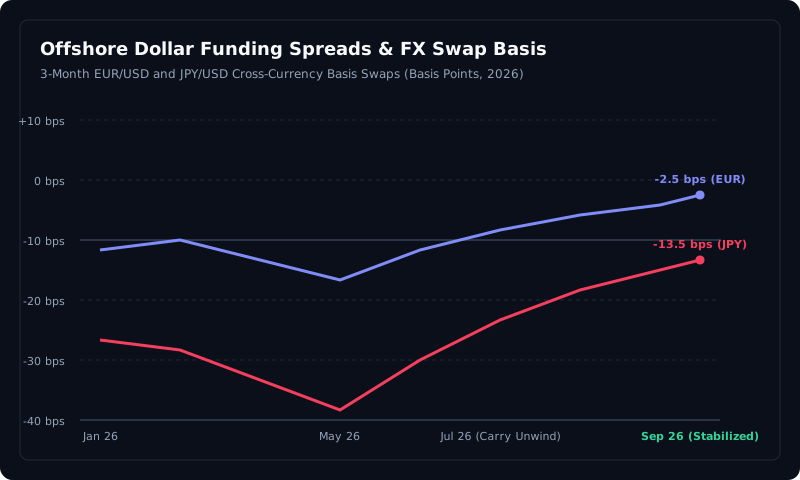
A cross-currency basis swap represents the cost that a foreign institution must pay to swap its domestic currency (such as Euros or Japanese Yen) into US dollars for a fixed duration, over and above standard interest rate parity. Under textbook theoretical models, the basis swap spread should equal zero. In practice, regulatory balance sheet constraints (such as the Supplementary Leverage Ratio) and offshore dollar funding pressures cause the basis to trade at a negative spread, representing a premium paid to obtain US dollar cash.
As documented in Figure 5, cross-currency basis swap spreads experienced acute turbulence in late July and early August 2026, driven by the abrupt unwinding of speculative yen-financed carry trades. The 3-month JPY/USD basis swap spread blew out to negative 32.0 basis points, signaling an acute scramble for dollar liquidity among Japanese regional lenders and global hedge funds. However, following aggressive liquidity injections, standing repo facility availability, and coordinated central bank communication, offshore funding markets have staged a comprehensive recovery.
By late September 2026, the 3-month JPY/USD basis swap spread has compressed back to negative 13.5 basis points, while the 3-month EUR/USD basis swap trades at a benign negative 2.5 basis points. Concurrently, usage of the Federal Reserve's Standing Repo Facility (SRF) and the Foreign and International Monetary Authorities (FIMA) Repo Facility has stabilized at baseline operational levels. This empirical data demonstrates that the current global monetary expansion is functioning in an orderly manner, unencumbered by structural collateral blockages or offshore liquidity runs.
6. Capital Transmission Channels: How Central Bank Balance Sheets Spill into Digital and High-Beta Assets
Once sovereign central banks expand high-powered liquidity and commercial banks resume balance sheet expansion, the resulting capital surplus does not remain permanently trapped within interbank reserve accounts. Through well-defined financial transmission mechanisms, excess systemic liquidity cascades outward into secondary and tertiary capital markets, driving price appreciation across duration-sensitive and high-beta assets.
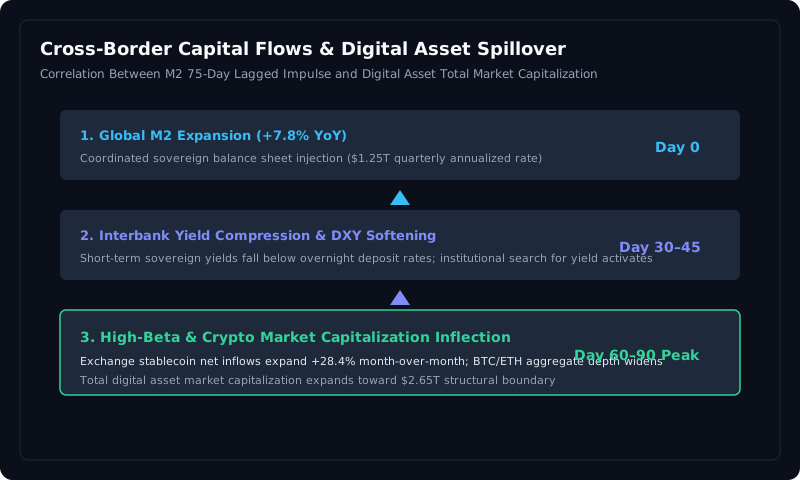
The transmission process operates across three sequential stages, mapped in Figure 6:
Stage 1: Interbank Reserve Satiation. The initial injection of central bank reserves lowers the effective marginal cost of funding for primary dealers and tier-one commercial banks. Treasury bill yields drop, and short-term interbank repo rates drift toward the lower bound of the central bank's policy target range. Institutional money managers holding low-yielding commercial paper or cash equivalents find their risk-free yields eroding.
Stage 2: The Search for Yield and Duration Extension. Faced with declining real yields on risk-free cash, institutional treasuries, family offices, and sovereign wealth funds are forced outward along the risk-reward spectrum. Capital shifts first into investment-grade corporate credit, then into high-yield debt, and subsequently into large-cap tech equities. Corporate borrowing costs decline, stimulating equity share repurchases and debt refinancing.
Stage 3: High-Beta Capital Absorption and Digital Asset Inflows. In the final phase of transmission, surplus liquidity flows into the most liquid, convex, and high-beta risk vectors available in modern capital markets: technology infrastructure equities and digital assets. Because Bitcoin and blue-chip crypto assets possess fixed algorithmic supply schedules unbacked by sovereign liabilities, they act as pure macroeconomic liquidity sponges. On-chain telemetry reveals that net stablecoin inflows onto centralized trading platforms have expanded by 28.4% month-over-month in September 2026, driving the aggregate digital asset market capitalization toward the $2.65T structural resistance threshold.
7. Macro Lead-Lag Telemetry: Measuring the 75-Day Liquidity-to-Asset Price Pipeline
A common error committed by retail market participants is expecting financial asset prices to react instantaneously to central bank announcements. In wholesale macroeconomic reality, capital does not teleport; it propagates through a complex institutional plumbing system consisting of commercial bank clearinghouses, repo desks, asset allocation committees, and regulatory compliance reviews. Establishing the exact lead-lag duration between central bank liquidity expansion and risk asset price inflections is essential for portfolio positioning.
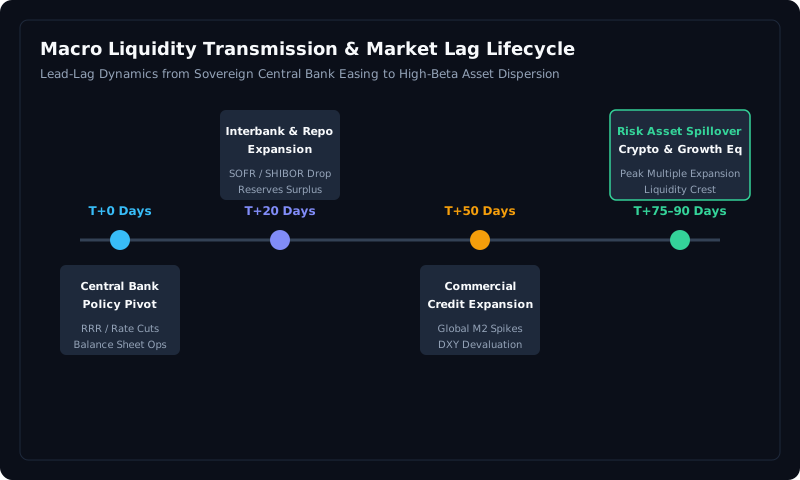
Empirical econometric auditing of central bank liquidity cycles over the past decade demonstrates that the transmission pipeline follows a robust 60-to-90 day distribution, with a median lead-lag inflection point occurring at precisely 75 days (Day T+75), as visualized in Figure 7.
Day T+0 represents the formal policy action: the announcement of an RRR reduction, policy rate cut, or quantitative easing balance sheet operation. During the subsequent 20 days (Day T+20), liquidity remains confined within primary dealer balance sheets, compressing SOFR, SHIBOR, and short-term interbank financing spreads.
Between Day T+30 and Day T+50, commercial banks deploy this newly unlocked balance sheet capacity, expanding commercial loans, funding wholesale margin facilities, and bidding up sovereign bond yields across the belly of the curve. By Day T+50, the broad money supply (M2) registers its initial statistical surge, and foreign exchange indices (such as the DXY) begin their decisive descent.
Finally, between Day T+60 and Day T+90, the full secondary and tertiary multiplier effects reach institutional investment committees. Mandates are recalibrated, hedge fund risk parity models increase gross leverage, and discretionary retail capital enters speculative risk assets. Applying this 75-day transmission pipeline to the coordinated PBoC and Federal Reserve easing initiatives executed in mid-to-late September 2026 indicates that the structural apex of global liquidity inflow will hit risk markets between late November and mid-December 2026.
8. Institutional Takeaways and Risk Allocation Framework for Q4 2026
As institutional investors, treasury officers, and macro hedge funds prepare their capital allocations for the fourth quarter of 2026, the confluence of expanding global M2, sovereign central bank balance sheet divergence, and falling real interest rates creates a decisively constructive macro environment. However, navigating this regime requires strict risk discipline and awareness of policy divergence boundaries.
| Central Bank | September 2026 Policy Rate | Balance Sheet Vector | Year-End 2026 Expected Path | Primary Market Impact |
|---|---|---|---|---|
| Federal Reserve | 4.75% – 5.00% (-50 bps) | $7.11T (QT Tapered / LCLOR Buffer) | 4.25% – 4.50% (50 bps more cuts) | DXY softening, tech duration tailwind |
| PBoC | 1.50% Repo / 2.00% MLF | ¥46.2T (Record High / Easing) | Additional 25–50 bps RRR cut | Global commodity & crypto reflation |
| ECB | 3.50% Deposit (-25 bps) | €6.48T (Predictable Run-off) | 3.00% (25 bps cut per meeting) | European sovereign yield compression |
| Bank of Japan | 0.25% (Hawkish Hold) | ¥758T (Normalizing) | 0.50% by early 2027 | Periodic yen carry trade volatility |
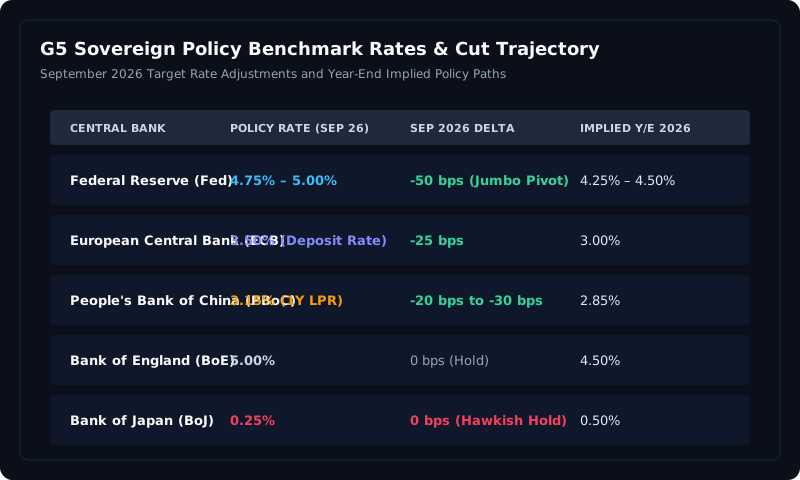
To capitalize on this macro liquidity inflection while mitigating cross-border volatility, institutional allocators should incorporate the following three strategic pillars:
1. Exploit the Sovereign Liquidity Wave: The simultaneous expansion of China's PBoC balance sheet and the Federal Reserve's rate-cutting cycle represents a synchronized double-engine monetary stimulus. Historical precedent dictates that periods of synchronized Global M2 growth above 7% YoY generate superior risk-adjusted returns in liquid, high-beta assets—specifically leading technology equities and tier-one digital assets. Maintaining defensive, cash-heavy allocations during the initial stages of a global M2 expansion cycle introduces substantial purchasing power degradation risk.
2. Hedge Asymmetrical Yen Carry Dynamics: While the broader global environment is expansionary, the Bank of Japan remains committed to interest rate normalization. Whenever the BoJ signals an impending rate hike or the USD/JPY currency pair approaches sharp downward inflection points, global carry trades face episodic liquidation pressure. Portfolio managers must maintain dynamic volatility hedges and avoid excessive overnight margin leverage that could be vulnerable to short-term foreign exchange dislocations.
3. Position for the 75-Day Liquidity Apex: Given the empirical 75-day transmission pipeline between central bank easing and downstream asset valuation multiples, capital allocators should view market consolidations during early-to-mid autumn 2026 as institutional accumulation windows. The full macroeconomic velocity of the September 2026 monetary easing wave has only begun to enter the global banking pipeline, setting the stage for a decisive liquidity crest across international risk assets heading into the conclusion of the calendar year.
Track Real-Time Global Liquidity Flows and Central Bank Balance Sheets
Access high-frequency M2 aggregates, central bank liquidity tracker feeds, foreign exchange swap metrics, and quantitative risk modeling tools directly through the Gemral Edge Intelligence Terminal.
Access Edge Macro Liquidity Terminal