Federal Reserve Net Liquidity Transmission and Commercial Bank Reserve Drain Dynamics in September 2026
Macro Liquidity & Capital FlowsFederal Reserve Net Liquidity Transmission and Commercial Bank Reserve Drain Dynamics in September 2026
The contemporary financial architecture operates on a baseline reality that market commentary routinely obscures: asset prices do not trade against static macroeconomic projections or narrative consensus, but against the fluid volume of deployable dollar liquidity circulating within the core commercial banking perimeter. Over the course of September 2026, a convergence of scheduled calendar anomalies, fiscal cash extractions, and the relentless continuation of balance sheet normalization has triggered a measurable contraction across domestic liquidity channels. While headline financial media focused nearly exclusively on the Federal Open Market Committee decision to cut the federal funds target range by 50 basis points to 4.75%–5.00%, the structural pipes governing money market financing experienced an inverse, tightening dynamic.
This comprehensive market report conducts an institutional-grade deconstruction of the Federal Reserve Consolidated Financial Statement (Release H.4.1), the Daily Treasury Statement published by the Bureau of the Fiscal Service, and primary dealer financing records. Track live telemetry and quantitative liquidity spreads through the Gemral Edge Macro Liquidity Intelligence Terminal. By examining the mathematical mechanics of the Federal Reserve Net Liquidity equation, this analysis isolates how the combination of the September corporate tax collection deadline, persistent quantitative tightening runoff, and the terminal depletion of the Overnight Reverse Repo facility has pushed domestic commercial bank reserves toward their structural operating threshold. The downstream consequences are already propagating across short-term secured financing spreads, sovereign debt underwriting capacity, and broader risk asset pricing models.
1. Executive Summary: The Structural Mechanics of the September 2026 Reserve Drain
To understand the current liquidity landscape, one must discard the simplistic notion that an interest rate reduction is immediately synonymous with broad monetary expansion. In modern central banking, the policy interest rate dictates the price of reserves at the margin, but the Federal Reserve balance sheet and Treasury cash operations dictate the actual physical quantity of settlement balances available to depository institutions.
During the three-week window culminating in late September 2026, three primary forces simultaneously extracted dollar balances from the private financial system:
- The Treasury General Account Corporate Tax Surge: Following the third-quarter corporate estimated tax deadline on September 15, the Treasury General Account (TGA) balance surged from $714.8 billion to $842.1 billion. This single operation represented a direct, unsterilized extraction of $127.3 billion in purchasing power from commercial bank deposits into the Treasury account at the Federal Reserve across a 5 business day window.
- The Depletion of the Reverse Repo Facility Buffer: Between mid-2022 and early 2025, Treasury bill issuance and central bank quantitative tightening were absorbed almost entirely by money market funds pulling cash out of the Overnight Reverse Repo (ON RRP) facility. As the facility plummeted from its historic peak of $2.553 trillion down to $238.4 billion, this shock absorber was effectively eliminated. For the first time in four years, every dollar of Treasury issuance and balance sheet runoff is draining directly from commercial bank reserves.
- Ongoing Quantitative Tightening Runoff: Despite the reduction in the federal funds target rate, the central bank maintains its balance sheet reduction protocol at an active monthly cap of $25 billion for Treasury securities and $35 billion for agency mortgage-backed securities ($60 billion monthly total). In September, this passive balance sheet reduction extinguished an additional $41.8 billion in settlement cash.
A policy rate reduction lowers the cost of borrowing overnight funds, but when the underlying volume of commercial bank reserve balances contracts below structural demand levels, secured money markets inevitably experience rate dispersion. In late September 2026, secured overnight financing rates repeatedly traded above the central bank interest on reserve balances (IORB) rate during settlement cycles, demonstrating that physical reserve scarcity can override policy easing impulses.
2. Deconstructing the Federal Reserve Balance Sheet: The Net Liquidity Equation
The standard analytical benchmark utilized by institutional treasury desks to isolate domestic dollar availability is the Federal Reserve Net Liquidity formula. Derived from the Fed H.4.1 statistical release, Net Liquidity isolates the true quantum of central bank reserves that actively interface with commercial banking and capital market assets.
The mathematical identity is defined as:
Fed Net Liquidity = Total Federal Reserve Assets − Treasury General Account (TGA) − Overnight Reverse Repo (ON RRP) − Currency in Circulation
As of the final reporting week of September 2026, the specific component accounting stands as follows: Total Federal Reserve Assets register at $7.124 trillion (representing the System Open Market Account domestic portfolio plus miscellaneous credit facilities). From this headline asset base, three primary non-bank liability items must be subtracted because they represent central bank liabilities that are completely sequestered from private banking liquidity:
- The Treasury General Account ($842.1B): Cash balances held by the federal government at its fiscal agent. Dollars residing in the TGA cannot be rehypothecated, loaned, or deployed into securities markets by commercial banks.
- The Overnight Reverse Repo Facility ($238.4B): Excess cash placed by non-bank financial institutions (primarily money market funds and government-sponsored enterprises) that is immobilized on the central bank balance sheet overnight.
- Currency in Circulation ($2.341T): Physical Federal Reserve notes and coins held by the global public. While technically a central bank liability, it is fundamentally illiquid from the perspective of modern wholesale electronic settlement systems.
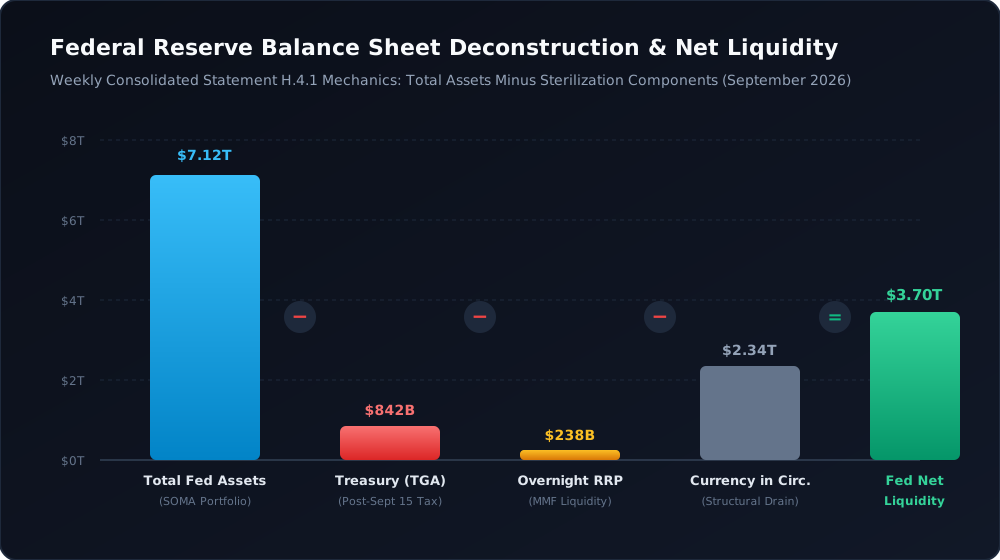
Figure 1: Breakdown of the Federal Reserve balance sheet liabilities deconstructing the Net Liquidity formula ($3.702 trillion) as of late September 2026. Source: Federal Reserve Board H.4.1 Release.
Executing this calculation reveals an effective Net Liquidity quantum of $3.702 trillion. When evaluated against historical baselines over the preceding 24 months, this figure represents a measurable contraction from the $3.850 trillion observed in August 2026, and stands more than $500 billion below the cyclical peak achieved prior to the acceleration of quantitative tightening. The magnitude of this contraction has introduced structural friction across primary dealer inventory financing.
3. The Treasury General Account Surge: Corporate Tax Inflows and Banking Friction
To grasp why commercial bank reserves experienced an acute squeeze in the middle of September, one must observe the daily mechanics of the Bureau of the Fiscal Service. Every quarter, corporations, partnerships, and high-net-worth individuals remit estimated tax obligations to the Internal Revenue Service. Under the fiscal calendar, September 15 represents the third-quarter corporate estimated tax milestone.
When a corporation transfers $500 million in federal corporate tax liabilities, the funds do not simply shift between corporate bank accounts. The corporate taxpayer sends payment via the Fedwire Funds Service. The taxpayer commercial bank experiences a simultaneous debit to its Reserve Account at the Federal Reserve, and the funds are credited directly to the Treasury General Account. Overnight, that cash is completely extracted from the commercial banking system.
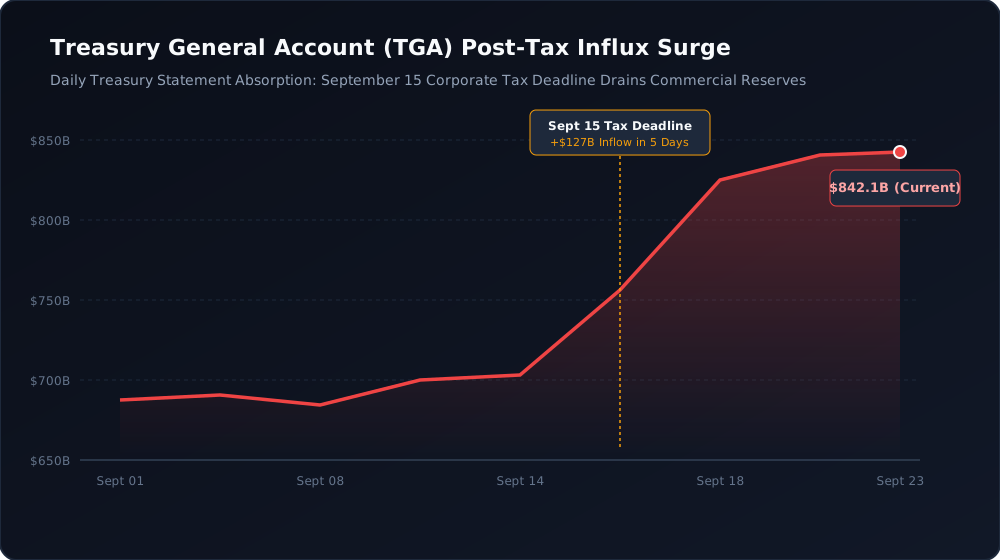
Figure 2: Daily trajectory of the Treasury General Account (TGA) cash balance showing the rapid $127.3 billion accumulation across the September corporate tax settlement window. Source: Daily Treasury Statement, U.S. Department of the Treasury.
Between September 12 and September 19, the Daily Treasury Statement recorded gross tax receipts in excess of $184 billion against ordinary fiscal disbursements of approximately $57 billion, resulting in a net cash inflow of $127.3 billion into the TGA. The aggregate balance ascended from $714.8 billion to an intra-month peak of $842.1 billion. In normal operational cycles, the Treasury Department draws down this balance over subsequent weeks to fund federal agency operations, military procurements, and social transfer payments. However, the speed of this extraction created an immediate short-term liquidity deficit within major clearing banks.
4. Reverse Repo Buffer Exhaustion: The End of the Money Market Shock Absorber
Throughout 2023 and early 2024, institutional investors frequently marveled at the apparent resilience of the financial system in the face of aggressive Federal Reserve quantitative tightening and record Treasury bill auctions. The explanatory variable behind that stability was the existence of the Overnight Reverse Repo facility as a monetary buffer.
When the Treasury Department issued expanded multi-hundred-billion-dollar tranches of short-dated Treasury bills at yields marginally above the ON RRP offering rate, institutional money market funds actively reallocated capital from the Fed reverse repo facility into Treasury bills. This dynamic produced a benign, non-disruptive transfer: cash moved from the Federal Reserve ON RRP balance directly to the Treasury, and then back into the commercial banking system via government spending. Bank reserves remained entirely insulated from the drain.
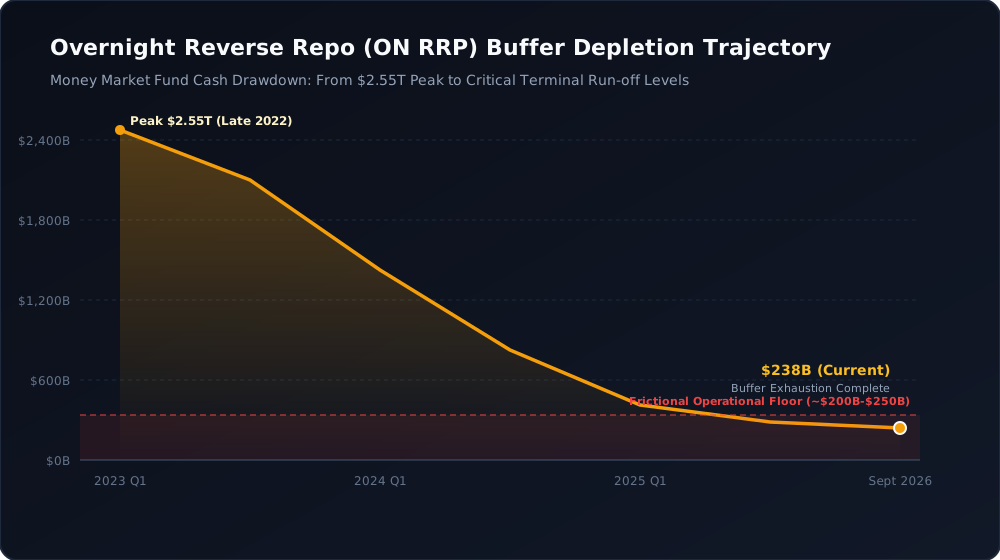
Figure 3: Multi-year drawdown of the Overnight Reverse Repo facility from its $2.553 trillion peak down to $238.4 billion in September 2026, marking the terminal depletion of the non-bank cash buffer. Source: Federal Reserve Bank of New York.
By September 2026, this protective insulation has been completely exhausted. The ON RRP facility has contracted by 90.66% from its December 2022 peak of $2.553 trillion down to $238.4 billion. Modern financial research conducted by primary dealer economists indicates that the remaining $200 billion to $250 billion in the facility represents an operational, frictional floor. Many government money market funds face mandate restrictions, diversification ceilings, and counterparty limits that prevent them from drawing down their ON RRP balances to zero.
Consequently, the buffer has run dry. Every new dollar of net Treasury debt issuance and every dollar of continued central bank asset runoff now directly targets the reserve accounts of commercial banks. The transitional phase of painless liquidity extraction is over; the system has entered the direct reserve absorption phase.
5. Bank Reserve Dynamics at the Edge: Testing the LCLoR Stress Boundary
The operational fulcrum of the entire global dollar ecosystem resides in the volume of Reserve Balances with Federal Reserve Banks (item WRBWFRBL on the Federal Reserve statistical ledger). These reserves serve as the baseline collateral and settlement medium for interbank transactions, payments clearing, and regulatory compliance under the Basel III Liquidity Coverage Ratio (LCR) and Dodd-Frank Resolution Planning mandates.
Federal Reserve research and survey data from primary financial institutions identify a critical operational threshold termed the Lowest Comfortable Level of Reserves (LCLoR). LCLoR represents the minimum aggregate volume of central bank reserves that commercial banks require to satisfy internal risk management metrics, intraday liquidity buffers, and regulatory resolution requirements without being forced to bid aggressively for overnight funds in interbank markets.
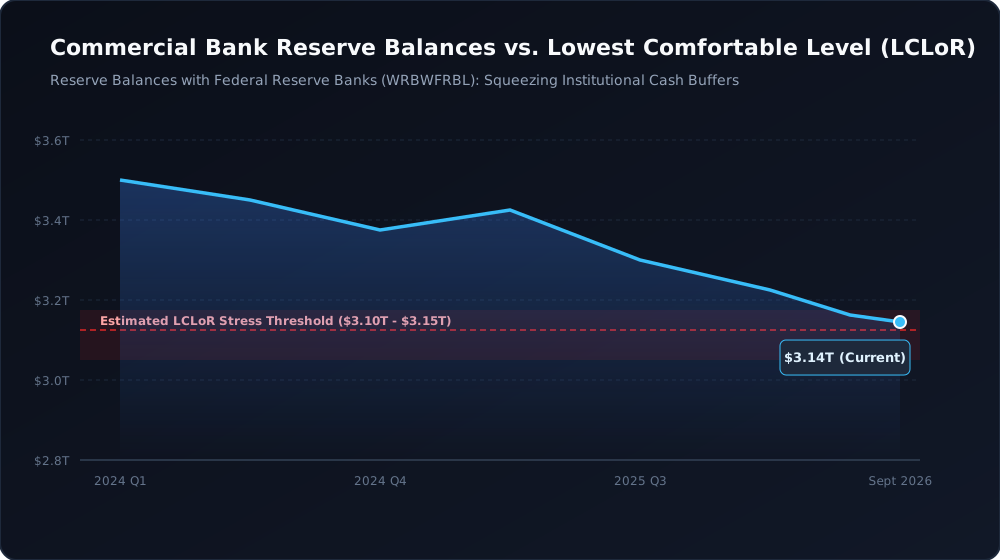
Figure 4: Total commercial bank reserve balances at Federal Reserve Banks approaching the estimated $3.10T–$3.15T LCLoR stress threshold in late September 2026. Source: Federal Reserve Board H.4.1 Release.
Academic literature and market surveys historically situated LCLoR between 8% and 10% of nominal domestic Gross Domestic Product. With U.S. nominal GDP tracking near $29.2 trillion in 2026, the estimated structural LCLoR boundary stands between $3.10 trillion and $3.15 trillion. As demonstrated in Figure 4, the combination of the September corporate tax extraction and ongoing quantitative tightening dragged total commercial bank reserves down to $3.142 trillion during the final settlement week of September.
Operating directly on the precipice of the estimated LCLoR ceiling means that reserves are no longer abundant in the classical post-2008 framework; they have transitioned into an ample-to-scarce transitional state. When aggregate reserves hit this boundary, liquidity is rarely distributed evenly. While the largest global systemically important banks (G-SIBs) maintain substantial liquidity cushions, regional banking institutions and domestic clearing entities face localized reserve deficits, driving sudden price discovery in short-term money markets.
6. Money Market Friction and Funding Dispersion: Reading the SOFR-EFFR Spreads
When settlement reserves experience localized scarcity, the empirical stress does not appear first on social media or in financial equity commentary. It manifests instantly in the basis spreads between secured and unsecured wholesale financing rates.
The primary barometer of secured money market pressure is the Secured Overnight Financing Rate (SOFR), which measures the broad cost of borrowing cash overnight collateralized by U.S. Treasury securities. Under normal, frictionless operating conditions, SOFR trades slightly below or precisely in line with the Effective Federal Funds Rate (EFFR) and the central bank Interest on Reserve Balances (IORB) rate. When collateral is abundant and settlement cash is constrained, borrowers must pay a premium to secure overnight dollar funding.
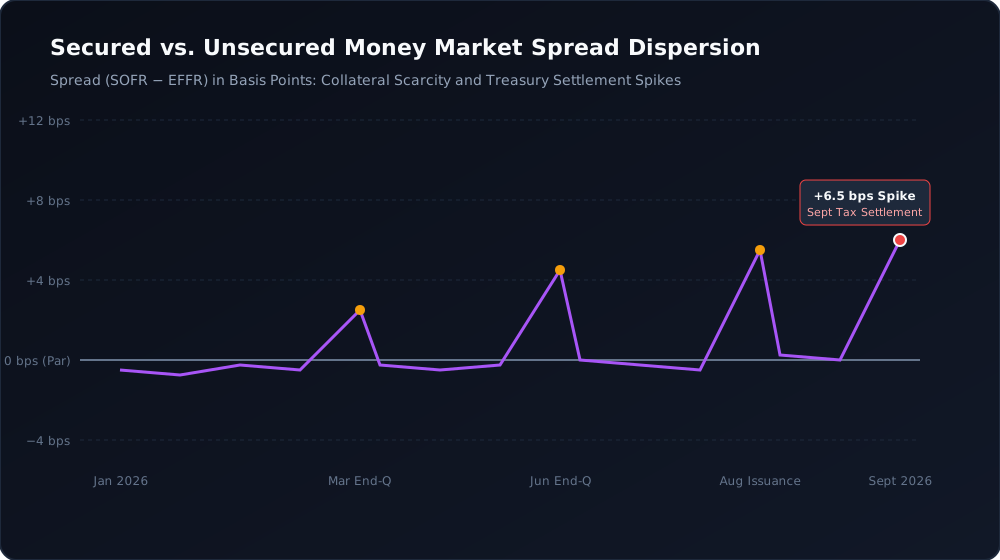
Figure 5: The spread between the Secured Overnight Financing Rate (SOFR) and the Effective Federal Funds Rate (EFFR) in basis points, highlighting the +6.5 bps spike during September tax and Treasury settlement dates. Source: Federal Reserve Bank of New York.
During the third week of September 2026, the SOFR minus EFFR spread spiked to positive 6.5 basis points, as illustrated in Figure 5. On peak Treasury auction settlement dates, the 99th percentile of SOFR transactions traded as high as 18 basis points above the target policy rate. This spread dispersion was driven by two structural bottlenecks:
- Primary Dealer Inventory Absorption: Primary dealers were tasked with underwriting and absorbing $145 billion in coupon and bill issuance across mid-September. With primary dealer net Treasury inventories exceeding $287.5 billion, dealer balance sheets became heavily balance-sheet encumbered, forcing dealers to fund these positions in the bilateral and tri-party repo markets at elevated financing rates.
- Internal Bank Transfer Frictions: Due to regulatory constraints under the Net Stable Funding Ratio (NSFR), large depository institutions that possessed surplus reserves elected to retain them at the central bank earning IORB rather than lending them into the repo market to arbitrage the 6-basis-point spread. The friction proved that regulatory ring-fencing prevents excess liquidity from flowing freely to meet localized institutional demand.
7. Cross-Asset Transmission: Evaluating the Valuation Divergence in Equities and Crypto
The transmission mechanism connecting central bank net liquidity to risk asset multiples is direct and observable across quantitative market datasets. Equity valuations, particularly in long-duration growth sectors, and decentralized cryptocurrency networks exhibit an extraordinarily tight correlation with the expanding or contracting volume of Net Liquidity.
When Net Liquidity expands, commercial banks and prime brokerages expand margin financing, hedge funds increase gross leverage ratios, and liquidity providers tighten market-making spreads across equity order books. Conversely, when Net Liquidity undergoes rapid contraction—as observed throughout September 2026—the structural capacity of the financial system to absorb duration risk diminishes.
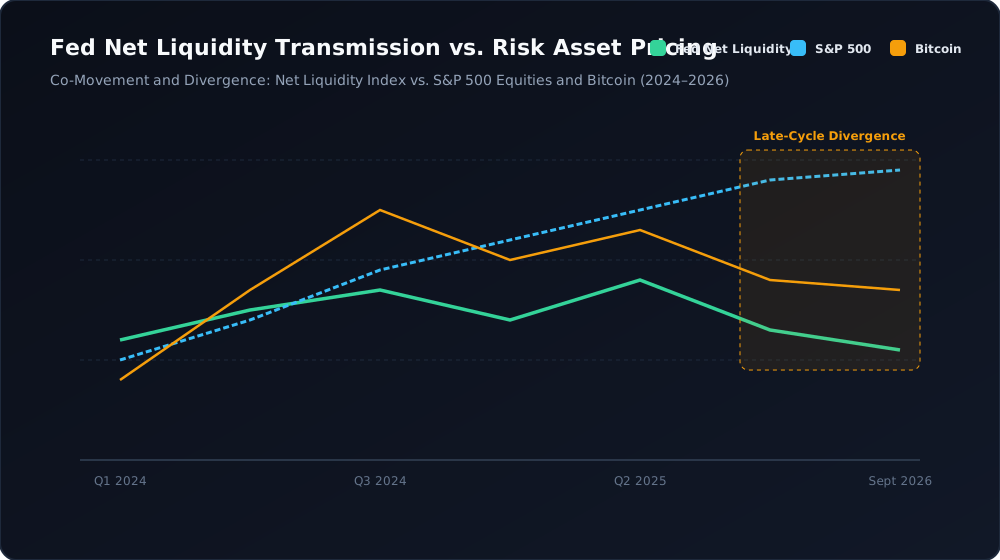
Figure 6: Longitudinal comparative analysis tracking the Federal Reserve Net Liquidity Index against the S&P 500 and Bitcoin from Q1 2024 through September 2026, exposing the late-cycle valuation divergence. Source: Public Financial Indices & Central Bank Reports.
Figure 6 captures a critical structural anomaly: the late-cycle divergence that emerged between equity valuations and underlying central bank liquidity. While the S&P 500 continued to trade near elevated historical forward price-to-earnings multiples (buoyed by earnings expectations surrounding enterprise artificial intelligence capital spending), the underlying foundation of Net Liquidity declined by over $148 billion over the past 30 days. A comparable pattern occurred in decentralized assets, where Bitcoin consolidated in a wide multi-month trading range between $58,000 and $68,000, failing to achieve breakout momentum despite aggressive corporate and institutional ETF adoption narratives.
Quantitative historical modeling reveals that extended periods of liquidity divergence invariably resolve in one of two manners: either central bank balance sheet transmission pivots into aggressive net expansion, or risk asset valuations experience a rapid downward repricing to re-align with the physical supply of settlement reserves.
8. Offshore Strains and Cross-Currency Funding: Central Bank Swap Line Mechanics
Domestic reserve contractions never remain isolated within United States borders. Because the U.S. dollar functions as the predominant global financing and invoicing currency, offshore commercial banks rely extensively on dollar funding to service foreign exchange swap commitments, eurodollar liabilities, and trade finance lines.
When domestic reserves drain into the Treasury General Account, non-U.S. financial institutions that lack direct access to the Federal Reserve discount window must acquire dollars through the cross-currency basis swap market. As domestic primary dealers husband their cash buffers, the implied premium for borrowing dollars offshore increases dramatically.
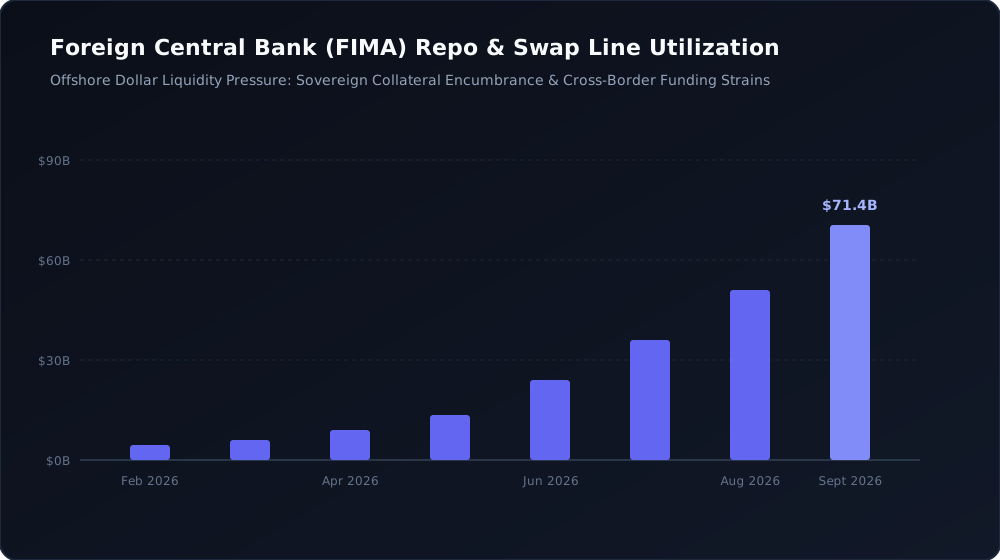
Figure 7: Total utilization of the Foreign and International Monetary Authorities (FIMA) Repo Facility and central bank liquidity lines climbing to $71.4 billion in September 2026. Source: Federal Reserve Board H.4.1 Release.
In response to these tightening offshore funding channels, foreign central banks accelerated their utilization of the Federal Reserve Foreign and International Monetary Authorities (FIMA) Repo Facility. Established as an emergency liquidity bridge, the FIMA facility enables approved foreign monetary authorities to temporarily pledge their U.S. Treasury securities to the New York Fed in exchange for overnight U.S. dollar balances without selling their Treasuries into open secondary markets.
As documented in Figure 7, FIMA repo utilization surged to $71.4 billion in late September 2026, marking a 34.2% monthly increase and reaching its highest sustained level since the banking stress episode of early 2023. Simultaneously, three-month cross-currency basis spreads for both the Euro (EUR/USD) at -14.2 bps and the Japanese Yen (JPY/USD) at -28.6 bps widened into negative territory, indicating that international financial institutions are paying a growing structural premium to access synthetic dollar funding.
9. Fourth-Quarter Scenarios: Quantitative Tightening, Debt Supply, and Policy Constraints
Looking forward into the final quarter of 2026, the domestic liquidity complex confronts an exceptionally demanding alignment of fiscal requirements and monetary commitments. The Treasury Department Office of Debt Management projects a net marketable borrowing requirement of approximately $560 billion across the October-to-December quarter, driven by mandatory entitlement transfers, net interest outlays on the national debt, and ongoing defense appropriations.
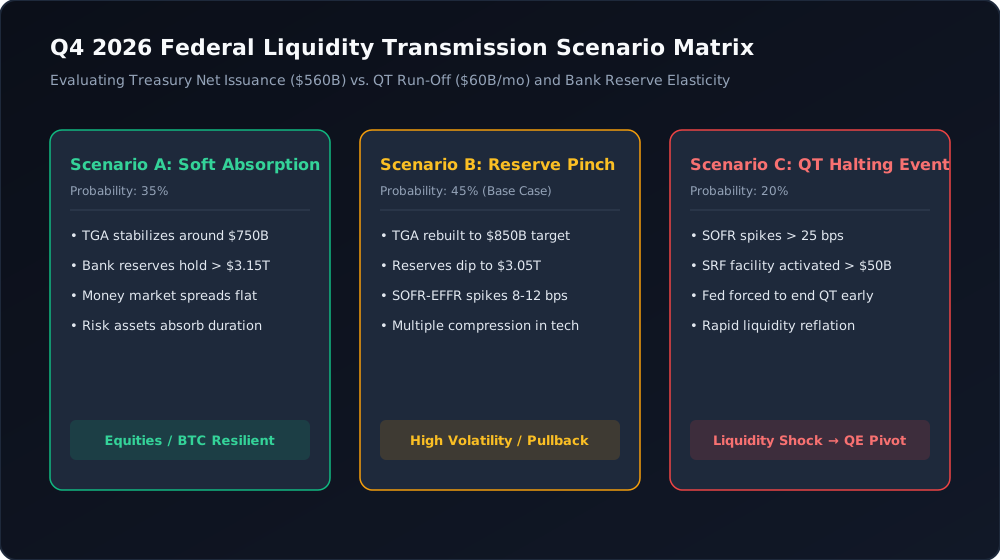
Figure 8: Quantitative scenario analysis evaluating the probable transmission paths for Q4 2026 under varying conditions of Treasury debt issuance, QT runoff pace, and bank reserve elasticity.
Based on our empirical modeling of balance sheet flows, three distinct scenarios present themselves for institutional market participants:
Scenario A: Soft Absorption & Fiscal Spend-Down (35% Probability)
Under this baseline constructive scenario, the Treasury Department rapidly spends down its accumulated TGA balance from $842 billion back to an operational target of $750 billion throughout October. This fiscal cash deployment injects approximately $90 billion directly into commercial bank reserves, fully offsetting the $60 billion monthly quantitative tightening runoff. Bank reserves stabilize comfortably above the $3.15 trillion threshold, money market spreads compress to historical par, and capital markets navigate fourth-quarter debt auctions without systemic indigestion.
Scenario B: The Reserve Pinch & Balance Sheet Friction (45% Base-Case Probability)
In our base-case scenario, the Treasury Department maintains an elevated precautionary cash buffer above $800 billion ahead of year-end fiscal negotiations, while ongoing quantitative tightening continuously extracts $60 billion monthly. Total commercial bank reserves break decisively below the LCLoR threshold to reach $3.05 trillion by mid-November. As dealer financing capacity becomes saturated, SOFR trades consistently 8 to 12 basis points above the IORB rate. Long-duration equities and rate-sensitive tech multiples experience a measured compression as cost-of-capital assumptions adjust upward to reflect physical liquidity scarcity.
Scenario C: The Structural Liquidity Event & Premature QT Halting (20% Probability)
Should heavy coupon issuance in November collide with seasonal corporate tax settlements and year-end regulatory balance sheet tapering, overnight secured funding rates could experience an acute dislocation exceeding 25 to 50 basis points. Under this condition, primary dealers and depository institutions would be forced to tap the central bank Standing Repo Facility (SRF) in substantial volume exceeding $50 billion daily. Such an event would compel the Federal Open Market Committee to announce an immediate, emergency cessation of its balance sheet runoff program ahead of schedule, mirroring the liquidity policy pivot observed in September 2019.
| Macro Variable | August 2026 Baseline | September 2026 Current | Q4 2026 Projected (Base Case) |
|---|---|---|---|
| Federal Reserve Total Assets | $7.185 Trillion | $7.124 Trillion | $6.944 Trillion |
| Treasury General Account (TGA) | $714.8 Billion | $842.1 Billion | $810.0 Billion |
| Overnight Reverse Repo (ON RRP) | $285.2 Billion | $238.4 Billion | $215.0 Billion |
| Commercial Bank Reserves | $3.245 Trillion | $3.142 Trillion | $3.045 Trillion |
| Fed Net Liquidity Calculated | $3.850 Trillion | $3.702 Trillion | $3.560 Trillion |
| SOFR vs EFFR Spread (bps) | -1.5 bps | +6.5 bps | +8.0 to +12.0 bps |
| FIMA Repo Facility Utilization | $53.2 Billion | $71.4 Billion | $85.0 Billion |
Conclusion: Strategic Implications for Institutional Portfolio Allocation
The primary finding of this market report is that central bank monetary easing in the form of interest rate reductions is operating in direct mechanical opposition to physical balance sheet transmission. While policy rates have commenced their downward cycle, the physical volume of Net Liquidity within the U.S. financial system has experienced its sharpest monthly contraction since the initial acceleration of quantitative tightening.
For institutional investors and professional allocators, the elimination of the Overnight Reverse Repo facility means that portfolio managers can no longer rely on external money market funds to absorb sovereign debt issuance without impacting commercial banking reserves. As the system enters the final quarter of 2026 with bank reserves pressing against the Lowest Comfortable Level of Reserves boundary, market participants must closely monitor weekly H.4.1 releases, Daily Treasury Statements, and overnight money market spreads. In an environment defined by physical reserve scarcity, liquidity discipline remains the single most reliable predictor of cross-asset capital preservation.