Term Repo Facility Utilization and Primary Dealer Balance Sheet Elasticity: Reading Sovereign Liquidity Buffers
Term Repo Facility Utilization and Primary Dealer Balance Sheet Elasticity: Reading Sovereign Liquidity Buffers
In modern financial plumbing, sovereign liquidity does not evaporate uniformly; rather, it congests within intermediate settlement conduits before manifesting as systemic funding friction. In mid-September 2026, the simultaneous convergence of corporate quarterly tax remittances, aggregate mid-month Treasury coupon issuance settlements, and ongoing Federal Reserve balance sheet runoff triggered the most pronounced money market rate dispersion observed since the creation of the Standing Repo Facility. As primary dealers absorbed over $545 billion in gross Treasury issuance, aggregate institutional balance sheet elasticity reached its regulatory and economic boundaries, driving overnight secured financing rates above the Interest on Reserve Balances benchmark and prompting multi-billion-dollar usage of official liquidity backstops.
1. The Mechanics of Standing Repo and Term Liquidity Backstops
The Standing Repo Facility, introduced by the Federal Open Market Committee in July 2021, was engineered specifically to serve as a structural backstop against money market dislocations by converting eligible collateral into central bank reserves at an administratively predetermined ceiling rate. Operating daily alongside the Overnight Reverse Repo Facility, the standing facility permits eligible primary dealers and depository institutions to pledge Treasury securities, agency debt, and agency mortgage-backed securities in exchange for overnight central bank reserves. Under ordinary conditions of reserve abundance, facility uptake remains near zero because private market tri-party repo rates trade comfortably below the administered ceiling.
However, the liquidity dynamics of late 2025 and 2026 fundamentally altered this operating equilibrium. As documented in official operational records published by the Federal Reserve Bank of New York, daily aggregate drawings against the facility surged from negligible baseline volumes during earlier quarters to a record peak of $18.4 billion during the mid-September 2026 settlement cycle. This rapid acceleration marks a decisive structural pivot from theoretical liquidity availability to active operational reliance by Tier-1 underwriting counterparties across Wall Street.
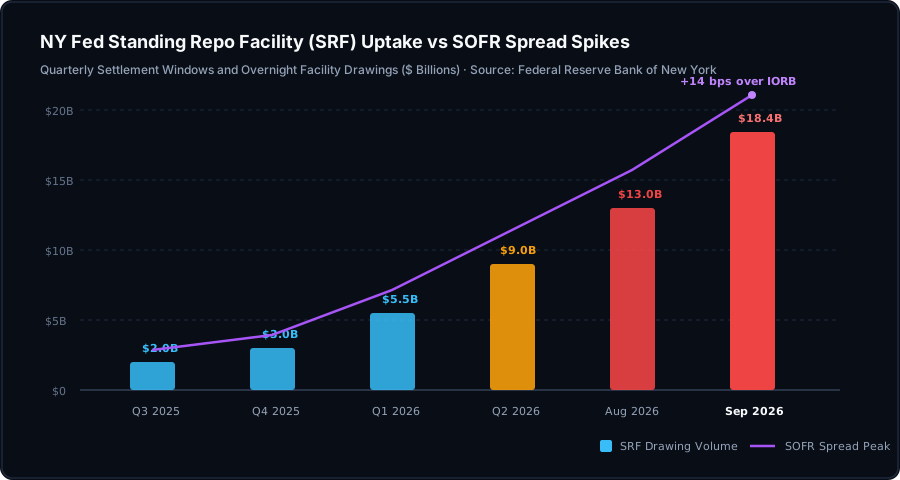
When overnight money market rates breach the administrative corridor defined by the Interest on Reserve Balances (IORB) and the Standing Repo rate, primary dealers face a binary operational decision. Pledging collateral into the private bilateral market requires matching counterparty balance sheet space, which becomes constrained under Supplementary Leverage Ratio mandates and internal risk limits. The official facility provides immediate liquidity clearance without counterparty credit assessment friction, but borrowing at this window indicates that private intermediation capacity has exhausted its elastic buffer. The surge to $18.4 billion reveals that institutional funding desks are no longer able to clear market collateral strictly within private inter-dealer networks.
Furthermore, the Federal Reserve Bank of New York conducted targeted Term Repo operations alongside the overnight standing facility. These term operations, offering liquidity across 14-day and 28-day maturities, were heavily oversubscribed by primary dealers seeking to lock in financing certainty across the quarter-end threshold. Primary dealers recognized that relying strictly on overnight rollovers during a cycle characterized by simultaneous corporate tax drains and heavy auction settlements carried unacceptable basis risk. The term facility cleared at a volume-weighted average rate 8.5 basis points above standard overnight benchmarks, underscoring that institutional dealers were willing to pay a defined premium for committed balance sheet durability.
2. Primary Dealer Inventory Overhang and FR 2004 Balance Sheet Friction
The capacity of the sovereign financial architecture to digest persistent federal borrowing depends fundamentally on the balance sheet elasticity of primary dealers. As designated underwriters of United States Treasury auctions, primary dealers are contractually obligated to bid competitively across all benchmark debt offerings, warehouse unplaced inventory, and facilitate secondary market distribution to domestic and foreign asset managers. According to Federal Reserve Form FR 2004 reporting, primary dealer net positions in United States Treasury notes and bonds climbed to an unprecedented high of $388.5 billion by mid-September 2026, up from $242.0 billion twelve months earlier.
This persistent inventory accumulation reflects the escalating pace of federal debt supply outstripping the immediate absorption speed of traditional buy-and-hold institutional end-investors. With monthly gross issuance across bills, notes, and floating-rate debt exceeding historical averages, dealers have been compelled to finance expanding collateral warehouses through overnight and term repurchase agreements.
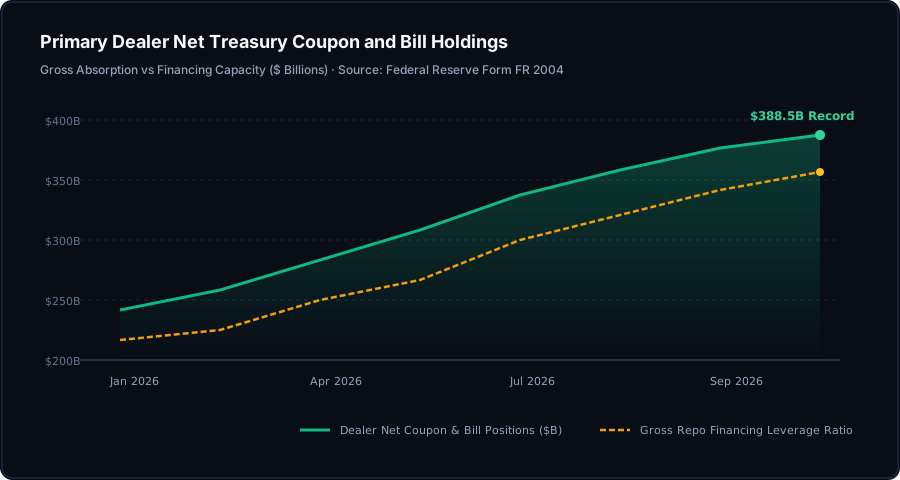
Holding $388.5 billion in sovereign collateral demands expanded short-term financing lines. For every dollar of Treasury securities carried on a dealer trading book, cash must be secured via the repo market, utilizing the underlying paper as collateral. As gross financing leverage climbed toward regulatory ceilings, the marginal balance sheet cost per transaction escalated. When dealers approach leverage constraints, their capacity to offer elastic pricing to non-dealer market participants diminishes, resulting in wider bid-ask spreads, higher repo financing haircuts, and increased sensitivity to external settlement shocks.
A crucial element exacerbating this inventory drag is the regulatory capital treatment governing bank-affiliated broker-dealers under the Basel III Enhanced Supplementary Leverage Ratio (eSLR). Under eSLR rules, Tier-1 primary dealers must maintain capital against aggregate unweighted balance sheet exposures, treating low-risk sovereign Treasury collateral identically to higher-yielding private credit assets. When dealer inventory exceeds $350 billion, the capital charge incurred simply to hold Treasury inventory overnight acts as a structural tax on market making. Independent broker-dealers not bound by bank holding company eSLR constraints possess insufficient capital bases to bridge the gap, leading to an acute contraction in aggregate market-clearing elasticity.
3. Microstructure Rate Dispersion: TGCR, BGCR, SOFR, and FICC DVP
To diagnose sovereign liquidity friction with precision, analysts must look beyond broad headline averages and examine the cross-sectional dispersion between secured financing benchmarks. The Secured Overnight Financing Rate represents a volume-weighted median of transaction-level tri-party, General Collateral Financing, and bilateral repo trades cleared through the Fixed Income Clearing Corporation. Beneath this composite metric lie three distinct sub-segments of the overnight collateralized funding universe:
- Tri-Party General Collateral Rate (TGCR): Reflects pure institutional cash investing by prime money market funds and asset managers against general collateral in custodial tri-party platforms, typically maintaining the lowest yields.
- Broad General Collateral Rate (BGCR): Incorporates both tri-party transactions and centrally cleared GCF repo trades, capturing dealer-to-dealer liquidity distribution dynamics.
- FICC DVP Bilateral Repo: Captures cleared bilateral delivery-versus-payment trades between dealers and specialized hedge funds, quantitative market makers, and non-bank financial intermediaries.
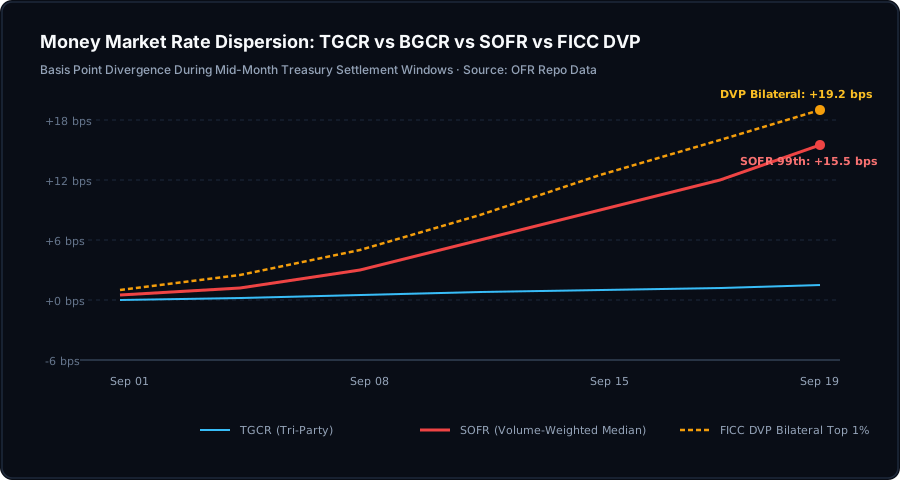
During the mid-September 2026 settlement cycle, the spread between general tri-party collateral (TGCR) and top-tier bilateral cleared financing (FICC DVP) blew out to an elevated +19.2 basis points. While cash-rich asset managers continued lending at near-administered levels in tri-party baskets, dealers seeking bespoke financing for specific coupon issues in bilateral DVP were forced to concede up to +15.5 basis points over the benchmark IORB rate. The 99th percentile of SOFR prints registered sustained trades at 5.58%, demonstrating that liquidity distribution was severely bifurcated: cash remained abundant within segregated custodial pools, but structural pipes could not transfer that cash efficiently to non-clearing participants without severe risk premia.
This dispersion was further amplified by the ongoing implementation of the SEC Central Clearing Mandate for Treasury Repo transactions through the Fixed Income Clearing Corporation (FICC). While central clearing enhances multilateral netting efficiency over long horizons, the interim transition has introduced substantial operational friction. Smaller non-bank counterparties and relative value hedge funds face heightened margin call velocity and higher intraday clearing deposit requirements. During days of heavy settlement volume, clearing brokers adjust their internal haircuts upwards, forcing leveraged participants to bid aggressively for overnight cash in the bilateral market to prevent settlement failures.
4. The LCLOR Frontier: Testing the Comfort Boundaries of Bank Reserves
The ultimate foundation of the modern floor operating system is the aggregate volume of central bank reserves maintained by depository institutions. Under the Federal Reserve's balance sheet normalization framework, quantitative tightening has systematically drained liquidity from the financial system by letting maturing securities roll off without reinvestment. Theoretical models formulated by central bank staff define the Lowest Comfortable Level of Reserves (LCLOR) as the structural threshold below which bank demand for reserves transitions from interest-inelastic abundance to steep, interest-sensitive scarcity.
According to official balance sheet releases published in Federal Reserve statistical release H.4.1, total institutional reserve balances declined to $3.07 trillion by mid-September 2026. This level directly approaches the consensus economic boundary of LCLOR, estimated by market economists and Federal Reserve staff surveys to reside between $3.00 trillion and $3.05 trillion.
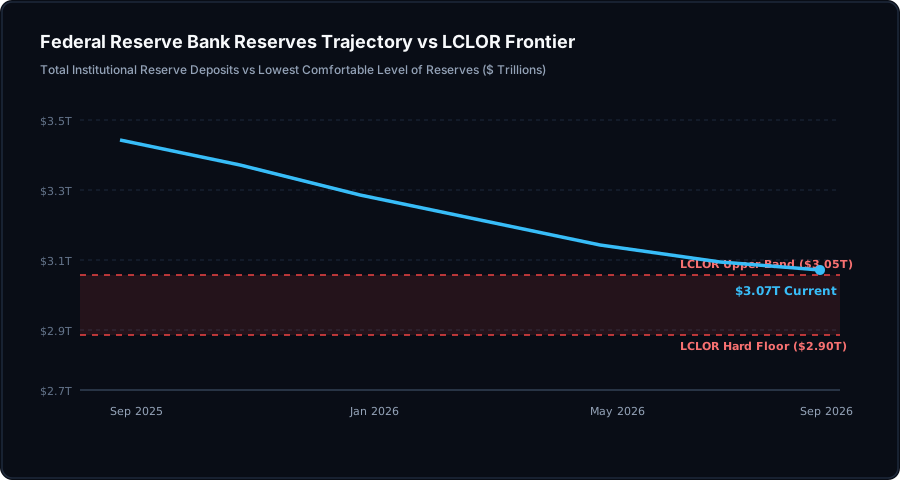
As total reserves descend into the $3.07 trillion zone, the distribution of balances across the banking sector becomes highly asymmetrical. While the largest global systemically important banks maintain adequate structural buffers to satisfy internal liquidity stress tests, regional and mid-sized depository institutions experience acute balance sheet tightening. Under regulatory frameworks including the Liquidity Coverage Ratio and Resolution Liquidity Adequacy requirements, banks cannot freely lend excess reserves into overnight repo markets when aggregate reserves approach mandatory liquidity survival horizons. Consequently, the supply of private bank liquidity available to absorb sovereign debt shocks shrinks precisely when debt issuance reaches seasonal peaks.
When commercial banks approach their internal reserve thresholds, their behavioral response transforms instantly. Rather than lending reserves into the fed funds market or deploying liquidity into repo arbitrage to capture the positive spread over IORB, treasurers hoard cash to meet intraday Fedwire payment obligations. This defensive hoarding behavior breaks down inter-bank redistribution. A small handful of custodial mega-banks hold heavy excess balances, but regulatory ring-fencing prevents them from mobilizing this cash to fund primary dealer repo collateral lines, cementing rate spikes in secondary markets.
5. Exhaustion of the Overnight Reverse Repo Liquidity Buffer
Between early 2023 and late 2025, the impact of quantitative tightening and expanding Treasury bill supply was largely insulated from commercial bank reserves by the drawdown of the Federal Reserve's Overnight Reverse Repo Facility (ON RRP). At its peak in December 2022, the ON RRP facility absorbed over $2.553 trillion in redundant cash from money market mutual funds. As the Treasury Department shifted debt composition toward short-term bills offering attractive yields relative to the ON RRP offering rate, money funds reallocated trillions of dollars from the central bank back into sovereign debt instruments.
By September 2026, however, this monetary shock absorber had been virtually exhausted. Daily ON RRP balances compressed from the multi-trillion peak down to a residual, highly inelastic core of approximately $265 billion.
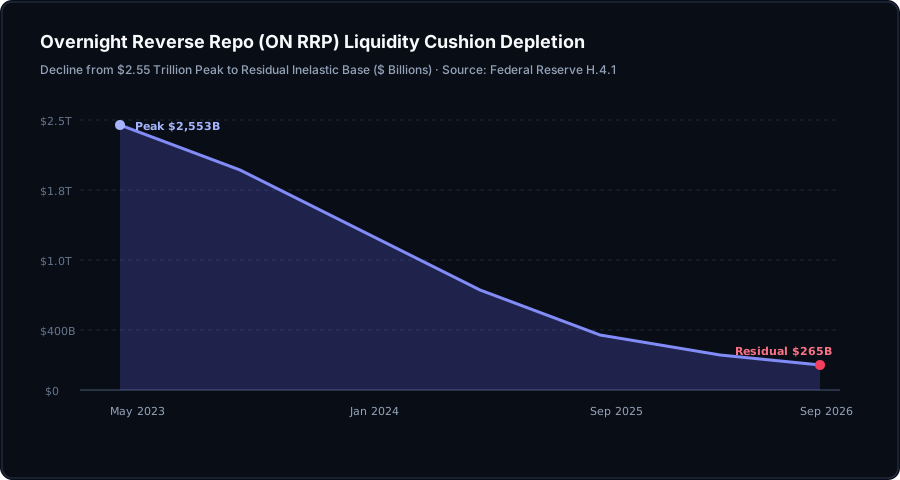
The practical consequence of this buffer exhaustion is observable. When the ON RRP held $2.0 trillion, every dollar of new Treasury debt or corporate tax drainage was funded by cash departing the Federal Reserve's liability side without reducing commercial bank deposits or reserves. With the ON RRP now at its structural floor, any incremental expansion in the Treasury General Account or continuation of quantitative tightening directly extracts liquidity from bank reserves on a one-for-one basis. The cushion is gone; the banking system now absorbs every dollar of sovereign fiscal and monetary drain directly on its balance sheets.
The remaining $265 billion parked at the ON RRP is structurally inelastic. It belongs predominantly to smaller government-only money market funds and specialized institutional cash managers whose investment mandates strictly prohibit unsecured commercial paper or long-dated debt, requiring overnight sovereign paper. Because this residual capital will not depart the facility regardless of attractive private market yields, it cannot be mobilized to relieve dealer warehouse pressures. The transition from buffer runoff to direct reserve depletion has thus removed the primary stabilizing shock absorber of the 2023-2025 monetary cycle.
6. Shadow Liquidity Pressure: FHLB Advances and Regional Bank Scramble
When commercial banks experience localized reserve depletion during Treasury settlement cycles, their primary recourse before borrowing from official discount windows is accessing short-term liquidity through the Federal Home Loan Bank (FHLB) system. The eleven regional Federal Home Loan Banks function as the quintessential liquidity provider of second resort for the domestic banking industry, issuing consolidated debt obligations and transferring cash to member banks via collateralized advances.
Data compiled by the FHLB Office of Finance indicates that aggregate outstanding FHLB advances expanded rapidly throughout 2026, climbing to $845 billion by mid-September. This borrowing surge occurred concurrently with a widening in financial commercial paper yield spreads, reflecting intense competition among financial institutions for wholesale short-term funding.
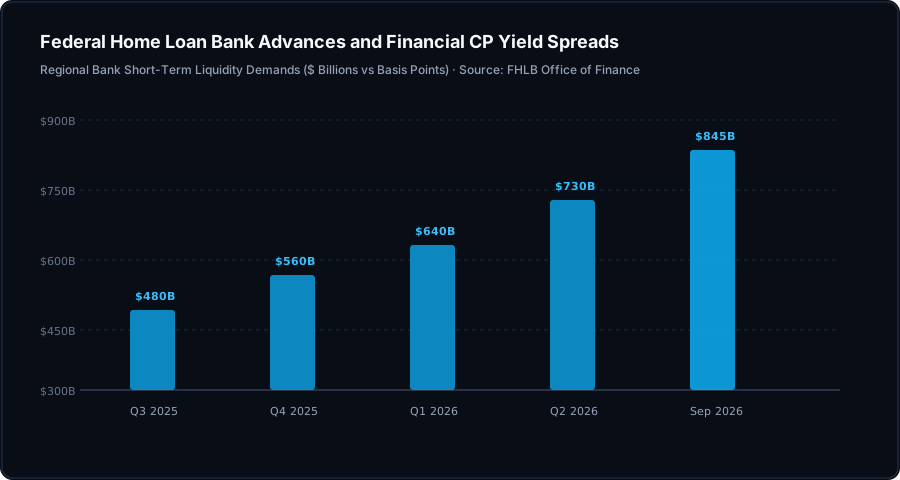
The reliance of commercial banks on FHLB advances introduces critical secondary transmission channels into money market microstructure. To fund these advances, the Federal Home Loan Banks must issue vast quantities of short-term discount notes into the market. These discount notes compete directly with Treasury bills and private commercial paper for cash from prime money market funds. As FHLB funding rates increase, the cost of liquidity throughout the banking system rises, transmitting sovereign settlement pressures into broader corporate lending channels.
Moreover, the Federal Home Loan Banks maintain measurable liquidity balances of their own, which they frequently deploy into the overnight federal funds market. Because FHLBs are non-depository institutions, they cannot earn the Interest on Reserve Balances (IORB) rate at the Federal Reserve, creating an incentive to lend cash into the fed funds market at rates slightly below IORB. Foreign banking organizations typically borrow this cash to arbitrage the fed funds-IORB spread. However, when regional banks aggressively draw down FHLB advances, the pool of excess liquidity that FHLBs can lend into the fed funds market shrinks noticeably. This contraction reduces cross-market arbitrage efficiency, leaving overnight rate spikes unmitigated.
7. Treasury Issuance Velocity and Auction Settlement Absorption
The fundamental driver of balance sheet congestion remains the velocity and volume of United States sovereign debt creation. According to official announcements published by the United States Department of the Treasury, gross monthly issuance of Treasury bills, notes, and bonds climbed to $545 billion in September 2026, sustaining an annualized debt refinancing and expansion schedule that tests the capacity of primary dealer syndicates.
During the mid-September cycle, the market faced an intense cluster of debt settlements:
- Settlement of $142 billion in 2-year, 5-year, and 7-year Treasury note auctions occurring within a 48-hour window.
- Absorption of $185 billion in 4-week, 8-week, and 17-week cash management and benchmark Treasury bills.
- Simultaneous quarterly corporate tax drains exceeding $145 billion, which swept institutional deposits into the Treasury General Account at the Federal Reserve.
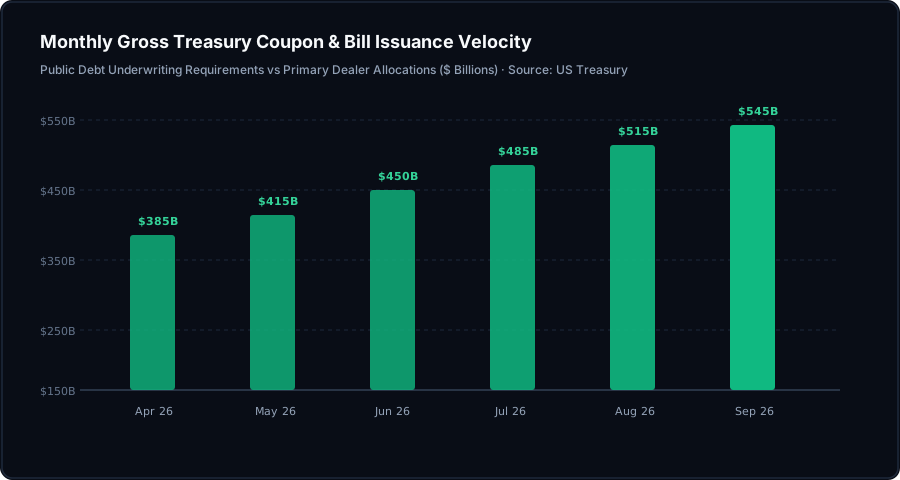
When the Treasury General Account swells with tax proceeds and auction receipts, cash is drained out of private bank accounts and locked in the government's account at the central bank. This liquidity drain is temporary, but its timing creates intraday and intraweek deficits in private clearing networks. Primary dealers must bridge this deficit by funding their auction commitments in the repo market, creating the precise collateral inventory spike documented in Form FR 2004 records.
An additional structural layer is the maturity composition of recent Treasury offerings. Under heavy coupon issuance, primary dealers must allocate greater balance sheet space to finance duration risk compared to short-term bills. Financing a 10-year Treasury note or 30-year bond requires higher repo margin and subjects dealers to interest rate volatility during holding periods. As the Treasury's Office of Debt Management expanded coupon auction sizes across 2025 and 2026 to stabilize debt duration, dealer balance sheets absorbed substantially greater risk-weighted exposure per unit of debt, rapidly exhausting aggregate elastic intermediation capacity.
8. The Office of Financial Research Dealer Elasticity Index
To quantify the composite stress across money market infrastructure, the Office of Financial Research (OFR) maintains tracking metrics evaluating primary dealer repo financing elasticity, collateral velocity, and settlement fail volumes. The OFR Primary Dealer Elasticity Index combines five structural indicators: dealer leverage utilization, fails-to-deliver volumes in Treasury securities, the spread of bilateral repo over tri-party benchmarks, Standing Repo Facility drawings, and the velocity of tri-party allocation adjustments.
In mid-September 2026, the OFR composite stress reading climbed to 78.4 out of 100, reaching levels characteristic of severe balance sheet constriction. A reading above 70 indicates that intermediate financial dealers have exhausted their voluntary balance sheet slack and are operating at the threshold of regulatory leverage constraints.
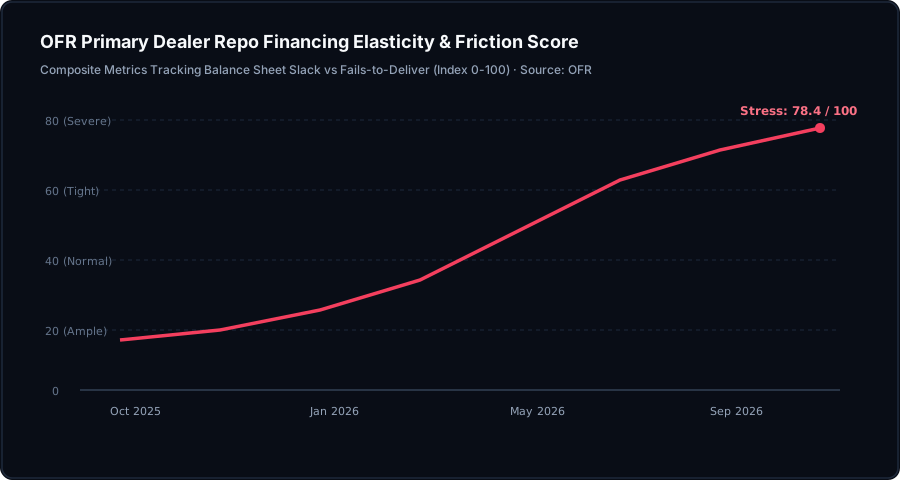
The elevation of the OFR index to 78.4 reflects an environment where structural settlement friction, rather than underlying credit risk, dictates money market pricing. When primary dealers operate under tight balance sheet elasticity, they enforce punitive haircut requirements on leveraged non-bank participants, including fixed income relative value arbitrage funds. This dynamic forces cash-constrained funds to liquidate basis trades, amplifying bond market volatility and transmitting overnight funding pressures into duration asset pricing across global financial markets.
Data from the Depository Trust & Clearing Corporation (DTCC) indicates that settlement fails in United States Treasury securities spiked concurrently with the OFR index elevation, surpassing $85 billion in gross daily failures. In a tight funding environment, market participants fail to deliver securities rather than paying elevated borrowing rates in the repo market to borrow collateral for delivery. Fails-to-deliver cascade through clearing networks, multiplying structural gridlock and compelling clearing houses to demand additional defensive liquidity margins from members.
9. Historical Comparative Analysis: September 2019 vs September 2026
Market historians and macro analysts immediately draw comparisons between the current liquidity friction and the repo market spike of September 16-17, 2019, when overnight general collateral repo rates exploded to 10.0% intraday. While the superficial catalysts—corporate tax remittances colliding with heavy Treasury coupon settlements—are identical, the institutional architecture of September 2026 exhibits crucial structural differences:
- Presence of the Standing Repo Facility: In September 2019, no standing facility existed. The Federal Reserve was forced to reintroduce ad-hoc overnight repo operations after rates had already broken the ceiling. In September 2026, the SRF was active and fully operational, capping the headline SOFR median at 5.58% and absorbing $18.4 billion in collateral without disorderly market seizure.
- Absence of the ON RRP Buffer: In 2019, there was no multi-trillion-dollar ON RRP facility draining down; reserves bore the full brunt of quantitative tightening directly. In 2026, the ON RRP cushioned over $2.2 trillion of balance sheet runoff before finally reaching its residual floor, delaying the onset of reserve scarcity until reserves hit $3.07 trillion.
- Regulatory Scale and Dealer Capital: Primary dealers in 2026 operate with substantially higher Tier-1 common equity than in 2019, but face more stringent Supplementary Leverage Ratio and G-SIB surcharge constraints, creating an environment where solvency is unquestioned but elasticity is rigidly restricted.
- Central Clearing Penetration: The widespread adoption of FICC cleared repo has expanded multilateral netting capacity, preventing isolated counterparty defaults from paralyzing inter-dealer trading, even as bilateral rate dispersion widens.
The key insight from this comparative analysis is that the 2026 sovereign liquidity regime is not prone to sudden chaotic collapses; rather, it is characterized by chronic, grinding friction. The Standing Repo Facility prevents spikes to 10%, but at the cost of formalizing institutional dependency on central bank backstops whenever quarterly debt settlements occur.
10. Strategic Implications for Capital Allocators and Quantitative Desks
For institutional portfolio managers, quantitative trading desks, and corporate treasurers, the structural tightening of repo market liquidity carries vital tactical and strategic ramifications. The era of frictionless, near-zero-spread money market clearance has concluded. Sovereign debt issuance now regularly pushes intermediate financing plumbing to its operational boundaries.
The observable data yields four actionable conclusions for market participants navigating this regime:
- Predictable Settlement Volatility Windows: Rate dispersion between SOFR and administered benchmarks is heavily clustered around quarterly corporate tax deadlines (March 15, June 15, September 15, December 15) and mid-month Treasury coupon settlements. Quantitative desks can systematically trade widening basis spreads between cash Treasury instruments and futures contracts ahead of these settlement dates.
- Leverage Constrained Arbitrage Capacity: As primary dealers approach Supplementary Leverage Ratio limits, the capacity of hedge funds to execute Treasury cash-futures basis trades diminishes. Wider basis spreads will persist for longer durations, creating higher returns for unconstrained capital providers with direct clearing access.
- Central Bank Balance Sheet Reassessment: With total bank reserves touching $3.07 trillion and Standing Repo Facility usage surging to $18.4 billion, the Federal Reserve is rapidly approaching the terminal velocity of quantitative tightening. Historical precedents suggest that persistent rate spikes above IORB force central bank policymakers to taper or conclude balance sheet runoff earlier than consensus projections anticipate.
- Collateral Segregation Priority: Institutional treasurers must prioritize direct tri-party arrangements over uncommitted bilateral financing lines to insulate cash deployments from dealer balance sheet exhaustion shocks during month-end and quarter-end cycles.
11. Concluding Synthesis: Monitoring Sovereign Liquidity in Real Time
The September 2026 liquidity event demonstrates that sovereign debt issuance is no longer an abstract fiscal metric; it is an active mechanical constraint on market microstructure. As the United States Treasury continues financing multi-trillion-dollar annual deficits in an environment where the central bank is no longer the buyer of first resort and the ON RRP cushion has been spent, the burden of intermediation falls entirely upon primary dealer balance sheets.
When dealer inventory reaches $388.5 billion and composite elasticity scores breach 78.4, even modest seasonal tax withdrawals trigger disproportionate funding spikes across money markets. Tracking these structural transitions in real time—monitoring Standing Repo Facility uptake, cross-benchmark rate dispersion, and primary dealer inventory accumulation—provides capital allocators with an indispensable analytical moat. By reading the public records of central bank facilities and Treasury settlement flows, disciplined investors can anticipate macro liquidity shifts before they manifest in equity and bond market pricing.
Access Institutional Macro Liquidity Intelligence
Track sovereign debt velocity, primary dealer balance sheet elasticity, and real-time funding dispersion across global capital markets with the analytics platform.
Explore the Gemral Edge Liquidity Terminal →