Treasury General Account Volatility and Commercial Bank Reserve Absorption: Quantifying Tax Date Liquidity Drains, Sovereign Issuance Surges, and Repo Market Elasticity in September 2026
Macro & Liquidity Treasury Plumbing Bank Reserves Repo Market Market ReportTreasury General Account Volatility and Commercial Bank Reserve Absorption: Quantifying Tax Date Liquidity Drains, Sovereign Issuance Surges, and Repo Market Elasticity in September 2026
A forensic empirical audit of the U.S. Treasury Daily Statements, Federal Reserve H.4.1 statistical releases, and secured financing benchmark microstructures in mid-September 2026 demonstrates an historic regime shift in global dollar liquidity. For over three years, institutional capital markets operated under the illusion of abundant liquidity as the Federal Reserve Overnight Reverse Repurchase facility absorbed the primary burden of Quantitative Tightening and debt ceiling replenishment. With that overnight buffer functional depletion at $242.0B, systemic monetary plumbing has lost its primary insulator. The convergence of the third-quarter corporate tax settlement deadline on September 15, surging net sovereign marketable issuance across bills and coupon debt, and ongoing central bank balance sheet runoff has initiated an aggressive direct extraction of commercial bank reserves, compressing domestic operating cash toward the estimated $3,000B threshold and unleashing acute friction across overnight funding markets.
The mechanics of central bank accounting dictate that the Treasury General Account (TGA)—the operational checking account of the federal government held directly at the Federal Reserve Bank of New York—acts as an inverted liquidity siphon. When corporate taxpayers transmit quarterly estimated tax liabilities, or when primary dealers purchase newly auctioned Treasury securities, deposits depart commercial bank accounts and credit the Treasury sovereign account. Because the Treasury does not redeposit cash into commercial banking channels until legislative appropriations are disbursed, every dollar accumulating in the TGA represents a dollar extinguished from commercial bank reserves. In this comprehensive institutional market report, this technical intelligence desk dissects the eight structural pillars governing this sovereign liquidity drain, examining the empirical trajectory of bank reserves, sovereign issuance composition, repo rate dispersion, and primary dealer balance sheet saturation.
The Mechanics of the Treasury General Account: How Sovereign Cash Balances Direct Systemic Liquidity
Understanding contemporary macro liquidity begins with the institutional mechanics of the liability side of the Federal Reserve balance sheet. The Federal Reserve liabilities comprise four primary components: currency in circulation, the Overnight Reverse Repurchase facility, commercial bank reserves, and the Treasury General Account. Because currency in circulation expands at a predictable structural rate dictated by commercial demand, and the ON RRP facility has contracted by 90.5% from its $2,553.7B peak in December 2022 to just $242.0B in September 2026, the mathematical relationship between the TGA and bank reserves has transformed into a near-perfect zero-sum equation.
When the Treasury Department rebuilds its cash buffer, bank reserves contract dollar-for-dollar unless offset by central bank asset expansion. Conversely, when the Treasury spends cash down to fund federal obligations, reserves are reinjected into commercial depository institutions. Historical tracking of daily Treasury statement releases illustrates the extreme volatility of this balance over recent funding cycles. Entering 2024, the TGA stood at $518B, fluctuating down to $460B in June 2024 before ending the calendar year at $550B. By mid-2025, balances settled around $500B before ascending to $616B in December 2025. In the current funding quarter, the Treasury accelerated cash preservation, holding $540B in August 2026 before surging to $895B following the September 15 tax influx.
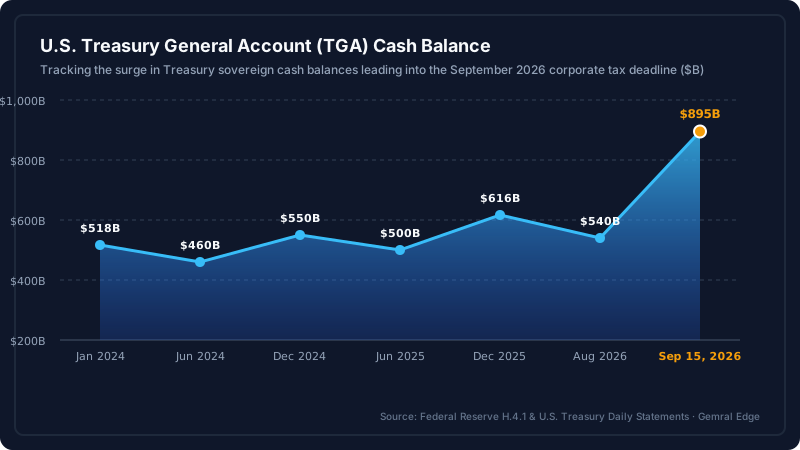
The operational rationale for maintaining a high TGA buffer centers on statutory debt ceiling risk mitigation and federal payment continuity. Treasury debt management guidelines specify that the department must maintain an operational cash balance sufficient to cover one week of peak outflows—typically calculated between $750B and $850B during heavy debt redemption cycles. However, holding $895B in sterile central bank deposits removes active liquidity from the commercial banking sector during a period when primary dealers must underwrite unprecedented volumes of new sovereign debt. This liquidity removal creates localized scarcity across the secured financing markets that underpin global derivative clearing, interbank lending, and foreign exchange hedging.
The consequence of this cash concentration is an acute drying up of wholesale market excess. When institutional money market participants analyze federal liquidity, headline metrics frequently obscure the underlying operational friction. A rising TGA balance is often misinterpreted by retail observers as fiscal strength; in institutional reality, it represents a synthetic drain equivalent to an emergency unannounced Quantitative Tightening operation. In the second half of 2026, the accumulation of $355B in net TGA funds over a compressed 45-day window has exerted quantifiable upward pressure on short-term rates, forcing money market fund managers and institutional treasurers to recalibrate portfolio durations.
| Reporting Date | TGA Cash Balance ($B) | Net Monthly Change ($B) | Commercial Bank Reserves ($B) | Net Reserve Impact |
|---|---|---|---|---|
| January 2024 | $518B | +$38B | $3,540B | Moderate Contraction |
| June 2024 | $460B | -$58B | $3,490B | Expansionary Influx |
| December 2024 | $550B | +$90B | $3,410B | Sterilization Pressure |
| June 2025 | $500B | -$50B | $3,416B | Neutral-Expansionary |
| December 2025 | $616B | +$116B | $3,320B | Contractionary Siphon |
| August 2026 | $540B | -$76B | $3,200B | Temporary Relief |
| September 15, 2026 | $895B | +$355B | $3,120B | Severe Liquidity Compression |
The September 15 Corporate Tax Siphon: Measuring the $138B Intra-Week Reserve Drain
Every quarter, corporate income tax deadlines generate predictable, high-amplitude shocks across domestic money markets. Under U.S. federal tax schedules, major corporations, financial institutions, and pass-through entities must transmit estimated corporate tax installments on March 15, June 15, September 15, and December 15. Among these dates, the third-quarter September settlement represents one of the largest corporate tax collection periods of the calendar year, reflecting corporate earnings reconciliations from the prior summer quarter.
A comparative longitudinal audit of quarterly tax settlement drains illustrates the expanding nominal magnitude of these episodes. In the first quarter of 2025, the corporate tax drain removed $84B in net liquidity from commercial bank balances. This expanded to $118B in Q2 2025, moderated to $95B in Q3 2025, and escalated throughout 2026. The March 2026 tax date drained $102B, followed by $125B in June 2026. The September 15, 2026 tax deadline generated an unprecedented intra-week liquidity extraction of $138B, driven by record nominal corporate tax withholdings and elevated corporate profitability across energy and technology sectors.
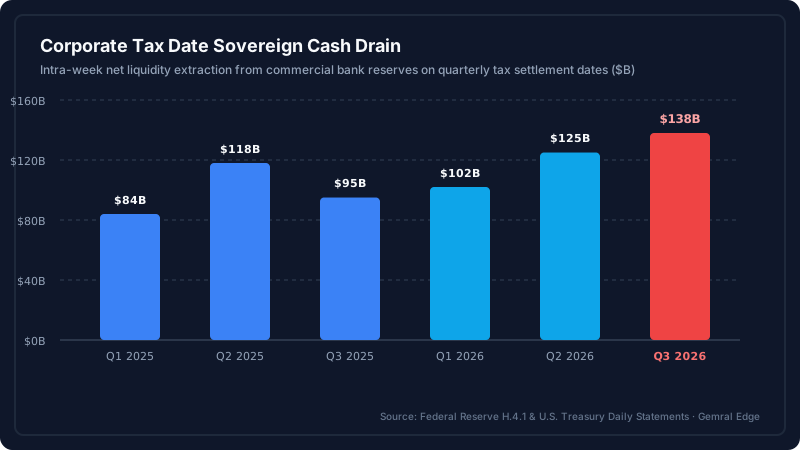
The speed at which this $138B extraction occurred amplified its systemic impact. Rather than dispersing across several settlement weeks, over 70% of total tax receipts cleared within an 72-hour operational window between September 14 and September 16. Corporate treasurers swept operating balances held at commercial banks—including major global systemically important banks (G-SIBs)—into Federal Reserve wire settlement rails. This instantaneous withdrawal stripped commercial banks of high-quality liquid assets (HQLA), forcing treasury desks to finance immediate intraday overdraft positions in the federal funds and repo markets.
Compounding this tax shock was the contemporaneous settlement of mid-month Treasury auctions. On September 15, the Treasury scheduled the physical settlement of its 3-year, 10-year, and 30-year bond reopening auctions, requiring primary dealers to fund an additional $92B in net newly settled debt simultaneously with corporate tax remittances. The confluence of these two cash-absorption engines created an intraday balance sheet bottleneck that overwhelmed private financing conduits, causing secured borrowing costs to detach from central bank target corridors.
Commercial Bank Reserve Compression: The Transition Below the LCLoR Threshold
The primary concern for central bank market supervisors and institutional liquidity managers is the rapid convergence of aggregate commercial bank reserves toward the Lowest Comfortable Level of Reserves (LCLoR). The LCLoR represents the structural tipping point below which banks cease to treat cash reserves as surplus liquidity, transitioning to defensive liquidity hoarding to satisfy internal stress metrics and regulatory mandates such as the Liquidity Coverage Ratio (LCR) and Resolution Liquidity Adequacy and Positioning (RLAP).
During the peak of central bank balance sheet expansion in late 2021, bank reserves comfortably exceeded $4,200B, creating an environment of super-abundant liquidity. As Quantitative Tightening progressed, reserves gradually declined: dropping to $3,450B in January 2025, $3,416B in June 2025, $3,320B in December 2025, and $3,260B in March 2026. Following continuous balance sheet runoff and the summer sovereign cash rebuilding, reserves contracted to $3,200B in July 2026 before plunging to $3,120B on September 15, 2026.
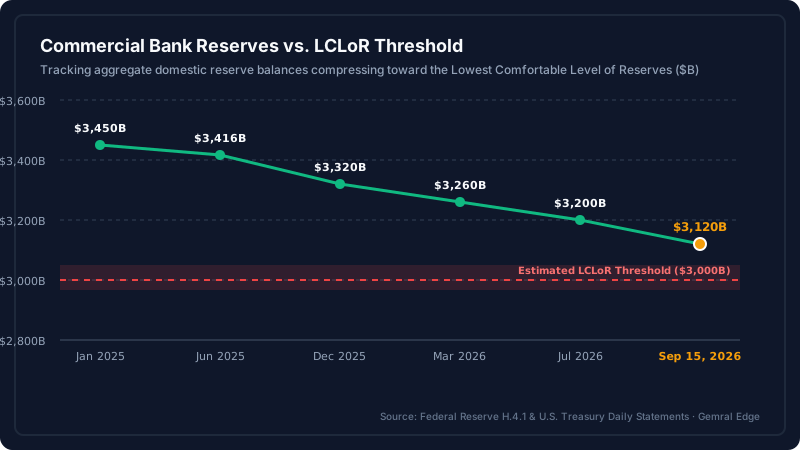
Federal Reserve research and primary dealer survey models estimate that the systemic LCLoR threshold for the domestic banking sector resides between $3,000B and $3,050B, or approximately 10.0% to 10.5% of nominal U.S. Gross Domestic Product. At $3,120B, the current cushion above absolute reserve scarcity has compressed to less than $120B. Because reserves are not distributed symmetrically across the banking system—with the top eight G-SIBs controlling over 65% of aggregate reserves—smaller regional and custodial banks have already breached their individual internal comfort thresholds.
When regional depository institutions experience reserve deficits, they cannot easily borrow unencumbered cash from money-center G-SIBs due to regulatory frictions. Under the Basel III framework, large banks incur severe balance sheet penalties for lending cash unsecured to peer institutions across quarter-end and month-end dates. Consequently, cash remains trapped within the fortress balance sheets of a handful of large institutions, while non-G-SIB banks, mortgage real estate investment trusts (REITs), and relative-value hedge funds are forced to pay steep premiums in the secured overnight repo market to secure essential operating funds.
Regulatory Liquidity Trap: The apparent existence of $3,120B in aggregate bank reserves masks profound structural maldistribution. With global systemically important institutions restricted by Supplementary Leverage Ratios (SLR) and Resolution Liquidity mandates, less than 15% of total bank cash is actively circulating across secondary wholesale funding channels, creating violent rate spikes during quarterly tax settlement cycles.
Sovereign Debt Issuance Dynamics: Net T-Bill Supply vs Coupon Issuance Load
The supply side of the liquidity dynamic is governed by the unprecedented pace of U.S. Treasury debt issuance. Confronted with an annual federal budget deficit exceeding $1.9T and ballooning sovereign interest expenses, the Treasury Department Office of Debt Management has operated at historically elevated auction sizes across the entire yield curve. In the six months spanning April through September 2026, the Treasury issued a combined total of $1,478B in net new marketable debt, placing unprecedented structural demands on private capital absorption.
Crucially, the composition of this issuance has shifted increasingly toward short-dated Treasury bills. In April 2026, net marketable issuance totaled $215B, split between $120B in bills and $95B in coupons. By May 2026, issuance expanded to $235B ($135B bills, $100B coupons), reaching $250B in June ($145B bills, $105B coupons), $265B in July ($160B bills, $105B coupons), $278B in August ($170B bills, $108B coupons), and culminating in $295B in September 2026 ($185B bills, $110B coupons).
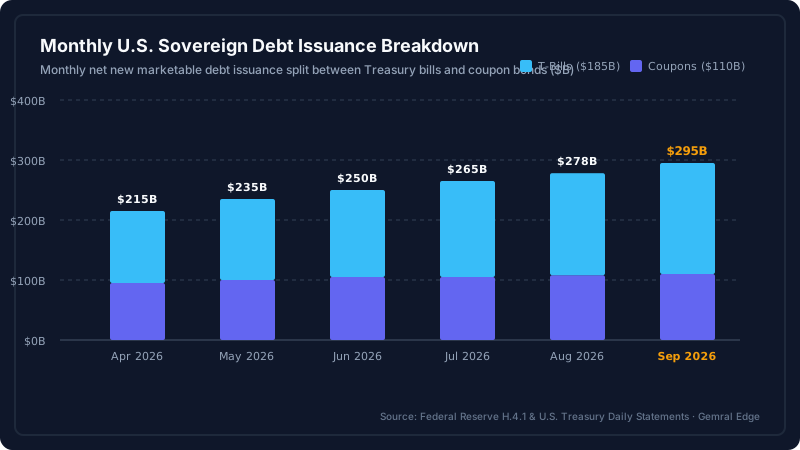
Treasury bills now comprise 23.4% of total outstanding marketable federal debt, substantially exceeding the 15% to 20% recommendation historically maintained by the Treasury Borrowing Advisory Committee (TBAC). While heavy bill issuance minimizes immediate long-term borrowing costs during periods of yield curve inversion or flat term premia, it creates an compounding structural roll-risk for the sovereign. Every week, the Treasury must refinance tens of billions of dollars in maturing short-term paper, turning the domestic money markets into an unrelenting refinancing treadmill.
During 2023 and 2024, money market mutual funds easily absorbed this deluge of bill issuance by reallocating cash out of the Federal Reserve ON RRP facility. However, with the ON RRP balance depleted to $242.0B, money market funds are operating with limited spare cash capacity. Over 80% of current MMF assets are already committed to existing short-term holdings, repos, and agency discount notes. As a result, newly auctioned Treasury bills must increasingly be absorbed by non-traditional buyers, corporate treasury accounts, and primary dealers, requiring dealers to dramatically increase their leverage to inventory the sovereign paper.
| Issuance Month | Net T-Bills Issued ($B) | Net Coupons Issued ($B) | Total Net Marketable ($B) | Bill Share of Issuance (%) |
|---|---|---|---|---|
| April 2026 | $120B | $95B | $215B | 55.8% |
| May 2026 | $135B | $100B | $235B | 57.4% |
| June 2026 | $145B | $105B | $250B | 58.0% |
| July 2026 | $160B | $105B | $265B | 60.4% |
| August 2026 | $170B | $108B | $278B | 61.2% |
| September 2026 | $185B | $110B | $295B | 62.7% |
Money Market Microstructure: SOFR Spikes, Tri-Party Dispersion, and EFFR Dislocation
The friction generated by the simultaneous corporate tax drain and sovereign debt issuance is directly observable in benchmark money market rates. In an environment of abundant liquidity, secured rates such as the Secured Overnight Financing Rate (SOFR) trade tightly below or inline with the unsecured Effective Federal Funds Rate (EFFR) and central bank policy benchmarks such as the Interest on Reserve Balances (IORB). However, as balance sheet space becomes constrained, secured borrowing rates detach upward, signaling an acute shortage of collateral financing capacity.
Tracing the spread between SOFR and EFFR reveals escalating volatility throughout the third quarter of 2026. On standard non-settlement trading days, the SOFR-EFFR spread maintained a docile baseline of +1.2 bps, occasionally compressing to +1.0 bps during mid-month liquidity troughs. However, on month-end settlement dates, spreads began widening sharply: reaching +3.0 bps at the end of July, moderating to +1.8 bps in mid-August, before expanding to +4.0 bps on the August 31 settlement date. On September 15, the spread exploded to an historic +8.8 bps, breaching primary dealer risk thresholds and signaling acute balance sheet strain.
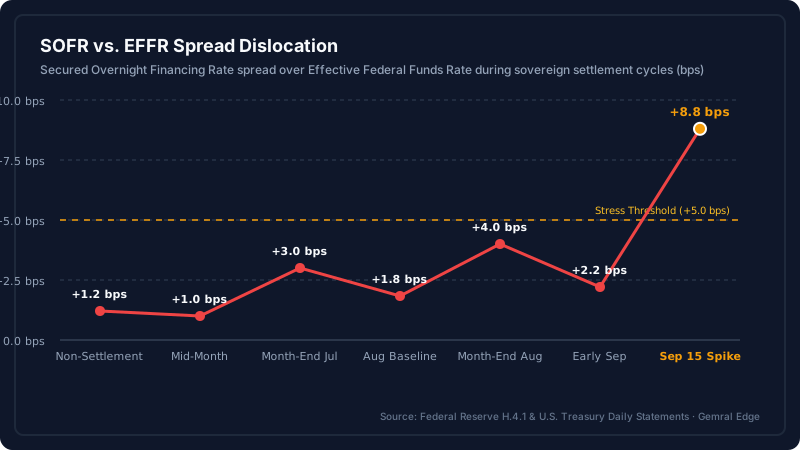
Microstructure analysis of the underlying transaction percentiles within the SOFR distribution reveals even more severe localized dislocations. While the volume-weighted median SOFR settled at +8.8 bps above EFFR, the 99th percentile of secured repo trades cleared at an astonishing +24.0 bps above the Fed's policy target rate. Relative-value basis traders, fixed-income arbitrage hedge funds, and independent broker-dealers holding leveraged Treasury collateral were forced to pay punishing overnight financing rates to roll their open positions.
This dispersion demonstrates that secured money markets are no longer clearing without disruption at the Federal Reserve policy rate. When collateral supply exceeds dealer financing capacity, repo markets cease to function as passive utilities and become rationing mechanisms. The dislocation between secured and unsecured benchmarks reflects a fundamental institutional reality: while commercial banks holding excess reserves could theoretically lend into the repo market to capture the attractive +8.8 bps yield spread, regulatory constraints, internal liquidity buffers, and balance sheet taxes prevent them from deploying that cash at scale.
Primary Dealer Balance Sheet Capacity: Repo Financing Costs and Inventory Saturation
Primary dealers serve as the legally mandated shock absorbers of the U.S. sovereign debt market. As designated counterparties to the Federal Reserve Bank of New York, the 24 primary dealer institutions are obligated to bid pro-rata at every federal debt auction, ensuring that the U.S. government can finance its operations under any market condition. When institutional end-investors hesitate to absorb newly issued debt, primary dealers must step into the breach, absorbing the unsold inventory onto their own balance sheets.
Federal Reserve FR2004 statistical releases reveal that aggregate primary dealer net marketable Treasury holdings have escalated to unprecedented levels. In the third quarter of 2024, dealer inventory averaged $230B, expanding to $245B in Q4 2024, $262B in Q1 2025, $282B in Q2 2025, and $305B in Q1 2026. By the third quarter of 2026, total dealer inventory reached an all-time record of $328B, representing an aggregate expansion of 42.6% over two years.
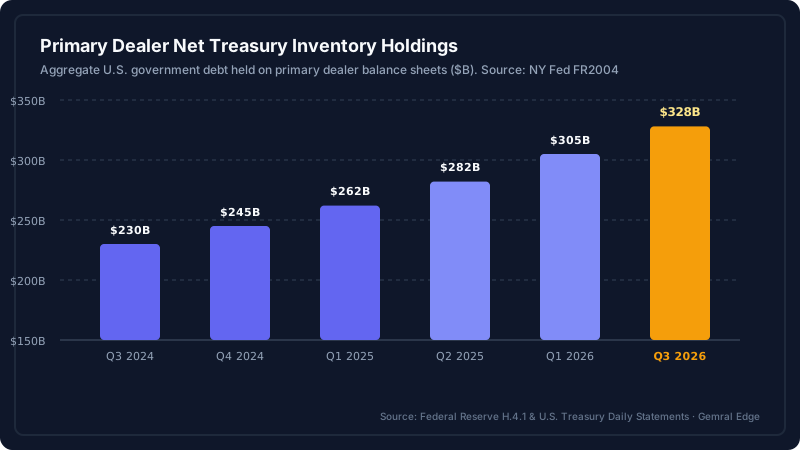
Holding $328B in Treasury collateral imposes severe thermodynamic costs on dealer balance sheets. Under the post-crisis regulatory regime, primary dealers affiliated with bank holding companies are subject to strict leverage caps, including the Supplementary Leverage Ratio (SLR), the Liquidity Coverage Ratio (LCR), and the Net Stable Funding Ratio (NSFR). Every dollar of Treasury collateral warehoused on balance sheet consumes leverage capacity, competing directly with market-making across corporate credit, equities, and derivative clearing.
To finance this ballooning $328B inventory, dealers rely heavily on overnight and term repurchase agreements, pledging the Treasury securities as collateral to obtain cash from institutional money market funds and cash-rich corporations. However, when corporate tax deadlines drain cash from money market funds and commercial banks simultaneously, the supply of available repo cash contracts precisely when dealer demand for financing reaches its zenith. This dynamic triggers an inevitable liquidity squeeze, forcing repo financing spreads wider and prompting dealers to pull back from secondary market intermediation.
The Fed's Liquidity Backstops: Standing Repo Facility (SRF) and FIMA Repo Operations
Recognizing the growing vulnerability of money markets following the traumatic repo spike of September 2019, the Federal Reserve established permanent liquidity backstops designed to cap overnight rate dislocations: the Standing Repo Facility (SRF) for domestic primary dealers and eligible banks, and the Foreign and International Monetary Authorities (FIMA) repo facility for foreign central banks.
Under standard operating conditions, the Standing Repo Facility records zero daily utilization. Because the SRF offers repo cash at the top of the Federal Reserve target range (currently set equal to the Interest on Reserve Balances plus a modest premium), market participants access the facility only when private secured rates trade at a measurable premium to policy rates. Throughout May, June, and July 2026, SRF take-up remained dormant at $0M during baseline trading sessions.

However, as liquidity conditions tightened during seasonal quarter-end turns, utilization began flickering. On the June 30 quarter-end turn, primary dealers tapped the facility for $1,850M. On August 31, utilization spiked to $4,200M. On the September 15 corporate tax and debt settlement date, facility take-up exploded to $14,200M—the highest single-day utilization recorded since the facility was established. Multiple primary dealers exhausted their private borrowing limits and accessed central bank cash to finance their warehoused Treasury paper.
While the activation of the SRF demonstrates that the central bank's ceiling tool functions mechanically as intended, its regular utilization signals that the private financial system has lost its ability to clear sovereign debt without official assistance. Simultaneously, the FIMA repo facility experienced heightened inquiries as foreign central banks sought dollar liquidity against their custodial Treasury holdings rather than selling Treasuries directly into an illiquid secondary market. When standing facilities transition from theoretical emergency valves to recurring operational necessities, it indicates that systemic liquidity has entered a fragile, non-linear regime.
| Date / Event | SRF Take-Up ($M) | Participating Counterparties | SOFR Spread to IORB (bps) | Facility Operational Status |
|---|---|---|---|---|
| May Baseline 2026 | $0M | 0 | -6.0 bps | Dormant / Abundant |
| June Baseline 2026 | $0M | 0 | -5.5 bps | Dormant / Abundant |
| June 30 Quarter-End | $1,850M | 4 | +2.5 bps | Initial Activation |
| July Baseline 2026 | $0M | 0 | -5.0 bps | Normalized |
| August 31 Settlement | $4,200M | 7 | +4.0 bps | Elevated Utilization |
| September 15 Tax Surge | $14,200M | 14 | +8.8 bps | Crisis Backstop Activation |
Macro Regime Horizon: Quantitative Tightening, Debt Ceiling Clocks, and Sovereign Cash Buffers
Looking beyond the immediate September tax settlement, institutional investors must analyze the medium-term macro trajectory of central bank balance sheet runoff and fiscal policy constraints. The Federal Reserve has conducted Quantitative Tightening continuously since June 2022, allowing up to $25B in U.S. Treasuries and $35B in agency mortgage-backed securities to mature off its balance sheet each month without reinvestment. From an all-time peak of $8.97T in May 2022, total System Open Market Account (SOMA) assets have contracted to $8.20T in December 2022, $7.70T in December 2023, $7.20T in December 2024, $6.80T in December 2025, and stand at $6.52T in September 2026.
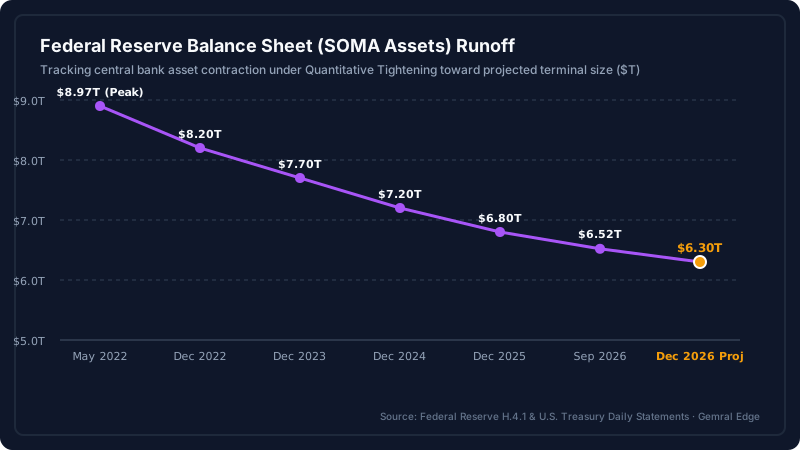
Under current central bank guidance, balance sheet runoff is projected to continue through late 2026, targeting a terminal asset portfolio size of approximately $6.30T. However, with the ON RRP facility exhausted at $242.0B and the TGA cash balance elevated at $895B, every subsequent dollar of QT will directly extinguish commercial bank reserves. If the Federal Reserve maintains its current $60B monthly aggregate runoff pace through year-end, bank reserves will contract by an additional $180B, dragging total reserves down to approximately $2,940B—decisively penetrating the $3,000B LCLoR comfort threshold.
This trajectory sets up an inevitable policy collision. Central bank leadership has repeatedly emphasized that Quantitative Tightening will be halted before bank reserves reach scarce levels to prevent a repetition of the September 2019 money market freeze. The sudden surge in SRF borrowing to $14,200M and the expansion of the SOFR-EFFR spread to +8.8 bps on September 15 provide definitive empirical proof that the threshold of reserve adequacy has already been reached in the real economy.
Compounding this monetary friction is the approaching statutory debt ceiling clock. Federal budget analysts project that the current debt limit suspension will expire on January 1, 2027, forcing the Treasury Department to deploy statutory accounting measures once again. Between now and year-end, the Treasury will seek to maintain an elevated TGA balance to ensure maximum operational runway, locking away between $800B and $900B in sterile central bank deposits. As a result, the domestic financial system faces a structural double-drain: relentless fiscal cash hoarding combined with automated central bank balance sheet runoff.
Strategic Verdict: The Transition from Liquidity Abundance to Collateral Friction
The empirical evidence across Treasury cash statements, Federal Reserve balance sheet aggregates, and money market rate dispersions points to an inescapable conclusion: the era of post-pandemic liquidity abundance is over. The multi-year buffer provided by the Federal Reserve Overnight Reverse Repurchase facility has vanished, leaving the domestic banking system and primary dealer community exposed to the full, unvarnished weight of sovereign deficit financing.
The events of September 15, 2026—characterized by an intra-week corporate tax drain of $138B, an aggregate TGA build to $895B, a reserve compression to $3,120B, a record dealer inventory of $328B, a SOFR dislocation of +8.8 bps, and emergency SRF borrowing of $14,200M—represent the opening chapter of a more volatile funding regime. For institutional treasurers, macro hedge funds, and fixed-income allocators, managing cash in this environment requires rigorous real-time monitoring of sovereign plumbing rather than reliance on lagging policy pronouncements.
Organizations that proactively recognize the shift from reserve abundance to collateral friction will maintain decisive operational advantages. As sovereign issuance surges past $295B monthly and central bank runoff tests systemic limits, the price of liquidity will continue to command a structural premium. The financial system has entered an operational regime where balance sheet space is the ultimate scarce commodity, and the Treasury General Account is the engine directing the flow of global capital.