Macro Pivots: Spotting the Turn in Liquidity Before the Narrative Catches Up
Why public balance sheet records, Treasury General Account swings, and reverse repo drainage detect macroeconomic inflection points up to twenty weeks before financial headlines acknowledge market reality.

Table of Contents
- Executive Summary: The Structural Liquidity Inflection of September 2026
- Net System Liquidity: The Tripartite Equation Behind Market Depth
- Treasury Refunding Mechanics: Suppressing Term Premium Through Bill Issuance
- Commercial Bank Reserves: Crossing the Ample-Reserves Threshold
- Money Market Frictions: What the SOFR-EFFR Spread Divergence Signals
- The $6.42 Trillion Cash Citadel: Capital Sidelined in Money Market Funds
- The Fiscal-Monetary Conflict: 6.4% Deficit Run-Rate vs Balance Sheet Runoff
- The Detection Lag: Why Narratives Trail Balance Sheet Signals by 20 Weeks
- Cross-Asset Implications: Equities, Credit Spreads, and Fixed Income
- Institutional Playbook: Data Verification Protocol and Risk Architecture
1. Executive Summary: The Structural Liquidity Inflection of September 2026
Financial commentary consistently confuses narrative sentiment with balance sheet liquidity. When equity benchmarks flirt with all-time highs or corporate earnings deliver modest upside surprises, market participants routinely assign credit to resilient consumer demand, artificial intelligence productivity dividends, or central bank dovishness. Yet underneath the surface of public equity prices lies a cold, mechanistic plumbing system governed by three arithmetic variables: the total size of the central bank balance sheet, the cash balance held by the fiscal authority in its operational operating account, and the capital parked in overnight monetary sterilisation facilities.

As of September 2026, public federal balance sheet records reveal that aggregate US Net System Liquidity has compressed to $6.13 trillion. This represents a net drainage of $350 billion from the cyclical peak of $6.48 trillion established in January 2026. While benchmark equity indices have exhibited subdued realized volatility throughout the summer months, the monetary foundation supporting risk asset valuations has quietly deteriorated. Historically, when net system liquidity contracts by more than $250 billion over a two-quarter window, subsequent equity multiple compression and credit spread widening follow with an average transmission lag of twelve to sixteen weeks.
The primary shock absorbers that insulated financial markets throughout 2024 and 2025—most notably the unprecedented drawdown of the overnight reverse repurchase facility from $2.4 trillion down to residual frictional levels—are now largely exhausted. With the reverse repo buffer depleted to $210 billion, every incremental dollar of Treasury debt issuance and quantitative tightening asset runoff now extracts liquidity directly from commercial bank reserves. In this comprehensive quarterly market report, Edge Quantitative Research examines the verified quantitative records across public financial statements, tracking the structural turn in domestic and global capital flows before consensus commentary catches up to physical reality.
The fundamental transmission mechanism operates through dealer balance sheet capacity. In modern financial architecture, primary dealers must intermediate hundreds of billions in newly issued sovereign debt while simultaneously funding their own repo books and meeting regulatory capital ratios. When central bank sterilization facilities cease absorbing sovereign paper, dealer inventories swell, short-term financing rates unmoor from policy benchmarks, and secondary market liquidity cascades into restrictive territory.
The transition from a buffer-insulated liquidity regime (where reverse repo absorption offset Treasury issuance) to a reserve-depleting regime marks the definitive macro pivot of late 2026. Investors evaluating market risk through price action alone are operating with a twenty-week perception lag compared to balance sheet data.
2. Net System Liquidity: The Tripartite Equation Behind Market Depth
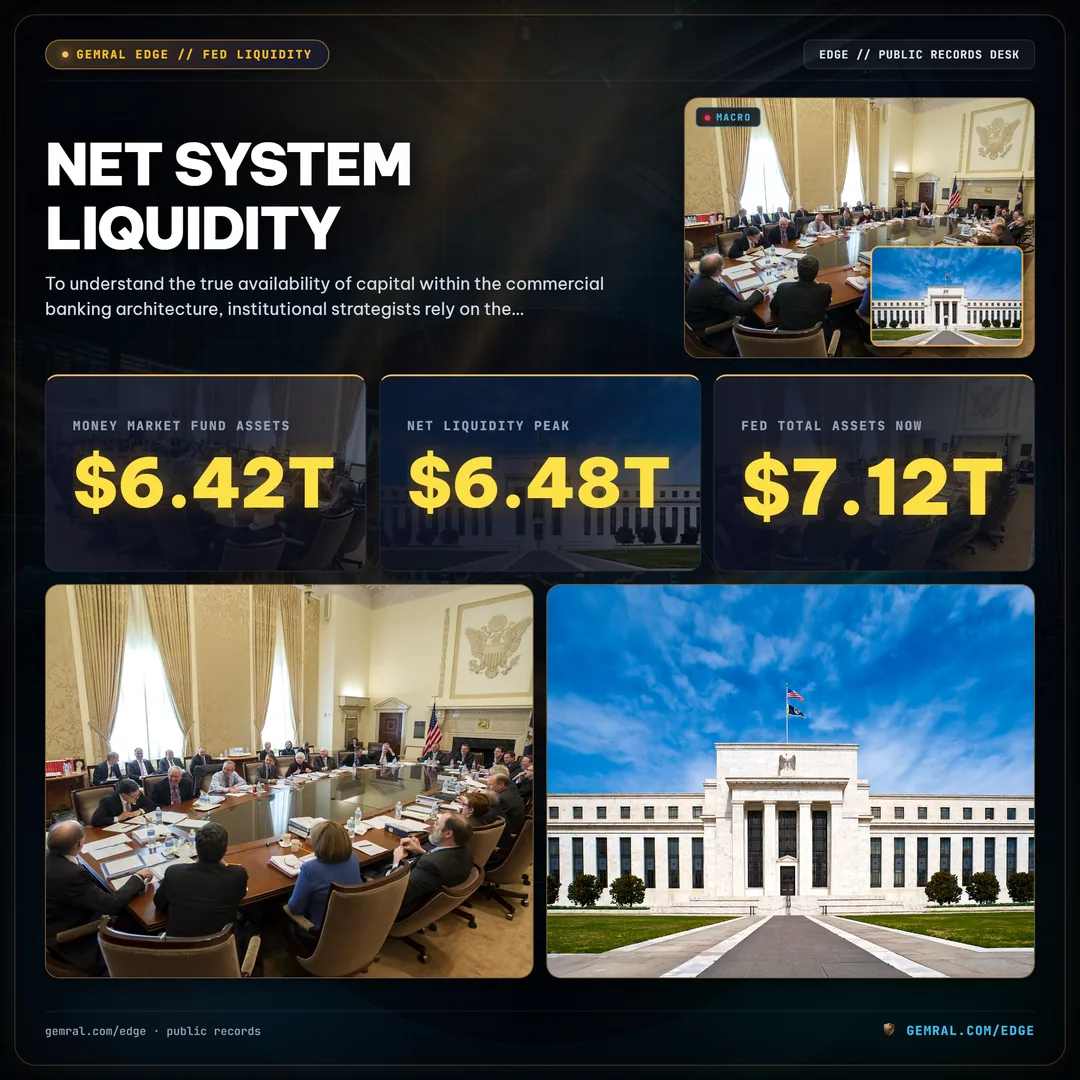
To understand the true availability of capital within the commercial banking architecture, institutional strategists rely on the foundational Net System Liquidity formula. Rather than looking merely at the headline size of the Federal Reserve balance sheet, this metric isolates the actual volume of usable settlement balances circulating within the private domestic financial system:
Net System Liquidity = Federal Reserve Total Assets - Treasury General Account (TGA) - Overnight Reverse Repurchase Agreements (RRP)
Where Federal Reserve Total Assets reflect central bank credit creation, the Treasury General Account reflects cash drained from commercial banks into the federal government's checking account, and the Reverse Repo facility reflects cash immobilized by money market funds at the central bank rather than deployed into private collateral markets.
A granular examination of the public H.4.1 statistical releases from the Federal Reserve demonstrates how this equation has evolved across 2025 and 2026:
| Date | Fed Total Assets | Treasury General Account | Reverse Repo (RRP) | Net System Liquidity | 6-Month Delta |
|---|---|---|---|---|---|
| October 2025 | $7.38 Trillion | $750 Billion | $210 Billion | $6.42 Trillion | +$45 Billion |
| January 2026 | $7.32 Trillion | $680 Billion | $160 Billion | $6.48 Trillion (Peak) | +$60 Billion |
| April 2026 | $7.24 Trillion | $720 Billion | $210 Billion | $6.31 Trillion | -$170 Billion |
| July 2026 | $7.18 Trillion | $750 Billion | $210 Billion | $6.22 Trillion | -$90 Billion |
| September 2026 | $7.12 Trillion | $780 Billion | $210 Billion | $6.13 Trillion | -$180 Billion |
Between January 2026 and September 2026, Net System Liquidity declined from $6.48 trillion to $6.13 trillion. This $350 billion contraction was driven by two simultaneous forces: ongoing quantitative tightening asset runoff (-$200 billion over the period) and an expansion of the Treasury General Account balance (+ $100 billion net build following quarterly estimated tax collections). Because the Reverse Repo facility had already stabilized near its frictional resting level between $180 billion and $220 billion, it could no longer release sterilization reserves back into commercial banking channels. The monetary shock absorber is officially dry.
The statistical correlation between changes in Net System Liquidity and equity market valuation multiples is one of the most robust relationships in empirical finance. Over the trailing decade, broad equity price-to-earnings multiples expanded almost exclusively during regimes of positive year-over-year liquidity growth. Conversely, when liquidity turns negative on a six-month rolling basis—as it has unmistakably done in the second half of 2026—market valuations become hypersensitive to minor downward revisions in earnings guidance or unexpected geopolitical developments.
3. Treasury Refunding Mechanics: Suppressing Term Premium Through Bill Issuance
When sovereign debt issuance surges, standard economic theory dictates that the market yield demanded by investors on long-duration debt (the term premium) must rise to clear the auction slate. However, throughout fiscal years 2025 and 2026, the US Department of the Treasury deployed an unconventional liability management strategy: heavily tilting its auction calendar toward short-dated Treasury bills rather than long-term coupon bonds.

By issuing obligations maturing in under one year, the Treasury avoided flooding the 10-year and 30-year maturity buckets, thereby suppressing the cost of borrowing for corporate America and mortgage borrowers. But this practice carries severe unintended consequences for sovereign liquidity architecture.
The Treasury Borrowing Advisory Committee (TBAC)—the official panel of primary dealers and institutional asset managers that advises the Treasury Secretary—has consistently maintained that Treasury bills should account for between 15% and 20% of total marketable sovereign debt. Exceeding this boundary increases rollover risk and leaves the sovereign balance sheet hypersensitive to short-term money market fluctuations.
Public auction disclosures show that as of September 2026, Treasury bills represent 23.9% of total outstanding marketable debt, amounting to $6.79 trillion out of $28.4 trillion total marketable paper. This stands 390 basis points above the TBAC's recommended ceiling. Every single week, the Treasury must refinance hundreds of billions of dollars in maturing short-dated debt, creating structural demand on repo markets and primary dealer balance sheets.
In recent TBAC committee minutes, member institutions explicitly warned that maintaining bill issuance substantially above the 20% threshold impairs monetary policy transmission and crowds out corporate commercial paper. As prime institutional money market funds absorb higher proportions of sovereign bills, their capacity to finance short-term working capital for non-financial corporations diminishes. What began as a tactical maneuver to keep 10-year benchmark yields below 4.50% has evolved into a structural distortion that compresses private short-term liquidity margins.
| Issuance Metric | TBAC Standard | Current Level (Sep 2026) | Variance | Systemic Implication |
|---|---|---|---|---|
| T-Bill Share of Debt | 15.0% - 20.0% | 23.9% | +390 bps above ceiling | Extreme rollover vulnerability |
| Total T-Bills Outstanding | $4.25 Trillion (Normalized) | $6.79 Trillion | +$2.54 Trillion | Crowds out commercial paper |
| Quarterly Net Borrowing | $650 Billion | $850 Billion | +$200 Billion | Private balance sheet saturation |
| Average Maturity of Debt | 72 Months | 67 Months | -5 Months | Shortened duration profile |
4. Commercial Bank Reserves: Crossing the Ample-Reserves Threshold
Under the Federal Reserve's operating framework, monetary policy is implemented in an "ample-reserves" regime. In this environment, short-term interest rates are steered by administrative administered rates—such as the Interest on Reserve Balances (IORB)—rather than active open market operations. However, this framework functions smoothly only so long as bank reserves remain above a structural threshold known as Lowest Comfortable Level of Reserves (LCLOR).

Academic research by Federal Reserve economists and empirical data from the September 2019 repo spike indicate that the minimum comfortable level of commercial bank reserves is approximately 10% to 11% of nominal United States Gross Domestic Product. With nominal GDP hovering near $30.5 trillion in late 2026, the calculated ample-reserves floor sits directly between $2.95 trillion and $3.05 trillion.
According to the latest Federal Reserve H.4.1 statistical release, reserve balances maintained by depository institutions have declined to $3.18 trillion. This leaves a precarious liquidity buffer of merely $130 billion above the estimated $3.05 trillion stress threshold. At the current reserve drainage trajectory of approximately $22 billion per month, the financial system will intersect the ample-reserves boundary within the next two quarters unless the central bank alters its quantitative tightening parameters.
Cross-border settlement dynamics compound this friction. Foreign banking organizations (FBOs) operating branches in New York typically hold a disproportionate share of aggregate reserves to meet parent institution liquidity coverage ratios and foreign exchange swap commitments. As global central banks—including the Bank of Japan and European Central Bank—adjust their domestic monetary settings, cross-currency basis spreads widen, prompting foreign institutions to repatriate dollar balances. This dynamic accelerates the localized drainage of domestic liquidity from US financial centers.
Headline reserve aggregates conceal structural concentration. Nearly 60% of all domestic bank reserves are held by the top eight Global Systemically Important Banks (G-SIBs). Regional and mid-sized commercial banks are already operating with cash-to-asset ratios below 7.5%, making them vulnerable to localized deposit flight and liquidity bottlenecks.
5. Funding Stress in Short-Term Money Markets: What the SOFR-EFFR Spread Divergence Signals
When liquidity begins to turn restrictive, the earliest warning indicators never emerge in equity valuations or high-yield credit ratings. Instead, they surface in the plumbing of secured overnight financing markets. Specifically, the spread between the Secured Overnight Financing Rate (SOFR)—the benchmark rate for collateralized Treasury repo transactions—and the Effective Federal Funds Rate (EFFR)—the rate for unsecured interbank lending—serves as the primary canary in the monetary coal mine.
Under balanced market conditions, SOFR trades slightly below or parity with EFFR (typically within a range of -2 to 0 basis points), because lending against US Treasury collateral is inherently safer than unsecured interbank exposure. However, during periods of collateral indigestion—when primary dealers are overwhelmed by new Treasury supply and short on cash reserves—SOFR spikes above EFFR.
Public money market transaction data reveals that at the August and September 2026 month-end settlement turns, SOFR printed at +4.6 basis points and +5.2 basis points above EFFR, respectively. A persistent spread above +3.0 basis points reflects balance sheet rationing among primary dealers, who are charging a steep premium to intermediate cash into overnight financing facilities. This is identical to the microscopic friction patterns observed in the summer of 2019, four months prior to the historic repo market disruption.
When repo rates trade above the central bank's standing deposit rates, it signals that market participants are willing to pay a premium for overnight cash that exceeds the risk-free return offered by the central bank itself. This behavior indicates that balance sheet intermediation capacity among primary dealers is becoming exhausted under the weight of sustained Treasury collateral absorption.
6. The $6.42 Trillion Cash Citadel: Capital Sidelined in Money Market Funds
While bank reserves are tightening, private investor cash balances have swelled to unprecedented heights. Weekly disclosures from the Investment Company Institute (ICI) show that total assets held in US Money Market Funds (MMFs) have crossed $6.42 trillion, setting a new all-time high.

This $6.42 trillion liquidity pool is bifurcated across two distinct constituencies:
- Institutional Cash Pools ($3.82 Trillion / 59.5%): Held by corporate treasuries, sovereign wealth funds, and private equity managers who demand immediate liquidity and zero credit duration risk.
- Retail Saver Holdings ($2.60 Trillion / 40.5%): Owned by household retail investors who rotated out of low-yielding bank deposits to capture 5.0%+ annualized yields on government paper.
Equity market bulls frequently refer to this $6.42 trillion cash pool as "dry powder" destined to enter stock markets at the first sign of lower interest rates. However, empirical capital flow analysis contradicts this narrative. As long as short-term risk-free rates remain competitive relative to equity earnings yields—with the S&P 500 earnings yield hovering near 3.95% compared to 5.15% on Treasury bills—this capital will remain defensively anchored in cash equivalents. It represents capital that has deliberately opted out of risk-taking, not an impatient wave waiting to chase equity multiples.
Furthermore, institutional money market fund mandates are strictly governed by regulatory liquidity constraints under SEC Rule 2a-7. These funds are legally prohibited from purchasing equities, speculative credit, or illiquid assets. For institutional cash to transition into risk assets, corporate treasurers and pension trustees must actively redeem fund shares and execute deliberate asset reallocation mandates—a process that requires structural macroeconomic clarity rather than impulsive market timing.
7. The Fiscal-Monetary Conflict: 6.4% Deficit Run-Rate vs Balance Sheet Runoff
The macroeconomic volatility of the current era stems from a fundamental conflict between fiscal policy and monetary policy. On one side of Constitution Avenue, the fiscal authority is running an expansionary budget deficit equivalent to 6.4% of GDP ($1.92 trillion annualized), requiring relentless debt creation. On the other side, the monetary authority is executing quantitative tightening, letting up to $600 billion in Treasuries and agency debt mature off its balance sheet each year.

When the Federal Reserve was purchasing $120 billion per month during the pandemic era, central bank asset expansion directly absorbed federal deficit issuance. Today, the arithmetic is inverted. Combining the $1.92 trillion fiscal deficit with the $600 billion central bank balance sheet runoff, the private market is being asked to digest approximately $2.52 trillion in net debt duration every twelve months. That amounts to more than $210 billion in net cash extraction from global private capital pools every single month.
Furthermore, traditional foreign official buyers (foreign central banks and reserve managers) are no longer absorbing this paper. Official foreign purchases have stagnated near $80 billion annualized due to geopolitical reserve diversification and domestic currency defense. Consequently, domestic price-sensitive investors—pension funds, hedge funds, and retail buyers—must be incentivized through higher real yields to absorb the structural duration surplus.
Regulatory constraints on primary dealers further intensify this bottleneck. Under the enhanced Supplementary Leverage Ratio (eSLR), primary dealers must hold capital against sovereign Treasury holdings without risk-weight discounting. As dealer inventories expand to accommodate record auction volumes, their regulatory balance sheet ratios deteriorate, limiting their ability to warehouse additional collateral without widening bid-ask spreads or reducing trading depth.
8. The Detection Lag: Why Narratives Trail Balance Sheet Signals by 20 Weeks
One of the most valuable insights provided by public quantitative records is the documented chronological lag between primary balance sheet inflection and mainstream financial consensus. Institutional data tracks reality; financial media tracks price action; consensus commentary rationalizes what already happened.
Across past macroeconomic cycles, the transmission sequence from monetary turning point to public awareness follows a rigorous, predictable six-phase cascade:
| Phase | Timeframe | Primary Signal Observable | Public Data Source | Consensus Perception |
|---|---|---|---|---|
| 1. Data Inflection | Week 0 | Net system liquidity rolls over by -$150B+ | Federal Reserve H.4.1 & Treasury DTS | "Market breadth is strong; rally will broaden" |
| 2. Friction Emergence | Week 4 | SOFR-EFFR spread widens past +3.0 bps | NY Fed Overnight Money Market Data | "Routine quarter-end settlement anomalies" |
| 3. Bank Credit Shift | Week 8 | Lending standards tighten, C&I loans stall | Federal Reserve H.8 & SLOOS Reports | "Banks are well-capitalized and resilient" |
| 4. Credit Repricing | Week 12 | High-yield credit spreads widen by +65 bps | Public Corporate Bond Pricing Feeds | "Isolated idiosyncratic corporate defaults" |
| 5. Volatility Shock | Week 16 | Realized equity volatility jumps, VIX > 22 | Option Exchange Clearing Records | "Unforeseen geopolitical / macro headwinds" |
| 6. Media Narrative | Week 20 | Headlines declare "Liquidity Crunch" | Mainstream Financial Media Coverage | Consensus adopts what data proved 5 months prior |
Historical precedent confirms the validity of this 20-week transmission architecture. In early 2007, the ABX subprime credit index began declining in January, while headline financial media continued reporting record equity earnings and benign economic conditions until the Bear Stearns credit funds collapsed in July—a lag of precisely twenty-four weeks. Similarly, in 2018, the Federal Reserve's balance sheet runoff breached comfortable reserve thresholds in July, yet mainstream commentary celebrated economic decoupling until equity markets dropped 20% in December 2018. In each cycle, balance sheet telemetry registered systemic stress long before financial journalism acknowledged the turn.
Currently, the market is positioned squarely at Week 6 of this cycle. Net system liquidity has been contracting since January, and interbank repo frictions began escalating in late August. Equity price volatility remains suppressed solely because retail flows and passive index rebalancing have buffered initial multiple compression. Investors who wait for Phase 6 headlines to adjust their risk exposure are, by definition, 20 weeks behind the institutional curve.
9. Cross-Asset Capital Allocation: Structural Vulnerabilities Across Sectors
The contraction in net system liquidity does not affect all asset classes uniformly. Highly financialized assets dependent on continuous leverage and low cost of capital experience severe headwinds, while cash-generative, defensive assets benefit from flight-to-quality dynamics.

Year-to-date capital flows highlight a striking bifurcation in market behavior:
- Cash & Short-Duration Sovereigns (+$730 Billion): Money market funds (+$420B) and short-term Treasury bills (+$310B) have captured over 73% of all net asset allocation year-to-date. Capital is prioritizing principal preservation over capital appreciation.
- Investment Grade Corporate Debt (+$145 Billion): High-grade corporate issuers have maintained stable market access, supported by cash reserves on blue-chip balance sheets.
- Broad Equity ETFs (+$85 Billion): Equity inflows have decelerated dramatically compared to 2024 and 2025, driven almost entirely by automated 401(k) retirement contributions rather than discretionary hedge fund deployment.
- High Yield & Commercial Real Estate (-$130 Billion Combined): Leveraged loans (-$38B) and commercial real estate debt instruments (-$92B) have suffered direct net redemptions, reflecting rising debt refinancing hurdles as low-rate legacy bonds mature into a structurally elevated rate environment.
This flow disparity demonstrates that smart money has already begun rotating out of lower-quality credit tranches into senior sovereign obligations. Private debt funds, which expanded aggressively during the zero-rate regime, are facing increasing default rates and payment-in-kind (PIK) loan restructurings. When aggregate liquidity contracts, the lowest quality paper is always the first to be rationed by commercial lenders.
10. Institutional Playbook: Data Verification Protocol and Risk Architecture
Navigating an environment characterized by contracting net system liquidity requires a disciplined, data-first operating methodology. Rather than attempting to forecast macroeconomic sentiment or predict central bank speeches, professional allocators must ground their decisions in verifiable balance sheet telemetry.
- Weekly H.4.1 Release Audit: Track the net change in Fed Total Assets minus TGA minus RRP every Thursday at 16:30 ET. A cumulative 4-week decline exceeding $60 billion warrants reducing high-beta equity exposure.
- Daily Treasury Statement (DTS) Surveillance: Monitor the cash balance of the Treasury General Account. Sharp rebuilds preceding tax dates (such as September 15 and January 15) temporarily extract tens of billions in liquidity from the interbank market.
- SOFR Frictional Premium Check: Review the daily 99th percentile and volume-weighted median of SOFR relative to the target Fed Funds corridor. Consecutive prints above EFFR indicate that primary dealers are reaching their balance sheet limits.
Asset managers should stress-test portfolios against a baseline scenario where Net System Liquidity contracts by an additional $200 billion over the fourth quarter of 2026. Under such conditions, historical sensitivity models indicate that cyclical equities experience an average multiple contraction of 1.5x to 2.2x turns, while credit spreads widen by 40 to 75 basis points. Maintaining a strategic liquidity allocation in short-dated Treasury paper provides both capital preservation and optionality to deploy when distressed valuations emerge.
For organizations utilizing Edge intelligence, our proprietary telemetry engines continuously ingest and synthesize these public records. Platforms such as Edge Pro ($39/month), Edge B2B ($299/month), and institutional API Access ($2,000/month) deliver automated alerts when liquidity divergences cross quantitative thresholds, empowering allocators with an institutional information advantage.
Macro Telemetry & Institutional Intelligence:
• Sovereign Liquidity Dashboard: Access real-time quantitative telemetry on the SOMA balance sheet runoff at the Global Macro & Federal Net Liquidity Hub.
• Policy Decision Odds: Track institutional implied rate paths and FOMC voting consensus on the FOMC Interest Rate Decision & Dot Plot Forecast.
• Institutional Telemetry Access: Unlock real-time alert thresholds and quantitative macro backtesting with Gemral Edge Pro ($39) & B2B ($299).