Reading Federal Liquidity as a Slow-Moving Backdrop to Capital Flows: Q3 2026 Sovereign Liquidity Report
In capital markets research, short-term price discovery frequently consumes outsized attention relative to its fundamental causal power. Market participants obsess over daily economic releases, corporate earnings announcements, and intraday sentiment indicators. Yet underlying these visible fluctuations operates a broader, slow-moving monetary current: United States sovereign net liquidity. Operating through the interplay of Federal Reserve asset balances, Treasury cash reserves, and money market facilities, federal liquidity creates the structural baseline upon which institutional capital allocations ultimately depend.
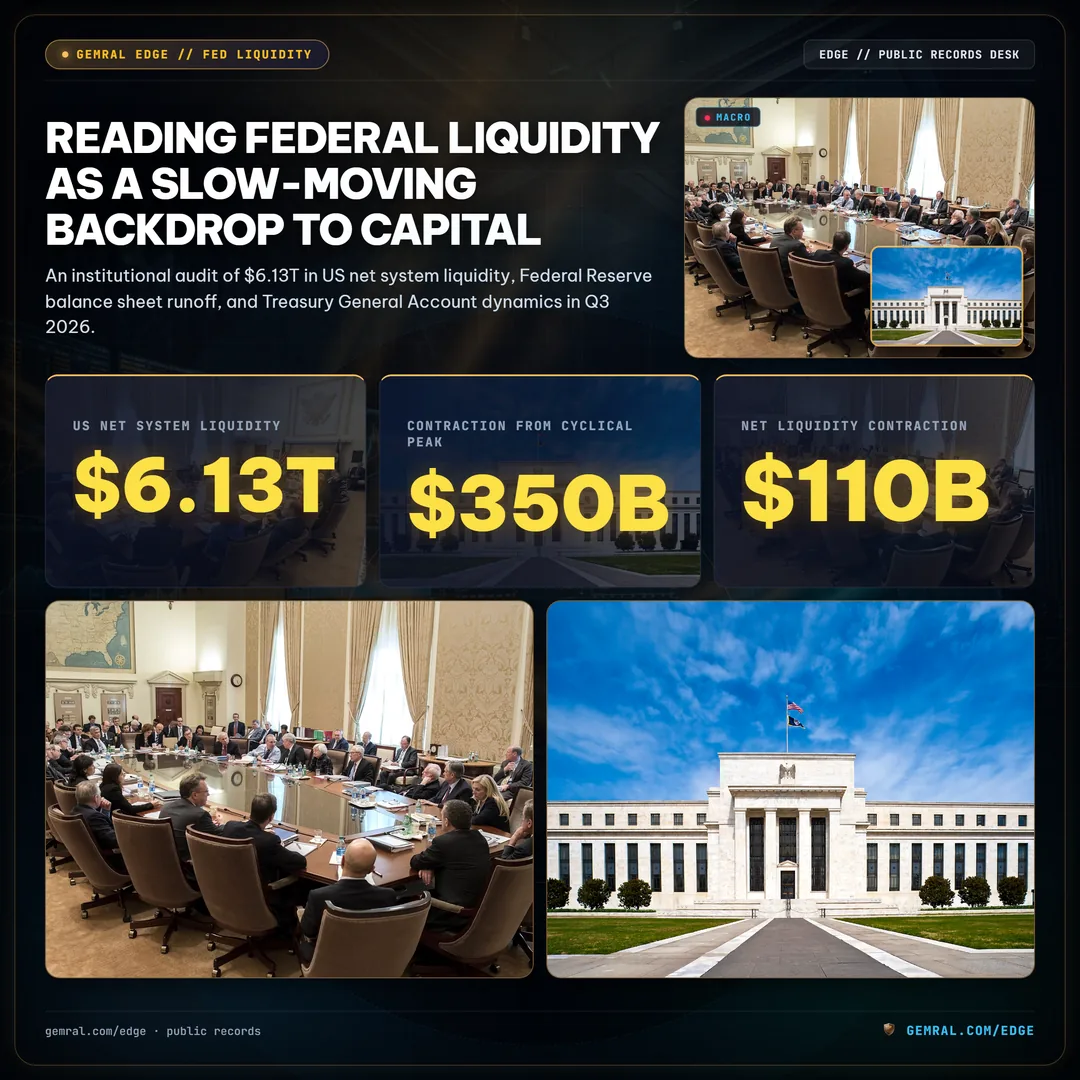
When evaluated as a macro backdrop rather than a short-term trading trigger, federal liquidity provides an explanatory framework for asset class valuations, credit spreads, and systemic funding stress. In the third quarter of fiscal year 2026, total net liquidity calculated as Federal Reserve total assets minus the Treasury General Account and the Overnight Reverse Repurchase Agreement facility measures $6.13 trillion. This represents a measured contraction of $350 billion from the cyclical peak of $6.48 trillion recorded in early 2026. This comprehensive quarterly report audits the balance sheet mechanics driving this shift, explores the structural friction emerging across money markets, and defines the multimonth transmission channels linking sovereign cash management to broad capital markets.
1. The Net System Liquidity Equation: Structural Foundations
The concept of net system liquidity moves beyond basic money supply metrics like M2 by isolating the specific central bank liabilities that directly support commercial banking reserves and private settlement liquidity. The operational formula is straightforward:
Each of the three variables in this equation represents an institutional balance sheet governed by distinct policy mandates and legal statutory frameworks. Federal Reserve total assets represent the primary asset side of the central bank ledger, dominated by the System Open Market Account (SOMA) portfolio of United States Treasury notes and agency mortgage-backed securities. Conversely, the Treasury General Account and the Overnight Reverse Repo facility represent liabilities on the central bank balance sheet that sterilize reserves away from commercial bank depository accounts.
When the Department of the Treasury collects federal taxes or issues new marketable debt to private investors, cash flows out of private commercial banking deposits into the Treasury General Account at the Federal Reserve. This operation reduces commercial bank reserves dollar-for-dollar, shrinking aggregate private liquidity. Conversely, when the federal government spends budgeted funds on defense contracts, infrastructure programs, or entitlement disbursements, funds transfer out of the TGA back into commercial bank reserve balances, expanding net liquidity.
Similarly, the Overnight Reverse Repo facility functions as a monetary sponge. When non-bank institutional lenders, primarily money market funds, deposit excess cash overnight at the central bank rather than purchasing Treasury bills or commercial repo, that capital is quarantined from circulating in the financial system. Therefore, an increase in either the TGA or RRP constitutes a drain on net liquidity, while their drawdown releases liquidity back into private markets.
| Balance Sheet Component | Q1 2025 Level | Q4 2025 Level | Q3 2026 Current | Net 18-Month Change |
|---|---|---|---|---|
| Federal Reserve Total Assets | $7.48 Trillion | $7.24 Trillion | $7.10 Trillion | -$380 Billion |
| Treasury General Account (TGA) | $720 Billion | $640 Billion | $775 Billion | +$55 Billion |
| Overnight Reverse Repo (RRP) | $520 Billion | $280 Billion | $195 Billion | -$325 Billion |
| Calculated Net Liquidity | $6.24 Trillion | $6.32 Trillion | $6.13 Trillion | -$110 Billion |
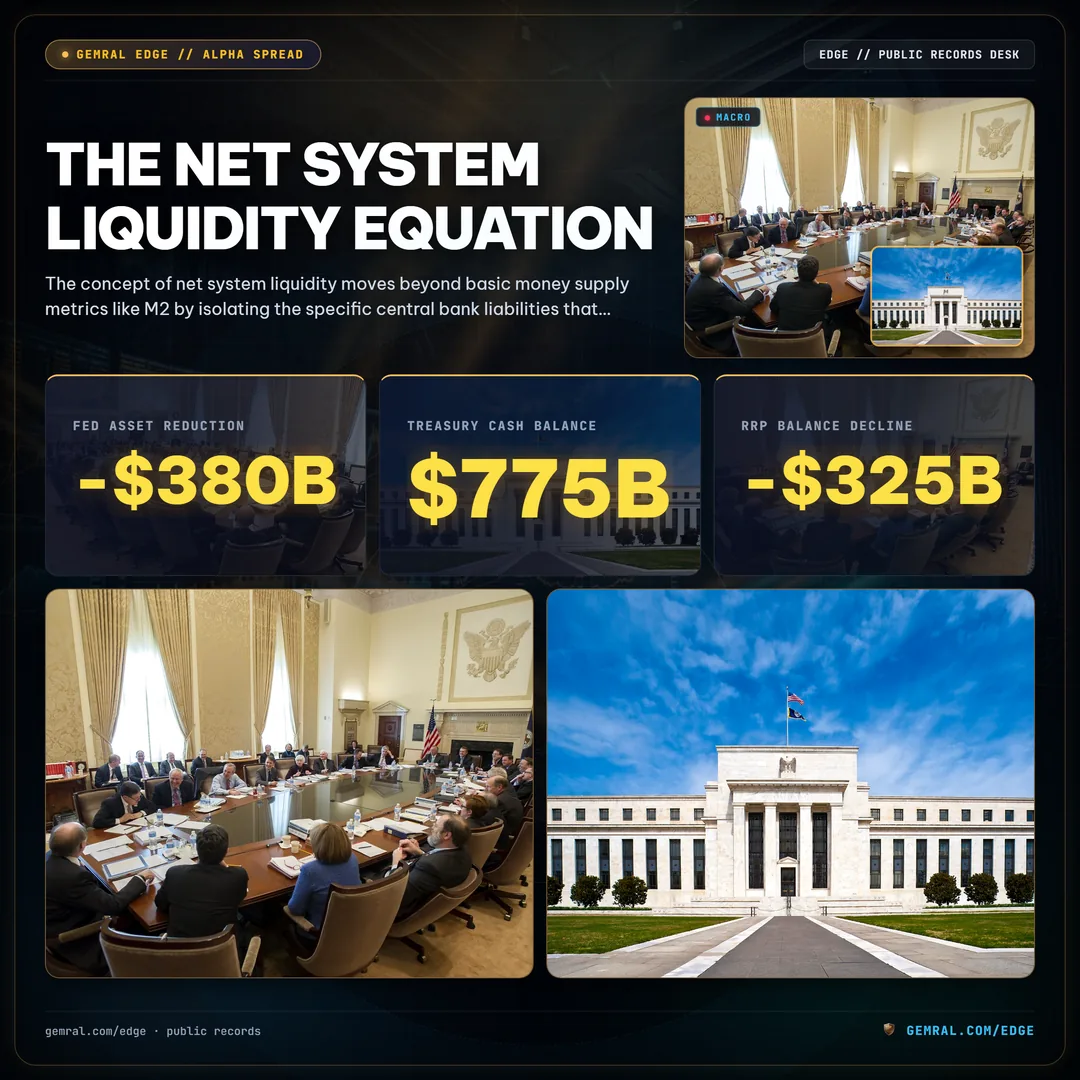
As documented in Table 1, the total net contraction of system liquidity over the past 18 months totaled $110 billion. While Federal Reserve assets decreased by $380 billion under ongoing quantitative tightening runoff, the parallel contraction of the RRP facility by $325 billion acted as a effective shock absorber, sterilizing more than 85% of the central bank balance sheet runoff. However, with the RRP facility now approaching an operational baseline floor of $195 billion, this offsetting dynamic is drawing to its structural conclusion.
2. Central Bank Asset Runoff: Pacing and Portfolio Runoff
The Federal Reserve's SOMA portfolio remains the foundational anchor of the asset side of the equation. Following the implementation of quantitative tightening beginning in 2022, the central bank permitted up to $60 billion in Treasury securities and $35 billion in agency mortgage-backed securities to mature each month without reinvestment. In mid-2024, the Federal Open Market Committee adjusted the monthly redemption cap for Treasury securities downward to $25 billion per month while leaving the agency debt cap unchanged at $35 billion.

Under these revised parameters, the annualized pace of central bank balance sheet contraction settled at approximately $300 billion per year, down from the peak pace of $720 billion per year observed during the initial phase of the tightening cycle. By September 2026, total central bank assets reached $7.10 trillion, compared to the pandemic-era peak of $8.96 trillion established in early 2022.
Because mortgage prepayments have remained subdued due to prevailing mortgage interest rates, agency debt runoff has consistently undershot the theoretical $35 billion monthly cap, averaging between $15 billion and $18 billion per month. Consequently, the primary burden of asset runoff has fallen on the Treasury component of the SOMA portfolio.
The persistence of central bank runoff removes sovereign debt duration from the Federal Reserve balance sheet and transfers it directly to the private primary dealer community and institutional investors. Unlike during quantitative easing, when the central bank absorbed long-dated duration risk, the ongoing runoff demands that private balance sheets absorb approximately $25 billion in net Treasury principal redemptions each month.
3. Treasury General Account (TGA) Dynamics: Cash Drains and Refills
The Treasury General Account maintained at the Federal Reserve Bank of New York serves as the operating checking account for the executive branch. The Treasury Department targets a prudent baseline cash balance designed to cover approximately one week of expected federal government outflows, alongside a precautionary liquidity buffer to absorb unexpected market dislocations or debt issuance disruptions.

In accordance with recommendations from the Treasury Borrowing Advisory Committee (TBAC), the Treasury has maintained a formal target balance of $750 billion for the TGA, with an operational buffer permitting fluctuations between $650 billion and $850 billion across quarterly financing cycles.
The TGA balance displays pronounced intra-quarter cyclicality governed by statutory corporate and individual tax remittance deadlines. As illustrated in Figure 2, during major tax settlement months, particularly April and September, federal tax receipts surge into the TGA, driving temporary spikes toward $890 billion. These surges drain private commercial bank reserves rapidly over a five-day to ten-day settlement window.
Conversely, during the intervening months of sustained fiscal disbursements, entitlement payments, military procurement vendor payouts, and net interest outlays, the Treasury disburses funds into the banking system at a monthly rate of $500 billion to $550 billion. When disbursements exceed concurrent tax collections and debt issuance proceeds, the TGA balance declines, temporarily replenishing private bank reserves.
As of September 2026, the TGA cash balance stood at $775 billion, slightly above the $750 billion policy benchmark. This positioning indicates that the Treasury's operating buffer remains well-capitalized, leaving the account balanced between fiscal reserve drain and replenishment.
4. Overnight Reverse Repo Depletion: The Buffer Exhaustion Point
Perhaps the most critical monetary development of the 2023 to 2026 period has been the progressive depletion of the Federal Reserve's Overnight Reverse Repurchase Agreement facility. Established as an administrative sub-floor under the federal funds target range, the RRP facility allowed eligible money market funds, government-sponsored enterprises, and primary dealers to place cash overnight at an administered yield.

At its historical crest in December 2022, the RRP facility absorbed $2.40 trillion in excess institutional cash. This unprecedented balance emerged because short-term Treasury bill yields traded below the RRP offering rate, incentivizing conservative money market fund managers to park surplus liquidity at the central bank rather than in marketable collateral.
Beginning in mid-2023, the Treasury Department deliberately restructured its financing strategy by expanding the supply of short-term Treasury bills. The resulting increase in bill yields pushed Treasury paper yields above the administered RRP rate. Money market funds responded by reallocating hundreds of billions of dollars out of the RRP facility into newly issued Treasury bills.
This reallocation mechanism proved highly consequential for system stability. As the Federal Reserve shrank its asset holdings by $1.86 trillion between 2022 and 2026, the concurrent $2.20 trillion reduction in the RRP facility absorbed the vast majority of the balance sheet drain. Instead of drawing down commercial bank reserves, the Treasury financed its fiscal deficits by pulling dormant cash out of the RRP facility.
However, as depicted in Figure 3, the RRP facility has contracted to $195 billion in September 2026. This represents a 91.8% depletion from its peak. Financial market institutions estimate that the operational friction floor for the RRP sits between $150 billion and $200 billion, representing structural liquidity held by non-bank participants that lack direct access to interest on reserve balances (IORB).
5. Commercial Bank Reserves: The Ample Reserves Boundary
Commercial bank deposits held at Federal Reserve Banks represent the ultimate settlement currency of the financial system. Under the Federal Reserve's "ample reserves" monetary policy implementation regime, the central bank maintains total reserve balances at a level sufficient to ensure that short-term interest rate control is achieved primarily through administered rates (IORB and the discount rate) without requiring active daily open market operations.

However, determining the precise dollar threshold that divides "ample" reserves from "scarce" reserves represents one of the most complex operational challenges in central banking. If aggregate reserves fall below the ample threshold, commercial banks transition from passive balance sheet allocators into aggressive bidders for overnight liquidity, causing money market interest rates to decouple from administered targets.
Empirical analyses conducted by Federal Reserve economists and primary dealer balance sheet strategists estimate the lowest comfortable level of reserves (LCLOR) at approximately 10% to 11% of nominal United States Gross Domestic Product. With annualized nominal GDP standing at approximately $30.5 trillion in 2026, the estimated ample reserves scarcity boundary resides at $3.05 trillion.
As illustrated in Figure 4, aggregate commercial bank reserve balances currently stand at $3.15 trillion. While this level remains nominally within the ample zone, the surplus buffer has compressed to approximately $100 billion. This compares to a peak reserve buffer of more than $1.20 trillion observed during the height of quantitative easing.
| Banking Sector Category | Reserve Allocation ($B) | Share of Total Reserves | Daily Payment Volatility | Estimated Liquidity Buffer |
|---|---|---|---|---|
| US Global Systemically Important Banks (G-SIBs) | $1,540 Billion | 48.9% | High ($450B daily) | +$60 Billion |
| Foreign Banking Organizations (FBOs) | $945 Billion | 30.0% | Moderate ($210B daily) | +$30 Billion |
| Large Domestic Regional Banks | $475 Billion | 15.1% | Moderate ($120B daily) | +$8 Billion |
| Small and Mid-Sized Community Banks | $190 Billion | 6.0% | Low ($35B daily) | +$2 Billion |
Furthermore, aggregate reserve totals mask considerable distributional asymmetry across the banking sector. As shown in Table 2, eight domestic Global Systemically Important Banks (G-SIBs) and large Foreign Banking Organizations control 78.9% of all central bank reserve deposits. In contrast, domestic regional banks, which carry substantial commercial real estate loan books and uninsured corporate deposits, hold just 15.1% ($475 billion) of total reserves.
Because regulatory liquidity requirements, such as the Liquidity Coverage Ratio (LCR) and internal stress testing frameworks, mandate that large banks maintain dedicated pools of high-quality liquid assets (HQLA) against unexpected intraday outflows, a substantial portion of the $3.15 trillion reserve total is functionally immobilized. Consequently, available "free" reserves capable of absorbing funding shocks across private repo markets are more constrained than headline totals suggest.
6. Sovereign Debt Composition: The Treasury Bill Allocation Dilemma
The structural trajectory of federal liquidity is inextricably intertwined with the issuance choices executed by the Department of the Treasury's Office of Debt Management. To finance a federal budget deficit tracking at $1.92 trillion annualized (representing approximately 6.3% of nominal GDP), the Treasury must issue immense volumes of marketable debt.
Historically, the Treasury Borrowing Advisory Committee (TBAC), an external panel of institutional investment managers and primary dealer executives, has recommended that short-term Treasury bills (maturities of one year or less) comprise between 15% and 20% of total marketable debt outstanding. This recommendation balances interest rate risk against market rollover vulnerability.
As charted in Figure 5, total marketable federal debt reached $28.50 trillion in the third quarter of 2026. Of this aggregate total, Treasury bills comprise $6.75 trillion, representing 23.7% of all marketable sovereign debt. This allocation exceeds the recommended 20% ceiling by 370 basis points, representing an over-allocation of approximately $1.05 trillion in ultra-short duration liabilities.
The Treasury's reliance on short-term bill issuance was deliberate: it allowed the government to fund $1.92 trillion in annualized fiscal deficits without flooding the intermediate (2-year to 10-year notes, $15.45 trillion) and long-term (20-year to 30-year bonds, $4.99 trillion) debt markets with duration supply that would have applied sharp upward pressure on long-dated benchmark yields.
However, this issuance strategy carries measurable structural consequences for system liquidity:
- Refinancing Compression: The entire $6.75 trillion stock of Treasury bills must be rolled over continuously every 4 to 52 weeks, requiring ongoing primary auction absorption from institutional cash pools.
- Collateral Displacements: Expanding the supply of short-term bills sopped up cash from money market funds that otherwise would have remained in the RRP facility.
- Fiscal Interest Volatility: Maintaining nearly a quarter of national sovereign debt in short-term maturities leaves federal net interest outlays acutely sensitive to the prevailing policy rate set by the central bank.
If the Treasury bows to TBAC guidance and gradually shifts its future issuance mix away from bills toward intermediate coupon notes, the primary funding burden will transfer from cash-rich money market funds to duration-sensitive commercial banks and asset managers, further tightening structural private liquidity.
7. Money Market Fund Reservoirs: Institutional vs Retail Allocations
While central bank balance sheet contraction and heavy sovereign debt issuance have exerted downward pressure on net liquidity, aggregate capital parked in domestic money market funds has reached all-time historical records. Data compiled across the investment company sector indicates that total money market fund assets under management stand at $6.45 trillion in September 2026.
This immense cash pool reflects the yield differential that opened between short-term money market instruments (yielding between 4.80% and 5.25%) and traditional commercial bank checking and savings deposits (averaging less than 0.60% nationally). Over a four-year cycle, corporate treasurers and retail depositors transferred more than $1.80 trillion from traditional bank accounts into money market structures.
As visualised in Figure 6, the composition of this $6.45 trillion reservoir is bifurcated between institutional vehicles and retail investor accounts:
Institutional Money Market Funds ($3.84 Trillion / 59.5%)
Institutional funds represent capital deployed by corporate balance sheets, state and municipal reserve pools, pension fund cash overlays, and hedge fund collateral managers. These vehicles are characterized by extreme yield sensitivity and professional credit risk management. Approximately 73% ($2.80 trillion) of institutional capital is invested in government and Treasury strategies, while 27% ($1.04 trillion) resides in prime strategies that absorb commercial paper and short-term bank debt. The weighted average maturity (WAM) of institutional holdings measures 36 days, allowing rapid portfolio adjustments in response to sovereign yield shifts.
Retail Money Market Funds ($2.61 Trillion / 40.5%)
Retail funds represent cash held by individual household investors and wealth management accounts. Historically, retail money market balances exhibit measurablely lower turnover and slower migration dynamics than institutional pools. Approximately 62% ($1.62 trillion) of retail assets are concentrated in government and agency paper, with 38% ($0.99 trillion) allocated to prime and tax-exempt municipal paper.
The existence of this $6.45 trillion pool of dry powder demonstrates that system-wide financial capital remains abundant in gross nominal terms. However, because this capital is legally segregated into regulated money market funds governed by SEC Rule 2a-7 restrictions, it cannot directly capitalize private equity markets, finance illiquid corporate credit, or backstop risk-asset expansions. It functions primarily as a buyer of short-term sovereign paper and an overnight cash provider to primary dealers.
8. Short-Term Money Market Friction: Reading the SOFR-EFFR Spreads
To detect whether aggregate federal liquidity is beginning to constrain private institutional financing, quantitative analysts monitor short-term interest rate spreads. The primary metric of friction in United States secured money markets is the relationship between the Secured Overnight Financing Rate (SOFR) and the Effective Federal Funds Rate (EFFR).

SOFR reflects the volume-weighted median rate of overnight borrowing collateralized by United States Treasury securities across broad tri-party and bilateral repo transactions, processing more than $1.80 trillion in daily volume. In contrast, EFFR reflects unsecured overnight borrowing among commercial banks, processing approximately $100 billion to $120 billion daily.
In a frictionless, liquidity-abundant monetary regime, secured borrowing costs trade consistently below unsecured borrowing costs, reflecting the collateral protection provided by Treasury paper. Historically, SOFR traded between 3 and 6 basis points below EFFR.
However, as documented in Figure 7, the spread dynamic has inverted during periods of balance sheet settlement pressure. Over the past four quarters, SOFR has periodically spiked above EFFR during month-end turns, quarterly corporate tax remittances, and major Treasury auction settlement dates. In late August and early September 2026, the SOFR-EFFR spread reached a positive premium of +5.2 basis points.
While a +5.2 basis point spread premium does not signal an acute systemic funding freeze comparable to the September 2019 repo dislocation (when overnight repo rates surged over 500 basis points above the target range), it provides clear empirical evidence that the primary dealer network is operating closer to balance sheet capacity limits than at any point since 2021.
9. The Macro Transmission Horizon: A 16-to-20 Week Lag Horizon
The foundational insight for market participants is understanding why federal liquidity functions as a slow-moving backdrop rather than an immediate trading trigger. The transmission of balance sheet shifts from the sovereign ledger to broad capital market valuations involves multiple intermediate stages, each operating on a distinct temporal schedule.
As visualised in the transmission framework of Figure 8, the impact of federal liquidity unfolds across four sequential phases:
Phase 1: Sovereign Balance Sheet Inflexion (Week 0 to Week 2)
The initial shift occurs strictly on public institutional ledgers: the Federal Reserve's H.4.1 release records SOMA asset reductions, the Treasury's Daily Statement shows TGA cash buildups from quarterly tax receipts, or the New York Fed's desk reports RRP contraction. At this stage, equity markets and corporate bond spreads exhibit zero observable reaction, as corporate cash flows and retail brokerages remain unaffected.
Phase 2: Money Market Balance Sheet Adjustments (Week 2 to Week 6)
As commercial bank reserve balances compress, primary dealers encounter higher capital charges to finance their inventory of sovereign debt. Spreads between SOFR and EFFR widen, Treasury bill auction bid-to-cover ratios experience subtle softening, and commercial paper rates for non-financial corporations edge higher. Funding desks and bank treasurers begin tightening interbank credit lines.
Phase 3: Credit Spreads and Bank Lending Conditions (Week 6 to Week 12)
Compressed bank reserves translate into tighter credit standards across private lending markets. In accordance with findings documented in the Federal Reserve's Senior Loan Officer Opinion Survey (SLOOS), commercial banks raise risk premiums on commercial and industrial (C&I) loans, trim warehouse lending lines to non-bank mortgage originators, and widen high-yield corporate bond spreads. Primary corporate debt issuance experiences pricing concessions.
Phase 4: Equity Multiple Re-Rating and Headline Consensus (Week 16 to Week 20)
Only after credit tightening and higher capital costs filter through corporate balance sheets do equity market valuations reflect the altered liquidity backdrop. Price-to-earnings (P/E) multiples compress, high-multiple growth equities experience valuation re-benchmarking, and financial media narratives begin attributing market softness to monetary conditions. By the time mainstream commentary identifies a "liquidity squeeze," the initiating sovereign balance sheet inflection occurred four to five months prior.
Analyzing liquidity as a slow-moving backdrop provides market participants with structural visibility across these multi-month lag horizons. It allows institutional analysts to evaluate whether broad market multiples are expanding into a rising or ebbing sovereign tide.
10. Structural Conclusions: The Sovereign Liquidity Horizon
Examining the structural data across the United States sovereign balance sheet in the third quarter of 2026 yields several core conclusions for macro capital market analysis:

- The End of the RRP Shock Absorber: The contraction of the Overnight Reverse Repo facility to $195 billion marks the structural exhaustion of the cash buffer that shielded bank reserves from quantitative tightening over the past two years. Going forward, balance sheet runoff and fiscal deficits will transmit directly to commercial bank reserve balances.
- Approaching the Ample Reserves Buffer: Aggregate bank reserves at $3.15 trillion sit approximately $100 billion above the estimated $3.05 trillion ample reserve floor. Because reserves are heavily concentrated among eight global systemically important institutions, the operational margin for error in private funding markets has narrowed.
- Debt Issuance Compositional Vulnerability: The Treasury Department's elevated reliance on short-term bills (23.7% of marketable debt, $6.75 trillion) creates continuous ongoing rollover requirements. Any policy shift to extend the average maturity of federal debt by increasing coupon issuance will absorb duration capital directly from institutional asset managers.
- A Slow-Moving Contextual Baseline: Federal net liquidity currently resting at $6.13 trillion represents a steady, disciplined monetary baseline rather than an acute liquidity crisis. It functions as a slow-moving tide: when the tide recedes slowly over several quarters, asset class multiples require higher underlying earnings yields to sustain valuations.
By tracking the quantitative interactions between central bank assets, Treasury cash accounts, and money market facilities, market participants gain objective clarity regarding the monetary currents shaping systemic capital flows, insulating their analytical process from short-term headline noise.
Systemic Liquidity & Policy Radars:
• Real-Time Central Bank Telemetry: Inspect live Fed net liquidity, TGA balances, and RRP drainage on the Global Macro & Fed Net Liquidity Radar.
• Capital Velocity Foresight: Monitor interbank liquidity transmission and demand forecasts on the Demand Foresight & Alpha Spread Radar.
• Inflation Horizon Forecasts: Track monthly inflation surprises and bond market pricing on the US CPI Inflation Event Horizon.
• Monetary Policy Forecasts: Track rate decision probabilities and dot plot projections on the Federal Reserve FOMC Rate Decision Consensus.