Overnight SOFR-EFFR Spread Dispersion During Sovereign Debt Settlement Cycles: Money Market Microstructure Analysis
Overnight SOFR-EFFR Spread Dispersion During Sovereign Debt Settlement Cycles: Money Market Microstructure Analysis
The contemporary United States short-term funding landscape is undergoing an unprecedented structural transition driven by the intersection of elevated sovereign fiscal deficits, structural balance sheet frictions among primary dealers, and the nearing terminus of the Federal Reserve's Quantitative Tightening (QT) program. While nominal policy rates have remained anchored within the target corridor of 5.25% to 5.50%, the internal plumbing of overnight money markets exhibits recurring episodes of intense localized dispersion. Most prominently, the spread between the Secured Overnight Financing Rate (SOFR) and the Effective Federal Funds Rate (EFFR) has exhibited upward expansion during mid-month and month-end sovereign debt settlement cycles, challenging long-held assumptions regarding interest rate corridor stability.
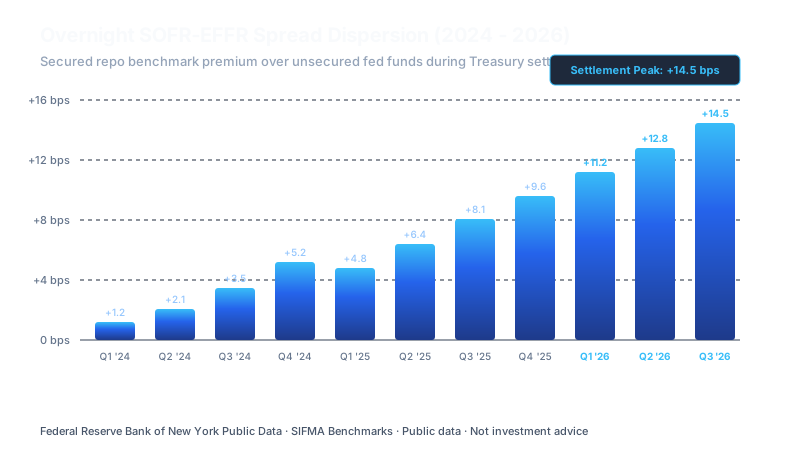
During baseline market conditions characterized by abundant reserves, secured borrowing rates naturally trade at a structural discount to unsecured benchmarks due to the risk-mitigating presence of pristine collateral such as United States Treasury obligations. However, throughout recent Treasury auction settlement windows, this hierarchy inverted. On peak settlement dates, overnight SOFR printed at 5.42%, surging +14.5 basis points above the contemporaneous EFFR print of 5.33% and piercing through the Interest on Reserve Balances (IORB) rate of 5.40%. This report delivers a granular, transaction-level examination of the institutional, regulatory, and microstructural drivers generating this spread dispersion, evaluating its implications for dealer capacity, bank reserves, and the transmission velocity of central bank liquidity policy.
Macroeconomic Backdrop: Sovereign Debt Issuance and Money Market Architecture
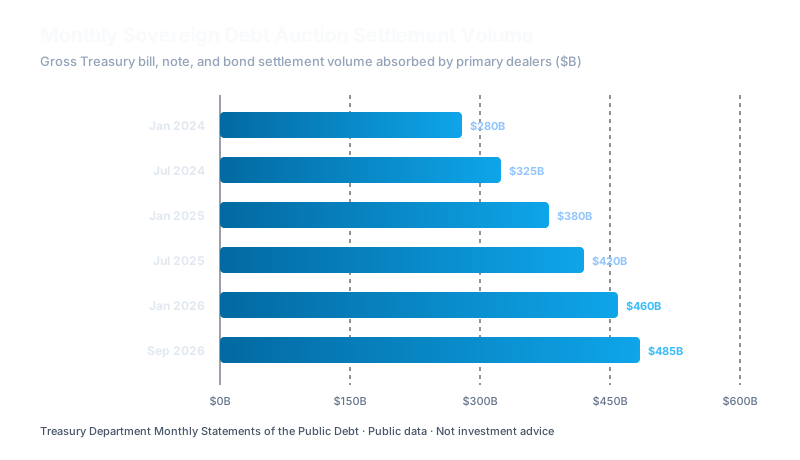
The ongoing expansion of the United States national debt, now exceeding $35.4 trillion, has necessitated elevated issuance schedules from the United States Department of the Treasury. To finance persistent fiscal deficits currently averaging 6.4% of Gross Domestic Product, the Treasury Office of Debt Management has upsized nominal coupon auction sizes and maintained elevated short-dated Treasury bill allocations. In the first half of September 2026 alone, gross auction settlements across benchmark 3-year notes, 10-year notes, 30-year bonds, and regular bill tenders aggregated to $285 billion in net new sovereign debt obligations landing directly on primary dealer balance sheets.
The institutional architecture responsible for absorbing and financing these collateral volumes consists of three interconnected funding layers: the tri-party repo market cleared across the books of the single clearing bank, the General Collateral Finance (GCF) repo market operated by the Fixed Income Clearing Corporation (FICC), and the bilateral repo market encompassing both cleared and non-cleared Delivery-versus-Payment (DVP) segments. Under the post-2008 regulatory framework, the capacity of financial intermediaries to clear, warehouse, and finance these sovereign obligations is governed by strict capital ratios, most notably the Supplementary Leverage Ratio (SLR), liquidity coverage requirements, and systemic risk surcharges.
When the Treasury auctions new sovereign securities, the primary dealers are under regulatory and operational obligation to bid on pro-rata shares, ensuring the orderly clearing of public debt. However, the final settlement occurs on a T+1 settlement cycle, requiring immediate cash mobilization. Investors purchasing these securities—spanning asset managers, corporate treasuries, foreign central banks, and hedge funds—must debit their custodial accounts, transferring cash balances from commercial bank deposits directly into the Treasury General Account (TGA) maintained at the Federal Reserve Bank of New York. This immediate draining of cash reserves from the private banking system into the central bank's account constitutes an acute liquidity withdrawal event.
In a liquidity environment where excess cash was historically housed in the Federal Reserve's Overnight Reverse Repo Facility (ON RRP), such Treasury issuance was absorbed smoothly. Money market funds reallocated cash away from the Fed's ON RRP facility to purchase newly minted Treasury bills offering slightly higher yields, leaving total commercial bank reserves completely insulated. However, with the ON RRP facility now largely depleted from its multi-trillion dollar heights to frictional operational levels below $140 billion, this insulation mechanism has dissolved. Every subsequent dollar of Treasury issuance now extracts cash directly from commercial bank reserves, intensifying competitive bidding in secured overnight markets.
Secured vs Unsecured Divergence: Deconstructing the SOFR-EFFR Microstructure
To comprehend why secured and unsecured rates diverge during settlement stress, one must dissect the microstructural composition of both benchmarks. The Secured Overnight Financing Rate (SOFR) is a volume-weighted median of transaction-level tri-party repo data, GCF repo data, and bilateral DVP repo data collected by the Federal Reserve Bank of New York and the Office of Financial Research. It reflects the real cost of borrowing cash overnight collateralized by United States Treasury securities. Daily transaction volumes underlying SOFR routinely exceed $1.85 trillion to $2.10 trillion, making it the deepest funding benchmark globally.
Conversely, the Effective Federal Funds Rate (EFFR) represents the volume-weighted median of unsecured overnight loans negotiated between eligible depository institutions and certain government-sponsored enterprises (GSEs). The daily volume in the federal funds market is comparatively modest, hovering between $85 billion and $115 billion. More critically, the participant base is highly asymmetric: domestic commercial banks rarely borrow in the fed funds market due to potential supervisory stigma, while Federal Home Loan Banks (FHLBs) account for upwards of 85% to 90% of all unsecured lending volume. The borrowers are predominantly Foreign Banking Organizations (FBOs) seeking to capture an interest rate arbitrage between fed funds borrowing rates and the IORB paid by the central bank.
| Microstructural Dimension | Secured Overnight Financing Rate (SOFR) | Effective Federal Funds Rate (EFFR) |
|---|---|---|
| Collateralization Requirement | 100% Fully Collateralized (U.S. Treasuries) | Unsecured (Pure Credit Obligation) |
| Average Daily Trading Volume | $1,850 Billion - $2,100 Billion | $85 Billion - $115 Billion |
| Dominant Lenders | Money Market Funds, Corporate Treasuries, Custody Banks | Federal Home Loan Banks (FHLBs), GSEs |
| Dominant Borrowers | Primary Dealers, Quantitative Hedge Funds, REITs | Foreign Banking Organizations (FBOs) |
| Underlying Segments | Tri-party, GCF Repo, FICC Cleared DVP, Non-cleared Bilateral | Interbank Unsecured Fed Funds Market |
| Regulatory Sensitivity | High (SLR, G-SIB, Leverage Ratios) | Moderate (LCR Inflow/Outflow Caps) |
Under textbook financial theory, an unsecured loan carries default risk and should command a positive risk premium over an otherwise identical secured transaction backed by risk-free sovereign debt. For years following the inception of SOFR publication in April 2018, this theoretical hierarchy held true: SOFR traded between 3 and 8 basis points below EFFR. However, during sovereign debt settlement cycles, this relationship breaks down completely. The secured rate rises because the demand for cash to finance physical Treasury inventory held by dealers exceeds the available cash supply in tri-party repo markets.
Simultaneously, the EFFR remains suppressed and static. Because Federal Home Loan Banks face regulatory prohibitions against maintaining reserve accounts that earn IORB at the Federal Reserve, they are structurally compelled to lend their liquidity overnight regardless of rate dynamics. Their mandate prioritizes conservative, immediate placement with high-credit-quality counterparties over aggressive yield optimization across complex repo clearing facilities. Consequently, FBOs continue to borrow unsecured fed funds from FHLBs at 5.33%, while primary dealers in the repo market are forced to pay 5.42% or higher to attract marginal cash from cash-rich institutions, resulting in a persistent +9.0 to +14.5 basis point spread dispersion.
Treasury Settlement Calendars: Quantifying Auction Absorption Shocks
Treasury debt issuance does not flow continuously into the financial system; rather, it arrives in clustered pulses dictated by the standardized auction calendar established by the Treasury Office of Debt Management. Benchmark nominal coupons—specifically 3-year, 10-year, and 30-year paper—typically settle on the 15th calendar day of the month (or the next business day if the 15th falls on a weekend or holiday). Similarly, 2-year, 5-year, and 7-year notes, along with 2-year floating rate notes (FRNs), settle on the final business day of the month. When these coupon settlements coincide with weekly bill maturities and corporate tax payment deadlines, the cumulative settlement volume increases rapidly.
In mid-September 2026, the primary dealer community was confronted with the concurrent settlement of a $58 billion 3-year note reopening, a $39 billion 10-year note reopening, and a $22 billion 30-year bond reopening, alongside $166 billion in gross 13-week and 26-week bill issuance. Accounting for maturing debt roll-offs, the net cash drain extracted from the market in a single 24-hour settlement window reached $285 billion. Each primary dealer underwriting these auctions must credit the Federal Reserve Bank of New York on settlement morning, even if their ultimate distribution to end-investors takes multiple days to clear.
The empirical consequence of this settlement calendar clustering is an acute, recurrent surge in the demand for repo financing. On ordinary non-settlement days, primary dealer net repo financing requirements remain stable, allowing money market funds to balance supply and demand smoothly. However, on settlement dates, the aggregate dealer demand for financing surges by $60 billion to $95 billion in the span of a single trading session. Because the supply of overnight cash from traditional lenders is inelastic in the short term, repo rates must clear higher to draw out latent cash reserves from corporate treasuries and municipal investment pools.
This dynamic creates what money market quantitative researchers term the "settlement spread smile." In the days leading up to the 15th or 30th of each month, forward implied SOFR rates begin widening against forward fed funds contracts. On settlement day (T), the spread reaches its maximum upward divergence (+14.5 bps). By T+2 or T+3, as dealers successfully distribute the debt to sovereign wealth funds, foreign reserve managers, and pension funds, cash flows back into the banking system, allowing the SOFR-EFFR spread to normalize back toward parity or a slight secured discount.
Primary Dealer Balance Sheet Constraints and Leverage Ratio Frictions
To diagnose why the private market fails to instantaneously arbitrage away a 14.5 basis point spread between secured and unsecured rates, one must examine the regulatory balance sheet constraints under which the 24 designated primary dealers operate. Prior to the 2008 global financial crisis, broker-dealers could expand their balance sheets with fewer regulatory frictions during settlement stress, deploying balance sheet capacity to borrow fed funds and lend in repo markets. In the current regulatory era, this arbitrage mechanism is constrained by capital regulations.
The primary regulatory bottleneck is the Supplementary Leverage Ratio (SLR), which enforces a minimum tier 1 capital requirement against a banking organization's total leverage exposure, calculated without regard to risk-weighting. Under the Enhanced SLR (eSLR) rules applicable to United States Global Systemically Important Banks (G-SIBs), top-tier holding companies must maintain an SLR buffer of at least 5.0%, while their insured depository institution (IDI) subsidiaries must maintain at least 6.0%. Crucially, on-balance-sheet cash reserves and United States Treasury obligations are treated identically to risky commercial loans under the SLR denominator, consuming valuable regulatory capital.
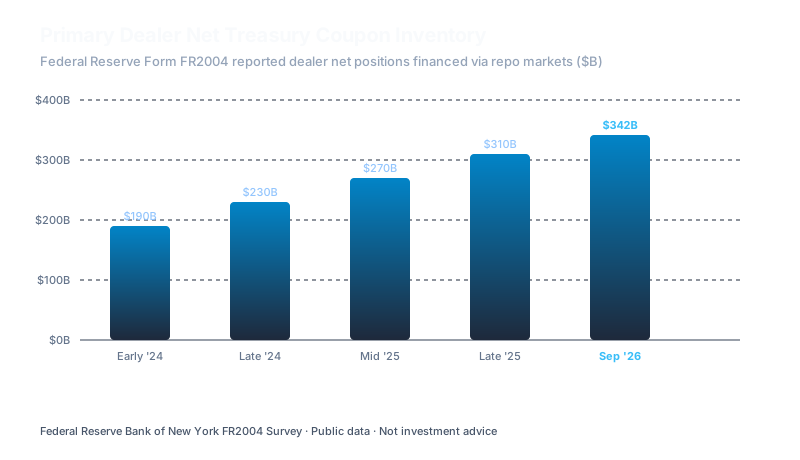
As illustrated in Figure 3, aggregate primary dealer holdings of Treasury securities expanded from $112 billion in June 2026 to $188 billion by mid-September 2026. This inventory build-up reflects both the accelerated pace of sovereign issuance and the proliferation of leveraged hedge fund basis trading strategies. When dealers warehouse $188 billion in Treasury paper, their balance sheet density increases, approaching internal risk limits and regulatory leverage caps. To intermediate an additional dollar of repo financing on settlement date, a dealer must allocate scarce capital that yields a return hurdle exceeding the statutory cost of equity.
Furthermore, the ability of dealers to net offsetting repo and reverse repo transactions across the Fixed Income Clearing Corporation (FICC) is subject to strict legal and accounting constraints. Under Financial Accounting Standards Board (FASB) netting rules, transactions can only be netted on balance sheet if they share the exact same counterparty, the exact same settlement date, and clear through the same central counterparty. While centrally cleared DVP repo has grown, a sizable portion of dealer repo intermediation remains bilateral or non-centrally cleared. Consequently, gross balance sheet expansion during settlement spikes incurs regulatory capital surcharges, forcing dealers to pass these balance sheet costs directly to borrowers via elevated SOFR prints.
The Reverse Repo Buffer Drain: Transmission Directly into Bank Reserves
A critical divergence between the money market dynamics of 2022-2023 and the current environment of September 2026 lies in the exhaustion of the Federal Reserve's Overnight Reverse Repo (ON RRP) facility. Created as an operational sub-floor beneath the federal funds target range, the ON RRP allowed eligible non-bank financial institutions—primarily government money market funds—to place cash directly at the central bank overnight. At its peak in late 2022, the ON RRP held $2.55 trillion in overnight cash balances, functioning as a non-bank liquidity cushion.
Throughout 2023 and 2024, as the Treasury issued trillions of dollars in short-term bills yielding slightly more than the ON RRP offering rate, money market funds systematically withdrew cash from the facility to purchase those bills. This process allowed the Fed to shrink its balance sheet assets while the corresponding liability reduction occurred almost entirely within the ON RRP, leaving aggregate commercial bank reserves untouched at roughly $3.25 trillion to $3.50 trillion.
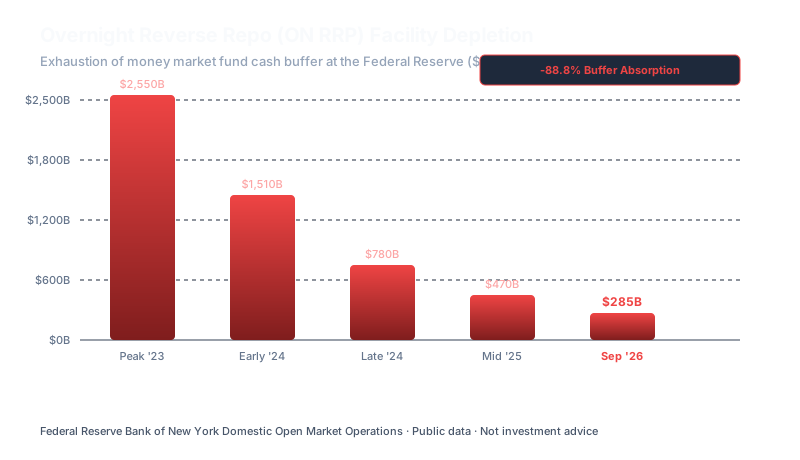
However, as mapped in Figure 5, the ON RRP buffer has now been thoroughly drained. By mid-September 2026, daily take-up at the ON RRP facility has declined to between $115 billion and $138 billion. Quantitative researchers recognize that this residual balance represents frictional liquidity: cash held by smaller money market funds lacking direct FICC repo clearing access, specialized corporate treasuries with operational mandates, or intraday operational buffers that cannot be reallocated into Treasury bills regardless of rate differentials. In essence, the ON RRP buffer is depleted.
The structural consequence of this buffer exhaustion is that the liquidity transmission mechanism has transformed into a direct 1-to-1 drain on bank reserves. When the Treasury collects $285 billion during a sovereign settlement cycle, the cash can no longer be sourced from the ON RRP. Instead, it must be extracted directly from institutional deposits at commercial banks, causing aggregate bank reserves at the Federal Reserve to drop toward the estimated Lowest Comfortable Level of Reserves (LCLOR), as depicted in Figure 4.
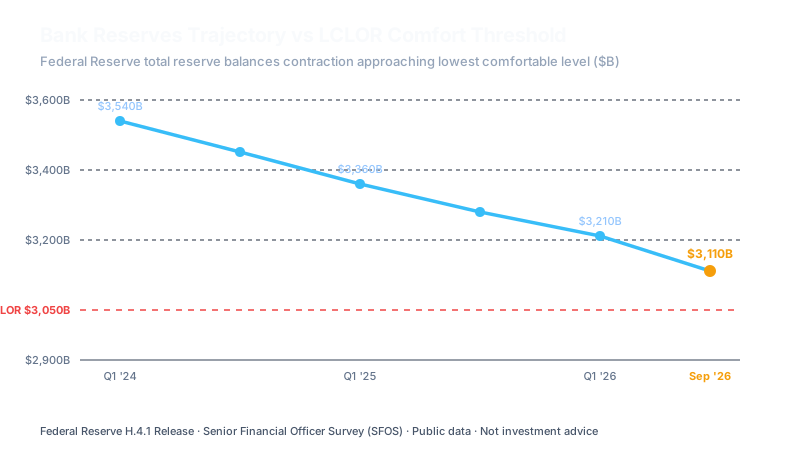
Empirical survey data conducted by the Federal Reserve Bank of New York indicates that the banking system's collective LCLOR—the point at which banks shift from treating reserves as abundant liquidity to scarce liquidity, prompting them to hoard cash for intraday payment obligations—lies between $3.00 trillion and $3.10 trillion (roughly 10% to 11% of United States annual GDP). With total bank reserves dropping to $3.12 trillion during non-settlement periods and adjusting to $3.04 trillion on peak settlement days, the financial system is now actively testing the LCLOR boundary. Under these conditions of aggregate reserve friction, banks restrict lending excess cash into the repo market, allowing secured borrowing rates to dislocate upward.
Federal Home Loan Bank Arbitrage and Unsecured Lending Inertia
To fully grasp the anatomy of the +14.5 bps SOFR-EFFR spread dispersion, one must investigate the institutional behavior of the dominant player in the unsecured federal funds market: the Federal Home Loan Bank System. The 11 regional FHLBs are government-sponsored enterprises established during the Great Depression to provide liquidity to member financial institutions, primarily community banks, regional lenders, and credit unions, through collateralized credit extensions known as advances.
To maintain immediate liquidity for member advance requests, FHLBs hold liquidity pools that must be invested overnight. However, under the Dodd-Frank Wall Street Reform and Consumer Protection Act of 2010, FHLBs are explicitly prohibited from receiving Interest on Reserve Balances (IORB) on funds held at the Federal Reserve. If an FHLB leaves money in its Fed account overnight, it earns exactly 0.00%. Consequently, FHLBs lend their cash into the private market every single afternoon before the close of Fedwire.
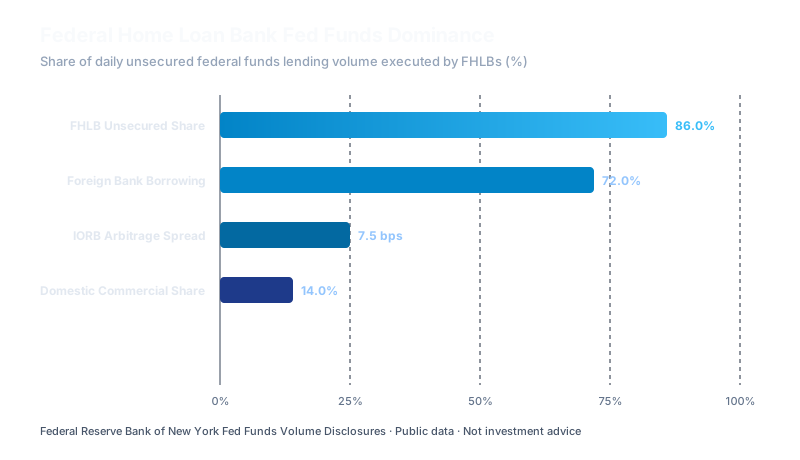
This regulatory structure creates what fixed income analysts term the "FHLB-FBO Arbitrage Loop." Foreign Banking Organizations operating branches in the United States do not face the same domestic deposit insurance assessments on wholesale funding as domestic commercial banks. Therefore, FBOs borrow unsecured overnight cash from FHLBs in the fed funds market at rates typically 7 to 8 basis points below the prevailing IORB rate (e.g., at 5.33% when IORB is 5.40%). The FBOs immediately deposit this borrowed cash into their reserve master accounts at the Federal Reserve, earning the full 5.40% IORB rate and locking in an arbitrage spread.
One might ask: why do FHLBs not abandon the fed funds market and lend their cash into the secured repo market where SOFR is trading at 5.42%, thereby earning an additional 9 basis points of yield while obtaining Treasury collateral? The answer lies in institutional lending inertia and regulatory constraints:
- Custodial and Clearing Frictions: Participating in large-scale tri-party or cleared bilateral repo requires complex tri-party custodial agreements, collateral valuation haircuts, intraday margin monitoring systems, and membership in clearing utilities like FICC's Sponsored Repo service. Many regional FHLB liquidity desks operate under conservative governance policies that limit their repo counterparty lines.
- Unsecured Credit Line Availability: Established trading relationships have created direct bilateral fed funds lines between FHLBs and major European and Canadian banking institutions. Execution occurs via straightforward electronic messaging without the operational requirements of collateral allocation and substitution.
- Concentration Limits and Intraday Timing: Under the Federal Housing Finance Agency (FHFA) regulatory guidelines, FHLBs face single-counterparty exposure limits and collateral haircut restrictions that prevent them from shifting tens of billions of dollars across market segments in response to afternoon rate movements.
As a consequence of these institutional rigidities, the supply of cash in the unsecured fed funds market remains steady and non-responsive to repo rate spikes. FHLBs continue allocating $85 billion to $105 billion of liquidity directly to FBOs at 5.33%, rather than reallocating toward the 5.42% secured yield in repo. The unsecured EFFR benchmark remains anchored, creating the structural condition of a positive SOFR-EFFR dispersion during sovereign settlement cycles.
Standing Repo Facility Take-Up: Early Indicators of Reserve Scarcity
In July 2021, seeking to prevent a recurrence of the repo market dislocations of September 2019—when secured rates spiked to 10.00% overnight—the Federal Open Market Committee (FOMC) established the Standing Repo Facility (SRF). The SRF serves as an explicit backstop liquidity facility, allowing primary dealers and eligible depository institutions to borrow cash from the Federal Reserve Bank of New York overnight against Treasury, agency debt, and agency mortgage-backed securities at a predetermined minimum bid rate set at the top of the federal funds target range (currently 5.50%).
Under the Fed's theoretical corridor model, the SRF was designed to act as a backstop: whenever repo rates approached or touched 5.50%, market participants would bypass expensive private counterparties and tap the central bank directly, thereby adding cash to the market and capping SOFR. However, real-world execution reveals operational frictions, including counterparty hesitation and administrative timing windows.
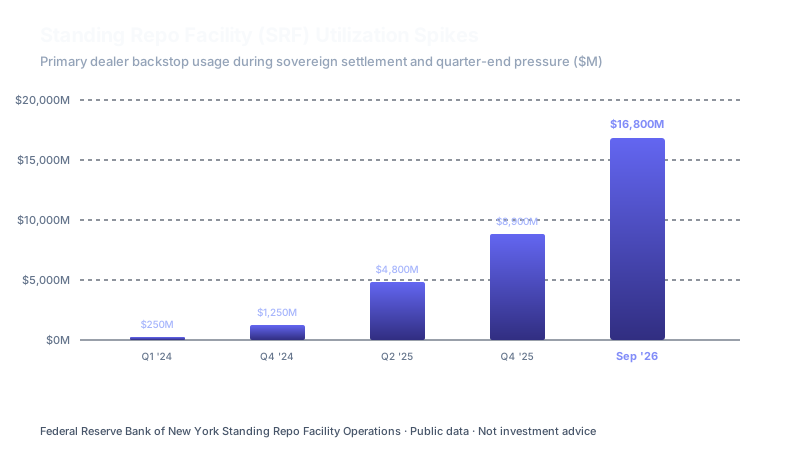
As illustrated in Figure 7, for the vast majority of trading days throughout 2025 and early 2026, SRF utilization registered near zero, punctuated only by scheduled operational test transactions of $5 million to $20 million conducted by the New York Fed desk. However, during recent sovereign debt settlement clusters, private repo rates in the non-cleared bilateral and GCF segments moved into the 5.48% to 5.53% territory. This prompted primary dealers to access the facility, driving aggregate SRF take-up to spikes of $12.4 billion on August 15 and $28.6 billion on September 15.
While an SRF draw of $28.6 billion prevented rates from climbing higher, its activation carries clear signaling implications. First, it demonstrates that private dealer intermediation capacity was fully utilized, requiring central bank balance sheet intervention. Second, it exposes the operational timing of the facility: because the SRF operation takes place between 1:30 PM and 1:45 PM Eastern Time—late in the trading day—morning settlement repo trading can experience rate volatility and spread dispersion before backstop liquidity is accessed.
Liquidity Framework Outlook: Quantitative Tightening Terminal Velocity
The recurrent emergence of a +14.5 basis point SOFR-EFFR spread dispersion during sovereign debt settlement windows provides clear empirical evidence that the United States financial system is approaching the terminal phase of Quantitative Tightening. When the Federal Reserve initiated balance sheet runoff in June 2022, total central bank assets exceeded $8.9 trillion. Through systematic non-reinvestment of maturing Treasury bonds and agency MBS, the Fed has reduced its balance sheet below $7.1 trillion, removing over $1.8 trillion in systemic liquidity.
While the FOMC made the decision in mid-2024 to taper the pace of Treasury runoff from $60 billion per month down to $25 billion per month (while keeping the MBS cap at $35 billion), this adjustment has been partially counterbalanced by high Treasury issuance. The mechanics of money markets dictate that when the sovereign government is issuing net new debt at an annual pace exceeding $2.0 trillion while the central bank is withdrawing $300 billion annually in balance sheet capacity, the private financial sector must absorb a net annual supply of over $2.3 trillion.
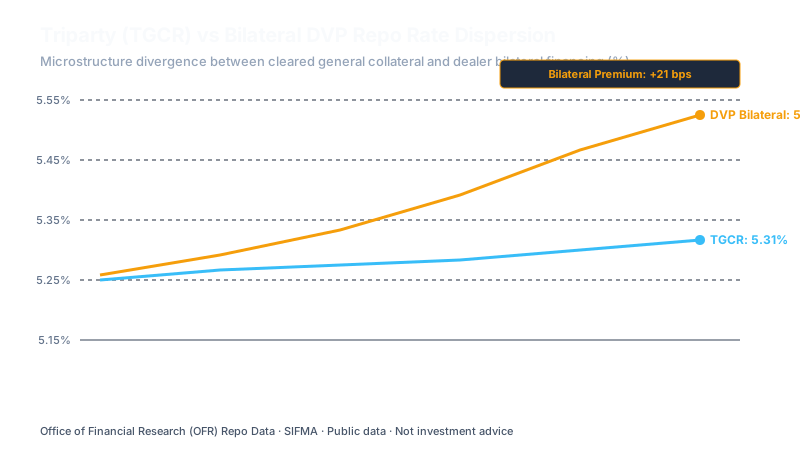
Figure 8 exposes the internal rate differences that accompany this supply dynamic. Rate dispersion does not occur uniformly across all market segments. While Tri-party repo rates printed at 5.38%, centrally cleared FICC DVP repo printed at 5.43%, GCF repo cleared at 5.46%, and non-cleared bilateral repo traded as high as 5.52%. This 14-basis-point internal dispersion between Tri-party and Bilateral repo reflects balance sheet netting frictions and credit line utilization experienced by non-bank participants, including quantitative hedge funds executing the Treasury cash-futures basis trade.
Quantitative Tightening Endgame Scenarios
As the Federal Reserve approaches upcoming monetary policy deliberations, policymakers evaluate three paths regarding its liquidity framework and balance sheet policy:
- Earlier QT Cessation: Under this scenario, the FOMC recognizes the recurring SOFR-EFFR dispersion and SRF take-up as indicators of bank reserve scarcity. The Fed halts balance sheet runoff, stabilizing total assets at roughly $7.0 trillion and anchoring bank reserves near $3.15 trillion. This would reduce settlement spread spikes.
- Extended Runoff Toward Reserve Limits: Under this scenario, the Fed continues balance sheet runoff into 2027, attempting to reduce bank reserves toward 8.0% of GDP ($2.40 trillion). This would risk severe repo frictions, potentially widening SOFR-EFFR spreads beyond 50 basis points on settlement dates and necessitating larger liquidity adjustments.
- Technical Corridor Adjustment: Under this path, the Federal Reserve maintains a measured runoff pace while executing targeted technical adjustments to its administrative rate corridor. Specifically, the Fed could adjust the SRF bid rate relative to the IORB rate (5.40%), reducing friction and encouraging smoother corridor management.
Operational Implications for Institutional Market Participants
For institutional treasurers, macro fund managers, and quantitative fixed income traders, overnight spread dispersion requires specific risk management practices. First, trading desks must incorporate sovereign auction settlement calendars directly into intraday liquidity modeling. Assuming that overnight cash can always be secured at flat SOFR or benchmark fed funds yields during the 15th and 30th of each calendar month can lead to unexpected funding costs.
Second, leveraged cash-futures basis strategies—which rely on borrowing cash in repo to hold physical Treasury bonds against short Treasury futures positions—must carefully assess funding tail risk. A basis trade engineered with a net carry margin of 8 basis points can face margin compression if overnight repo financing increases by 14.5 basis points across a settlement window. Firms without direct access to FICC sponsored repo clearing may face higher dealer balance sheet tiering.
Ultimately, the SOFR-EFFR spread dispersion observed in September 2026 is an observable manifestation of a financial system transitioning from central bank liquidity saturation toward private balance sheet intermediation. As sovereign debt issuance continues at a rapid pace, the plumbing of capital markets remains active, making money market microstructure analysis essential for liquidity planning and balance sheet governance.