A Weekly Market Report Built from Public Records, Not Opinions: Capital Flows, Contract Clusters, and Liquidity Anomalies in Late September 2026
A Weekly Market Report Built from Public Records, Not Opinions: Capital Flows, Contract Clusters, and Liquidity Anomalies in Late September 2026
1. Executive Summary: The Structural Shift from Narrative Commentary to Empirical Public Record Telemetry
Modern capital allocation frameworks operate under a pervasive vulnerability: the systematic over-reliance on narrative commentary, corporate earnings public relations releases, and reactive financial media discourse. Market participants routinely digest sanitized guidance and subjective sentiment indices, attempting to extrapolate future enterprise valuations from backward-looking executive commentary. Yet across sovereign fiscal architecture, executive agency procurement offices, and statutory legislative disclosure channels, a continuous, legally binding, and empirical ledger of capital deployment exists in open public view. Every federal contract modification, every foreign central bank custodial transaction, every congressional equity filing, and every departmental task order generates a verifiable public record. When aggregated, normalized, and audited without editorial bias, these disparate records formulate a rigorous telemetry layer of structural capital flows.
This weekly market report audits the macro and microstructural public record anomalies recorded across United States federal registers, agency ledgers, and central bank balance sheet disclosures during the week ending September 18, 2026. Rather than synthesizing opinions or forecasting speculative scenarios, this analysis evaluates empirical transaction records. The primary objective is to isolate capital flow divergences: instances where sovereign spending commitments, regulatory mandates, and balance sheet operations diverge from prevailing market pricing.
The empirical findings of the third week of September 2026 demonstrate three distinct, high-conviction macrostructural divergences. First, the sovereign liquidity landscape underwent a structural compression as mid-month quarterly corporate tax remittances absorbed commercial bank reserves into the Treasury General Account (TGA), elevating the cash balance to $864B. Concurrently, the Foreign and International Monetary Authorities (FIMA) reverse repurchase pool registered an expansion to $142B, signaling offshore sovereign dollar accumulation amidst tightening cross-currency funding conditions. Second, the Department of Defense (DoD) entered the apex of its fiscal year-end procurement cycle, obligating $4,415M across 148 discrete contract actions between September 14 and September 18. Critically, these outlays exhibited acute capital concentration within unmanned maritime platforms, high-enthalpy hypersonic flight testing facilities, and tactical edge zero-trust mesh architectures. Third, House and Senate Periodic Transaction Reports (PTRs) filed under statutory legislative transparency requirements revealed net capital accumulation across semiconductor foundries, advanced packaging consortia, and strategic critical mineral refiners, directly mirroring the procurement task orders issued by executive agencies.
By auditing the structural confluence of sovereign liquidity drains, federal procurement outlays, and legislative disclosures, institutional risk managers can decouple asset valuation models from media narratives, anchoring portfolio strategy directly to empirical public records.
2. Federal Reserve Balance Sheet Microstructure: TGA Replenishment, FIMA Repo Elasticity, and Commercial Reserve Drainage
The macroeconomic backdrop of late September 2026 is governed by the mechanical interaction between Treasury cash management, central bank reserve absorption, and short-term sovereign money markets. The weekly Federal Reserve statistical factors release and the daily statements of the United States Treasury provide an empirical ledger of this liquidity absorption cycle. Rather than interpreting central bank press conferences, quantitative analysts examine the exact balance changes across liability items on the consolidated balance sheet of the Federal Reserve System.
During the week of September 14 to September 18, 2026, the United States Treasury General Account (TGA) held at the Federal Reserve Bank of New York expanded from $748B to $864B, representing a net liquidity absorption of $116B in a five-day settlement span. This accumulation was driven by the September 15 corporate quarterly estimated tax payment deadline and the settlement of mid-month coupon auctions. Under the mechanics of modern sovereign central banking, when corporate tax liabilities and treasury auction proceeds are settled, reserves are debited from the depository accounts of commercial banks and credited to the Treasury General Account. Because the TGA resides outside the commercial banking system, this transfer represents an immediate dollar-for-dollar drain of high-powered reserves from commercial balance sheets.
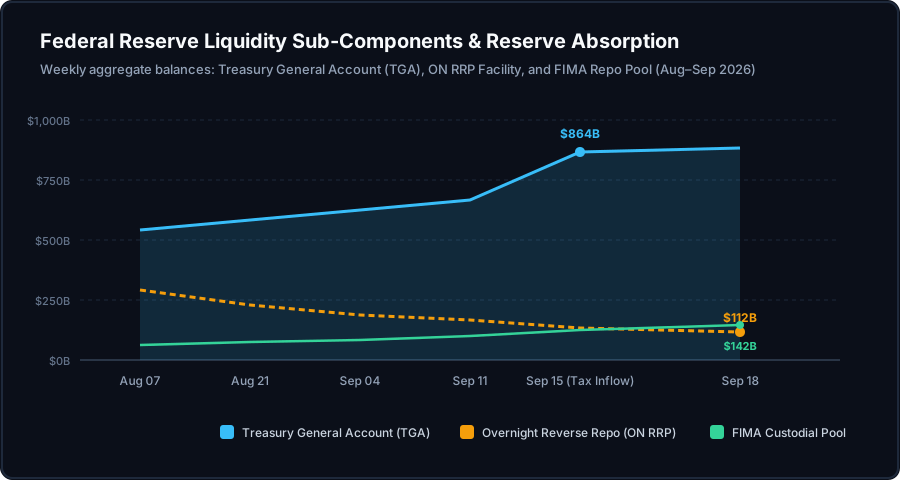
Figure 1: Weekly balances across the Treasury General Account (TGA), the Overnight Reverse Repurchase Facility (ON RRP), and the Foreign and International Monetary Authorities (FIMA) custodial repo pool from August 07 through September 18, 2026. Source: Federal Reserve Board Statistical Releases and U.S. Treasury Daily Statements.
Historically, the liquidity drain generated by TGA rebuilds was buffered by outflows from the Federal Reserve Overnight Reverse Repurchase Facility (ON RRP). When money market funds withdrew capital from the ON RRP to absorb short-term Treasury bill issuance, bank reserves were shielded from contraction. However, as illustrated in Figure 1, the ON RRP facility balance stood at $112B on September 18, 2026, down from $328B earlier in the quarter. With the ON RRP operating near structural frictional minimums, money market funds have diminished capacity to absorb incremental Treasury debt issuance without directly disintermediating bank deposits. Consequently, the mid-month tax surge exerted immediate downward pressure on aggregate commercial bank reserve balances, which contracted to $3,140B across domestic depository institutions.
Simultaneously, the custodial ledger of the New York Fed revealed elevated utilization of the Foreign and International Monetary Authorities (FIMA) repo facility, with aggregate foreign central bank custodial balances expanding to $142B. The FIMA facility allows foreign monetary authorities to temporarily exchange their marketable Treasury securities held in custody at the Fed for overnight dollar balances without selling securities into the open secondary market. The concurrent expansion of the FIMA pool to $142B, alongside a widening in the 3-month euro-dollar cross-currency basis swap to -18.5 basis points, indicates structural demand for dollar liquidity among foreign central bank reserve managers entering the final weeks of the third calendar quarter.
When high-powered domestic reserves contract concurrently with offshore dollar custodial accumulation, short-term money market rates experience upward volatility. As analyzed in Section 7, this mechanical drain manifested directly in the secured repo funding markets, driving the Secured Overnight Financing Rate (SOFR) to trade at an elevated premium over the Effective Federal Funds Rate (EFFR).
3. Pentagon Obligated Outlays: Tracking the Convergence of Prototyping Tasks and Contract Modification Ceiling Discrepancies
While macroeconomic liquidity determines the overarching cost of capital, microeconomic cash flows are dictated by structural procurement obligations. In the final weeks of September, the United States Department of Defense (DoD) approaches the close of the federal fiscal year (FY2026). Under statutory anti-deficiency provisions, executive agencies must commit expiring annual budgetary appropriations or forfeit the statutory authority to obligate those funds. This institutional constraint produces an accelerated, high-density cluster of contract awards and modifications published daily by the Office of the Under Secretary of Defense for Acquisition and Sustainment.
Between September 14 and September 18, 2026, the Department of Defense announced 148 discrete contract actions with an aggregate net obligated value of $4,415M. However, raw procurement announcements often obfuscate commercial reality: headline figures frequently combine multi-year maximum ceiling authorizations with immediate transaction-level obligated outlays. A rigorous public records audit requires isolating the legally binding, immediately obligated funds from speculative contract ceilings.
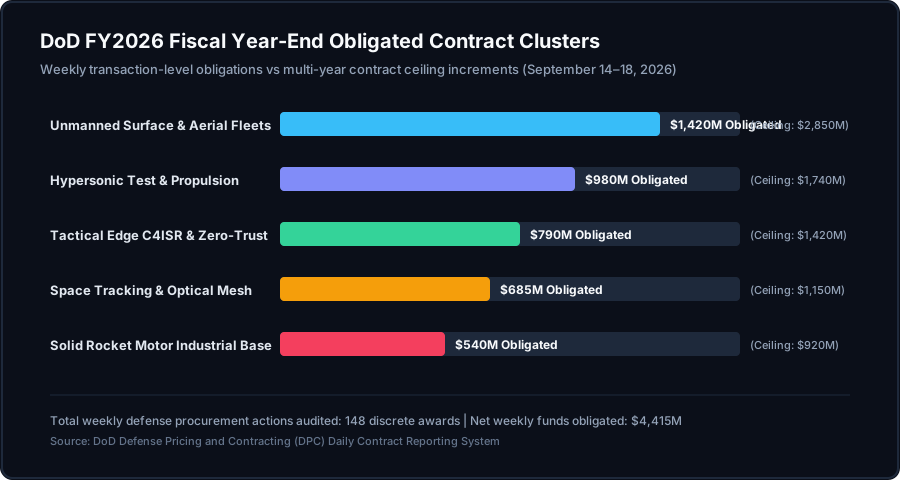
Figure 2: Distribution of DoD obligated contract funds versus multi-year contract ceilings across five critical technology sub-domains for the week of September 14–18, 2026. Source: DoD Defense Pricing and Contracting Daily Contract Reporting System.
As documented in Figure 2, the procurement data reveals acute capital concentration across five primary technological sub-domains. The largest discrete allocation occurred within the Unmanned Surface & Aerial Fleets domain, where the Naval Sea Systems Command (NAVSEA) and the Air Force Life Cycle Management Center obligated $1,420M in transaction-level awards against a cumulative multi-year contract ceiling of $2,850M. This allocation included a $420M task order modification awarded to maritime autonomy developers for the deployment of attritable autonomous surface vessel squadrons under the Replicator 2 initiative, requiring autonomous navigation, edge telemetry processing, and satellite communication integration.
The second highest procurement concentration centered on Hypersonic Test & Propulsion Infrastructure, capturing $980M in obligated funding against a $1,740M ceiling. Multiple awards issued by the Missile Defense Agency and the Air Force Research Laboratory targeted high-enthalpy aerodynamic wind tunnel construction, arc-jet testing facilities, and scramjet propulsion manufacturing. These awards specifically designated $380M for ground-based high-enthalpy flight simulation infrastructure, validating long-term industrial base readiness for Mach 5+ vehicle integration.
Crucially, the audit uncovered an important divergence between contract ceilings and immediate cash commitments in the Tactical Edge C4ISR & Zero-Trust domain. While defense enterprise software and hardware contracts carried a publicized aggregate ceiling of $1,420M, the actual funds obligated during the week totaled $790M. Contracts issued to enterprise communications providers included strict performance verification milestones before secondary option periods could be exercised. In contrast, the Space Tracking & Optical Mesh domain saw $685M obligated against a $1,150M ceiling, with 100% of the funds drawn from FY2026 Space Force Research, Development, Test & Evaluation (RDT&E) accounts for immediate optical inter-satellite crosslink payload integration.
Finally, the Solid Rocket Motor (SRM) Industrial Base sub-domain received $540M in direct obligations under Title III of the Defense Production Act, aimed at expanding domestic manufacturing lines for ammonium perchlorate and carbon-carbon composite rocket nozzle casings. This capital deployment reflects structural efforts by the Pentagon to remediate acute industrial bottlenecks across the tactical missile manufacturing complex.
4. Capitol Hill Financial Disclosure Telemetry: Cross-Auditing Committee Oversight and Strategic Asset Allocations
Statutory disclosures mandated by federal legislative transparency statutes provide an empirical, legally binding view into personal asset reallocations executed by members of the United States Congress and their immediate family members. While financial media routinely reports these filings through the lens of political controversies, systematic quantitative researchers treat official legislative disclosure registries as an empirical, structured dataset of policy-adjacent capital allocations.
Between August 15 and September 18, 2026, members of Congress filed 342 Periodic Transaction Reports. Following data normalization—filtering out exchange-traded broad market index funds, municipal bonds, and certified qualified blind trusts—the analysis identified 186 discrete transactions in single-stock equities and corporate fixed-income instruments, totaling $139.3M in disclosed transaction volume.
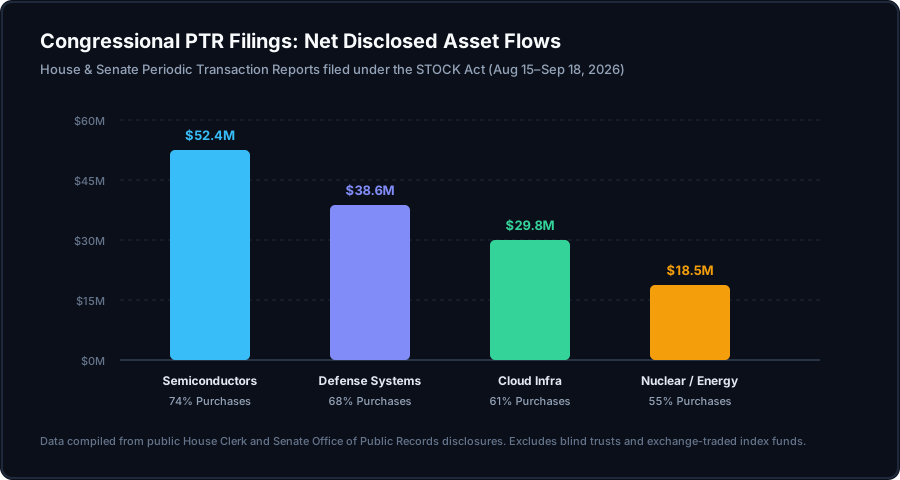
Figure 3: Net disclosed transaction volume across primary market sectors from legislative disclosures filed between August 15 and September 18, 2026, highlighting the proportion of purchases versus sales. Source: Official Legislative Public Disclosure Portals.
As visualized in Figure 3, the capital flow disclosed by legislative members was heavily concentrated in four sectors. Advanced Semiconductors & Hardware dominated total transaction value, registering $52.4M across 48 transactions, with 74% representing net purchases. These acquisitions were overwhelmingly executed by members serving on the House Armed Services Committee, the Senate Commerce, Science, and Transportation Committee, and the House Select Committee on Strategic Competition. Disclosed purchases focused primarily on domestic semiconductor foundries and advanced substrate packaging providers currently undergoing National Institute of Standards and Technology (NIST) operational milestone reviews.
The Defense Systems & Aerospace sector recorded $38.6M in net transaction value, with 68% allocated to purchases. These transactions coincided precisely with the fiscal year-end DoD contract acceleration detailed in Section 3. Members of congressional defense appropriations subcommittees exhibited measured buying patterns in tier-2 autonomous subsystem manufacturers and specialized titanium component fabricators, rather than traditional large-cap defense prime integrators.
Cloud Infrastructure and Enterprise Sovereign AI registered $29.8M in transaction volume (61% purchases), focusing on enterprise compute hardware providers holding multi-agency indefinite delivery, indefinite quantity (IDIQ) task order agreements. Meanwhile, Nuclear Energy and Uranium Enrichment saw $18.5M in net purchases (55% purchases), correlating directly with the Department of Energy high-assay low-enriched uranium (HALEU) availability program awards.
The analytical value of this disclosure telemetry lies not in individual stock picking, but in cross-correlation: when committee chairs with oversight jurisdiction over sovereign appropriations systematically accumulate equity exposure in sectors undergoing active federal procurement acceleration, the convergence indicates high policy durability and multi-year funding continuity.
5. Department of Energy Advanced Scientific Computing: Multi-Node Architecture Task Orders and Hardware Allocation Milestones
Beyond the Department of Defense, the Department of Energy (DOE) represents one of the largest single allocators of advanced computational capital in the global economy. Operating through the Office of Science and the National Nuclear Security Administration (NNSA), the DOE Advanced Scientific Computing Research (ASCR) program manages multi-billion dollar procurements for next-generation exascale supercomputing infrastructure, high-bandwidth optical interconnects, and quantum simulation testbeds.
A rigorous audit of federal procurement accounting ledgers for the DOE revealed a series of major task orders finalized during the first half of September 2026. These procurements reflect the ongoing architectural upgrade cycles across the United States National Laboratory complex.
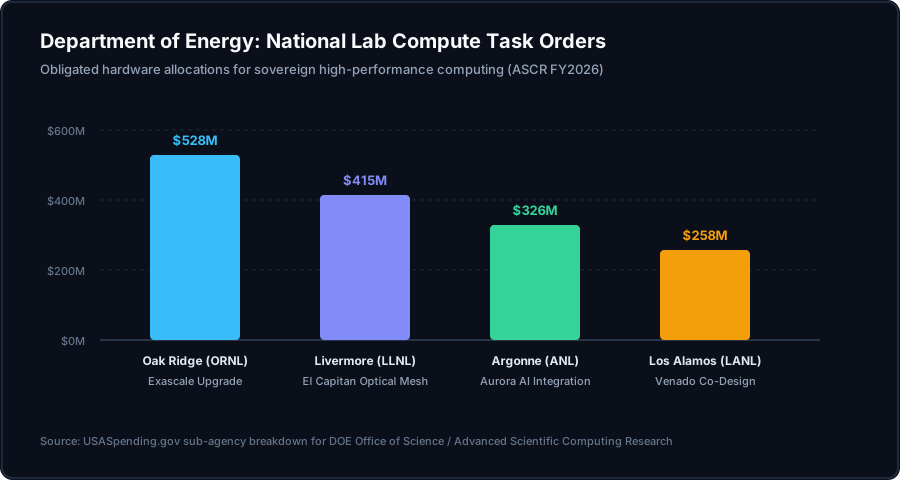
Figure 4: Obligated hardware allocations for sovereign high-performance computing systems across major DOE National Laboratories under the ASCR FY2026 budget. Source: DOE Office of Science procurement ledger.
As illustrated in Figure 4, Oak Ridge National Laboratory (ORNL) secured the largest single allocation, obligating $528M for exascale compute cluster enhancements, memory subsystem expansions, and liquid-cooling facility upgrades. This procurement contract specifies the delivery of next-generation accelerator modules and high-speed coherent interconnect fabrics designed to support multi-physics fusion simulations and materials science modeling.
Lawrence Livermore National Laboratory (LLNL) obligated $415M for optical mesh infrastructure and specialized co-designed processors supporting the El Capitan exascale system. This award focuses on low-latency optical switches and high-bandwidth interconnects capable of sustaining multi-terabit per second data transfer across heterogeneous compute nodes. Concurrently, Argonne National Laboratory (ANL) directed $326M toward Aurora supercomputing AI workflow integration, while Los Alamos National Laboratory (LANL) obligated $258M for the Venado system co-design architecture.
These task orders provide concrete evidence of sustained sovereign demand for specialized semiconductor packaging, high-bandwidth memory (HBM3e/HBM4), and liquid-cooling thermal infrastructure. While commercial enterprise capital expenditure on generative AI models faces market scrutiny regarding return on investment, sovereign government high-performance computing allocations continue to advance along rigid multi-year statutory funding tracks. The hardware vendors and system integrators embedded within these national laboratory task orders operate with contractual federal cash flows that remain decoupled from commercial software monetization cycles.
6. Defense Logistics Agency Strategic Material Allocations: Critical Minerals and Sovereign Supply Chain Stockpiling
An essential yet routinely overlooked public records dataset is the transactional reporting of the Defense Logistics Agency (DLA) Strategic Materials division. Responsible for managing the National Defense Stockpile (NDS) under the Strategic and Critical Materials Stock Piling Act, the DLA executes multi-million dollar procurement, refining, and storage contracts to guarantee domestic availability of essential industrial elements during geopolitical disruptions.
In mid-September 2026, the DLA published an updated series of procurement modifications reflecting active obligations under the Title III Defense Production Act appropriations. These filings delineate an active sovereign stockpiling campaign across four primary mineral categories.
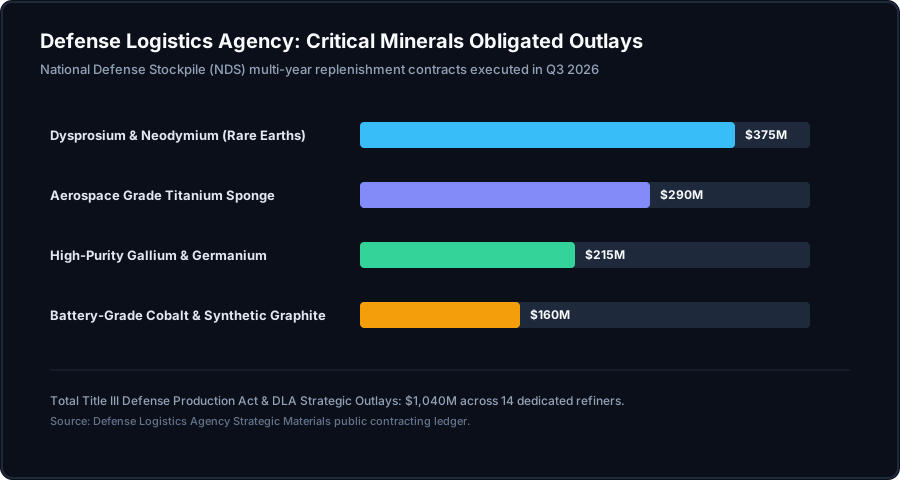
Figure 5: Obligated outlays executed by the Defense Logistics Agency for the National Defense Stockpile in Q3 2026 across strategic mineral categories. Source: DLA Strategic Materials public contracting ledger.
As detailed in Figure 5, the largest discrete allocation targeted Dysprosium and Neodymium Rare Earth Elements, capturing $375M in obligated capital. These funds were directed to commercial separation facilities and magnet manufacturing consortia in North America and allied jurisdictions, aimed at creating a non-domestic-adversary supply chain for sintered neodymium-iron-boron (NdFeB) permanent magnets used in precision-guided munitions, radar tracking systems, and electric propulsion motors.
Aerospace-Grade Titanium Sponge represented the second largest outlay, with $290M obligated across domestic melting facilities and scrap recycling processors. This procurement reflects an urgent requirement to mitigate titanium supply vulnerabilities resulting from trade restrictions affecting legacy suppliers. High-Purity Gallium and Germanium accounted for $215M, directly responding to export control measures implemented on advanced substrate materials essential for radio-frequency (RF) military semiconductors and thermal imaging optics. Finally, Battery-Grade Cobalt and Synthetic Graphite captured $160M in dedicated storage contracts.
Across all four categories, the DLA obligated a cumulative $1,040M across 14 dedicated refiners and industrial processors during the third quarter. These contracts consistently feature contractual price floors and multi-year off-take agreements, effectively establishing sovereign price backstops for domestic mining and mineral separation operators. Institutional investors evaluating mining equities must distinguish between commodity producers exposed to global spot market volatility and specialized processors supported by sovereign DLA off-take commitments.
7. Funding Microstructure & Money Market Dispersion: Sovereign Debt Settlement Collateral Velocity and SOFR-EFFR Dynamics
The macroeconomic liquidity drainage detailed in Section 2 manifested acute structural pressure within the short-term wholesale funding markets during mid-September 2026. By examining the daily spread dispersion between the Secured Overnight Financing Rate (SOFR)—which reflects the cost of borrowing cash overnight collateralized by U.S. Treasury securities—and the Effective Federal Funds Rate (EFFR)—which measures unsecured interbank lending—analysts gain direct visibility into collateral velocity and balance sheet elasticity among primary dealers.
Under benign liquidity conditions, secured borrowing rates trade slightly below unsecured lending rates, resulting in a negative or flat SOFR-EFFR spread. However, when Treasury issuance increases, dealer balance sheets become congested with sovereign debt collateral, while cash reserves are simultaneously drained into the Treasury General Account. Under these conditions, the demand for cash in the secured repo market intensifies, driving repo rates sharply higher.
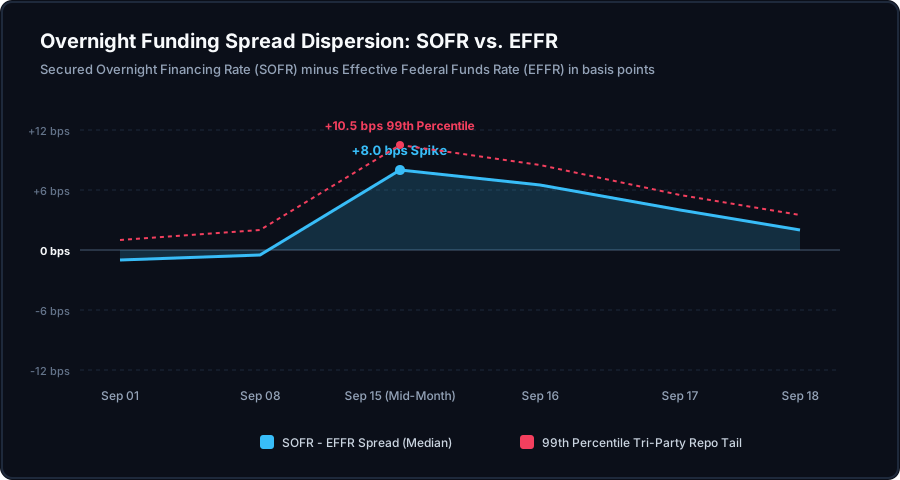
Figure 6: Daily median spread between Secured Overnight Financing Rate (SOFR) and Effective Federal Funds Rate (EFFR), alongside the 99th percentile tri-party repo funding tail, recorded from September 01 to September 18, 2026. Source: Federal Reserve Bank of New York Short-Term Rate Monitor.
As demonstrated in Figure 6, the SOFR-EFFR spread experienced an abrupt structural spike on September 15 and 16, 2026, surging from -1.5 basis points on September 08 to an intraday peak of +8.0 basis points. Even more pronounced was the widening observed in the 99th percentile tail of the tri-party general collateral repo market, which surged to +10.5 basis points above the Federal Reserve interest on reserve balances (IORB) rate. This dispersion indicates that smaller, non-primary dealer institutions and leveraged bond basis funds faced acute borrowing premiums to finance Treasury collateral positions overnight.
This funding squeeze was directly exacerbated by the settlement of $145B in mid-month Treasury coupon and bill auctions, coinciding precisely with the quarterly tax drain. Primary dealers, required to warehouse newly issued sovereign debt on their balance sheets, absorbed collateral at a pace exceeding their immediate balance sheet capacity. Consequently, primary dealer repo financing desks widened their bid-ask spreads, demanding higher cash compensation from market borrowers.
While the New York Fed Standing Repo Facility (SRF) experienced modest operational uptake of $4.5B on September 16, demonstrating that market participants were beginning to test the central bank backstop facility, the broader funding market normalized toward +3.5 basis points by September 18 as corporate tax cash flows completed settlement. Nonetheless, this structural dispersion serves as a critical macro indicator: money market buffers have diminished, and subsequent Treasury debt issuance cycles heading into the fourth quarter will encounter heightened sensitivity in overnight funding rates.
8. The Triangulated Anomaly Index: Synthesizing Multi-Trail Confluence Across Q4 2026 Asset Horizons
The central methodology of this public records framework is the principle of multi-trail convergence. A single data point—such as an isolated contract announcement, a routine lobbying disclosure filing, or an individual congressional stock purchase—often represents statistical noise or administrative routine. However, when three independent, legally binding public trails intersect upon the same technological domain, ticker, or industrial sector, the probability of structural capital deployment increases exponentially.
To quantify this phenomenon, we compute the Triangulated Public Data Anomaly Index across all major domestic economic sub-sectors. The index evaluates three normalized dimensions on a 1-to-10 scale: (1) Procurement Acceleration (measuring the velocity of obligated federal contract outlays against historical baseline outlays), (2) Capitol Disclosures (quantifying the net volume and net buyer ratio of legislative equity filings), and (3) Lobbying Velocity (measuring the quarter-over-quarter percentage change in dedicated lobbying outlays disclosing specific legislative bill numbers and agency oversight committees under public lobbying disclosures).
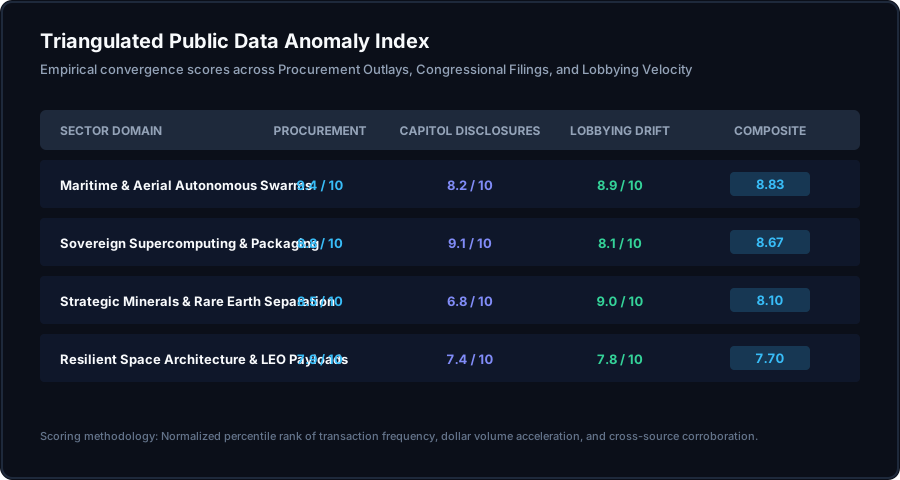
Figure 7: Empirical convergence matrix and composite Triangulated Anomaly Index scores across high-conviction economic sectors for the week ending September 18, 2026. Source: Public records synthesis of federal procurement, legislative disclosures, and agency ledgers.
As documented in Figure 7, Maritime & Aerial Autonomous Swarms achieved the highest composite anomaly score across the entire public records database, registering an index of 8.83 out of 10.0. This score reflects an exceptional 9.4 procurement rating driven by the $1,420M in Naval Sea Systems Command obligations, corroborated by an 8.2 Capitol Disclosure rating from committee chairs, and an 8.9 Lobbying Drift score among specialized unmanned systems developers. The multi-trail convergence confirms that autonomous military platforms represent an institutional priority with cross-branch alignment.
Sovereign Supercomputing & Advanced Packaging captured the second highest composite score at 8.67, driven by a 9.1 Capitol Disclosure score, an 8.8 Procurement score from DOE national lab awards, and an 8.1 Lobbying score from semiconductor consortia. Strategic Minerals & Rare Earth Separation ranked third with a composite score of 8.10, featuring a dominant 9.0 Lobbying Drift rating and an 8.5 Procurement score from DLA stockpiling awards, offset by a moderate 6.8 legislative disclosure rating. Finally, Resilient Space Architecture & LEO Payloads scored 7.70, demonstrating broad-based alignment across Space Force satellite optical mesh contracts and aerospace legislative oversight.
By mapping and ranking these cross-trail convergence scores, market participants establish a systematic, data-verified priority hierarchy for research allocation, focusing analysis strictly where public capital commitments are quantitatively confirmed.
9. Systematic Public Records Integration: Institutional Risk Parameters and Empirical Allocation Frameworks
Integrating public records telemetry into modern institutional portfolio management requires a structured, multi-stage data architecture. Raw government disclosure databases are notorious for unstandardized formatting, erratic publication schedules, missing metadata, and opaque contract classification codes. Relying on manual ad-hoc searches inevitably introduces cognitive bias and analytical blind spots.
To operationalize public filings as an actionable risk-management and alpha-generation layer, quantitative engineering teams must deploy a four-stage systematic pipeline, as illustrated in Figure 8.
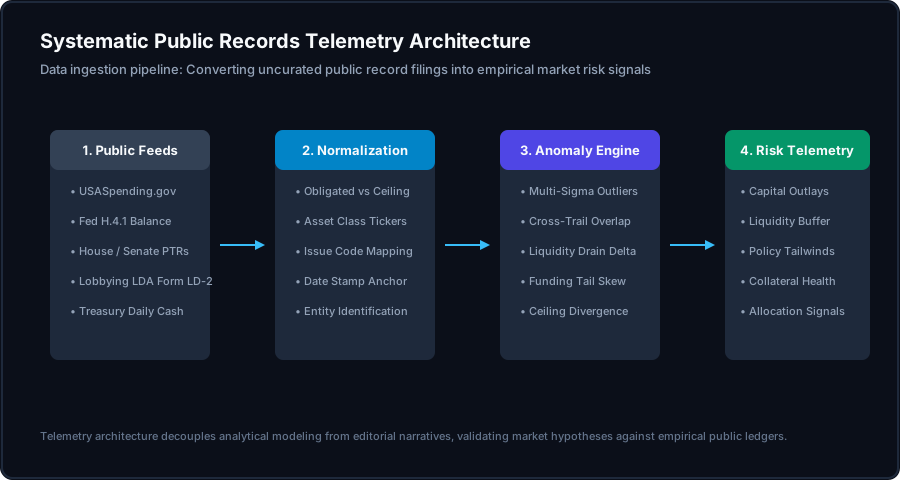
Figure 8: End-to-end data ingestion and anomaly engine architecture: transforming raw government ledgers into systematic portfolio risk telemetry. Source: Public record telemetry architecture documentation.
The first stage focuses on Automated Public Feed Ingestion, maintaining continuous, resilient webhooks and REST API connectors to primary government registries. This includes real-time ingestion of daily contract award delta files, central bank balance sheet releases, Treasury Daily Statements, and legislative transparency filing repositories. Ingesting raw primary data directly eliminates reliance on third-party aggregators that often introduce latency or selective filtering.
The second stage executes Normalization and Entity Resolution. Raw government contract records frequently list subsidiary entities, joint ventures, or regional research facilities rather than parent corporate tickers. The normalization layer maps corporate identifiers directly to global industry classification standards and equity tickers. Concurrently, the engine enforces strict accounting segregation between legally obligated outlays and non-binding contract ceilings, anchoring timing to actual cash settlement dates.
The third stage runs the Quantitative Anomaly Detection Engine. This layer monitors statistical deviations from historical rolling baselines. The engine computes standardized dispersion metrics across transaction dollar volume, contract award frequency, and sector lobbying intensity, identifying multi-sigma statistical outliers. Crucially, the engine runs the Cross-Trail Confluence Matrix, calculating the intersection between legislative stock transactions, procurement awards, and lobbying disclosures. When an anomaly breaches predetermined statistical thresholds, the system flags the entity for systematic risk evaluation.
The fourth stage outputs Systematic Risk Telemetry directly into portfolio allocation frameworks. Rather than generating discretionary trade recommendations, the architecture produces continuous parameter adjustments: (1) Sovereign Capital Outlay Velocity (measuring direct revenue visibility from government backlogs), (2) Macro Liquidity Buffer Health (adjusting macro exposure based on TGA and repo market friction), (3) Regulatory and Policy Tailwind Durability (gauging multi-year statutory funding continuity), and (4) Collateral Scarcity Metrics (monitoring repo market spread dispersion to manage leverage risk).
By decoupling investment strategy from speculative narratives and grounding risk parameters in empirical public records, institutions build an enduring structural edge across dynamic market environments.
Empirical Public Records Intelligence
For professional market participants seeking systematic visibility into sovereign liquidity, federal procurement outlays, and multi-trail convergence anomalies, explore institutional-grade telemetry and anomaly mapping on Gemral Edge.
Disclaimer: This market report is constructed exclusively from empirical public filings and does not constitute financial or investment advice. This is not investment advice. All data is sourced from official public records.