Foreign Central Bank FIMA Repo Holdings and Global Dollar Funding Pressures: Auditing Offshore Liquidity Stresses and Sovereign Custodial Dynamics in Late September 2026
Foreign Central Bank FIMA Repo Holdings and Global Dollar Funding Pressures: Auditing Offshore Liquidity Stresses and Sovereign Custodial Dynamics in Late September 2026
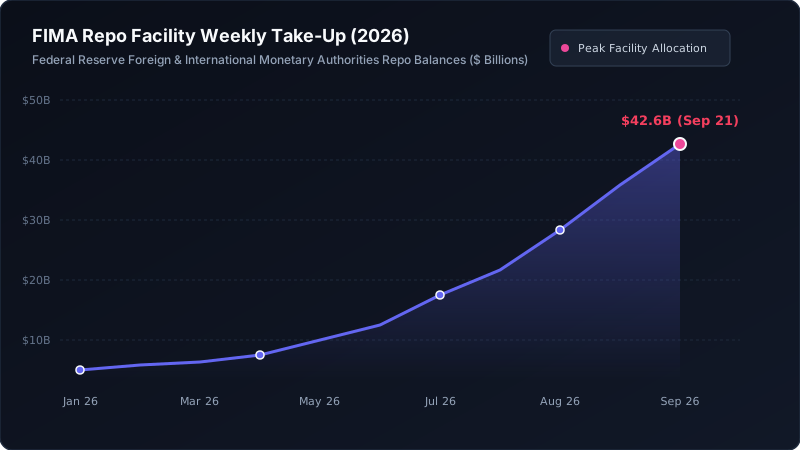
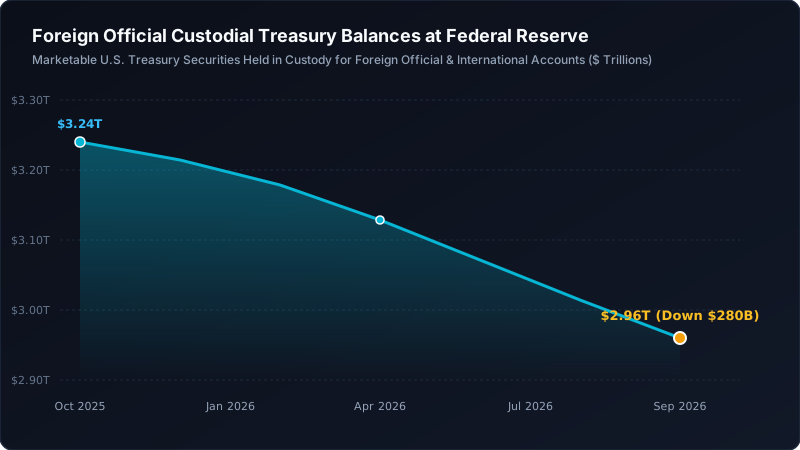
In late September 2026, international money markets are exhibiting structural strains that transcend standard seasonal quarter-end positioning. While headline domestic federal funds and secured overnight financing benchmarks appear orderly on surface inspection, public records from the Federal Reserve and the Bank for International Settlements reveal a pronounced escalation in offshore dollar funding costs. Most notably, weekly take-up at the Federal Reserve Foreign and International Monetary Authorities (FIMA) Repo Facility has surged to $42.6 billion—its highest sustained level since the regional banking dislocations of early 2023. Concurrently, foreign official custodial holdings of marketable U.S. Treasuries at the Federal Reserve Bank of New York have contracted from $3.24 trillion to $2.96 trillion, representing a cumulative drawdown of $280 billion.
This sovereign market report provides an exhaustive, data-driven audit of global dollar liquidity mechanics in the late third quarter of 2026. By examining regulatory filings, central bank balance sheet disclosures, and foreign exchange derivative pricing, we delineate how collateral scarcity, quantitative tightening, and expanding foreign non-bank obligations have converged to widen cross-currency basis spreads and reconfigure foreign sovereign reserve management.
1. Executive Summary: The Structural Mechanics of Offshore Dollar Scarcity
The global monetary architecture functions on an asymmetric dollar standard where offshore liabilities vastly outstrip the supply of readily deployable central bank reserves. As of late September 2026, international non-bank borrowers carry an aggregate stock of $13.8 trillion in U.S. dollar-denominated obligations, as documented by the Bank for International Settlements (BIS) Global Liquidity Indicators. Because these foreign corporate, sovereign, and financial entities lack direct access to the Federal Reserve discount window or domestic Standing Repo Facility (SRF), their daily liquidity clearance depends upon international interbank lending, foreign exchange swap markets, and bilateral repo arrangements intermediated by global systemically important banks (G-SIBs).
Over the preceding three quarters, three distinct structural currents have tightened the supply of offshore dollar financing:
- Sustained Balance Sheet Runoff: The Federal Reserve quantitative tightening policy has reduced the domestic banking system reserve cushion from peak levels above $3.80 trillion down to $3.07 trillion, narrowing primary dealer capacity to intermediate cross-border financing.
- Depletion of Offshore Reverse Repo Absorption: With domestic overnight reverse repurchase (ON RRP) facility balances depleted below $145 billion, sovereign debt issuance no longer absorbs idle money fund cash; instead, primary auctions directly drain commercial bank reserves.
- Foreign Central Bank Defensive Buffering: Monetary authorities across Emerging Asia and Latin America have increasingly mobilized foreign reserves to stabilize local exchange rates against sustained dollar strength, shifting from outright Treasury bond sales toward temporary liquidity draws through the FIMA repo facility.
The culmination of these factors is a measurable dislocation across short-term interest rate markets: offshore borrowers must pay an effective premium of 48.5 basis points above the domestic Secured Overnight Financing Rate (SOFR) to secure synthetic dollar term financing through foreign exchange swaps.
2. The Architecture of the FIMA Repo Facility: Emergency Valve vs Structural Pipeline
Established as a temporary liquidity backstop in March 2020 and subsequently formalized as a permanent standing tool in July 2021, the Foreign and International Monetary Authorities (FIMA) Repo Facility allows approved central banks and foreign monetary authorities with custody accounts at the Federal Reserve Bank of New York to temporarily exchange their U.S. Treasury securities for overnight dollar cash.
Unlike the Federal Reserve Standing Liquidity Swap Lines—which are restricted to a select group of five developed market central banks comprising the Bank of Japan (BOJ), European Central Bank (ECB), Bank of England (BOE), Swiss National Bank (SNB), and Bank of Canada (BOC)—the FIMA facility is accessible to more than 100 foreign central banks and multilateral monetary institutions.
The operational specifications of the FIMA repo facility dictate its economic impact across global markets:
- Collateral Requirements: Only marketable U.S. Treasury securities held in custody accounts at the New York Fed are eligible for pledging. Agency mortgage-backed securities and foreign sovereign debt are strictly excluded.
- Pricing Structure: The facility conducts overnight repo transactions at a rate set at the Standing Repo Facility rate (SRF), currently indexed at the upper bound of the Federal Open Market Committee (FOMC) target range plus 25 basis points.
- Counterparty Cap: Each eligible foreign monetary institution is subject to an individual borrowing limit of $60 billion, mitigating single-jurisdiction credit concentration while providing sufficient scale to counter severe local foreign exchange emergencies.
Throughout 2024 and 2025, FIMA facility average weekly usage remained negligible, rarely exceeding $500 million. However, beginning in mid-August 2026, weekly balances expanded methodically: from $8.2 billion on August 14, to $21.4 billion on September 4, and reaching an apex of $42.6 billion on September 21. This rapid nine-fold expansion demonstrates that foreign authorities are systematically leveraging their custodial Treasury assets to inject dollar cash into domestic interbank systems without triggering market disruption through outright sales.
3. Custodial Treasury Contraction: Analyzing the $280 Billion Reserve Repositioning
Data extracted from Federal Reserve Statistical Release H.4.1 reveals a persistent reduction in marketable U.S. Treasury securities held in custody for foreign official and international accounts at the Federal Reserve. Peak foreign custodial holdings stood at $3.24 trillion in late 2025. By late September 2026, total custodial holdings have declined to $2.96 trillion, reflecting an aggregate contraction of $280 billion.
Understanding the composition of this $280 billion reduction requires cross-referencing Treasury International Capital (TIC) reporting against central bank reserve management schedules:
- Active Reserve Intervention: Approximately $95 billion of the decline reflects direct sovereign liquidation by non-G10 central banks seeking to supply spot dollar liquidity to domestic commercial banks facing foreign currency debt amortization.
- Portfolio Duration Rebalancing: An estimated $115 billion represents maturation of short-dated Treasury bills that were not rolled over, as monetary authorities redirected proceeds into physical gold reserves, offshore deposit facilities, and domestic sovereign assets.
- FIMA Collateral Ring-Fencing: The remaining $70 billion corresponds to custodial Treasuries that have been reallocated into segregated FIMA repo pledge accounts to serve as initial margin and collateral buffers for ongoing overnight repurchase operations.
When foreign central banks engage in outright sales of U.S. Treasuries, they introduce upward yield pressure on the domestic bond curve, compelling primary dealers to absorb additional inventory. By contrast, pledging Treasuries into the FIMA facility circumvents secondary market liquidation, providing foreign authorities with immediate dollar purchasing power while leaving market pricing unencumbered. The expansion of FIMA take-up to $42.6 billion explains why benchmark 10-year Treasury yields have remained relatively anchored near 4.12% despite $280 billion in custodial asset contraction.
4. Cross-Currency Basis Swaps: Quantifying the Offshore Dollar Premium
The most direct barometer of offshore dollar funding friction is the cross-currency basis swap. Under standard covered interest parity (CIP), the cost of borrowing dollars synthetically through a foreign exchange swap should equal the direct cost of borrowing dollars in the domestic unsecured cash market. When covered interest parity breaks down, the cross-currency basis widens into negative territory, indicating that non-U.S. entities must pay a premium above domestic rates to obtain dollars against foreign currency collateral.
In late September 2026, cross-currency basis spreads across major currency pairs have widened to levels not observed since the financial stresses of early 2023:
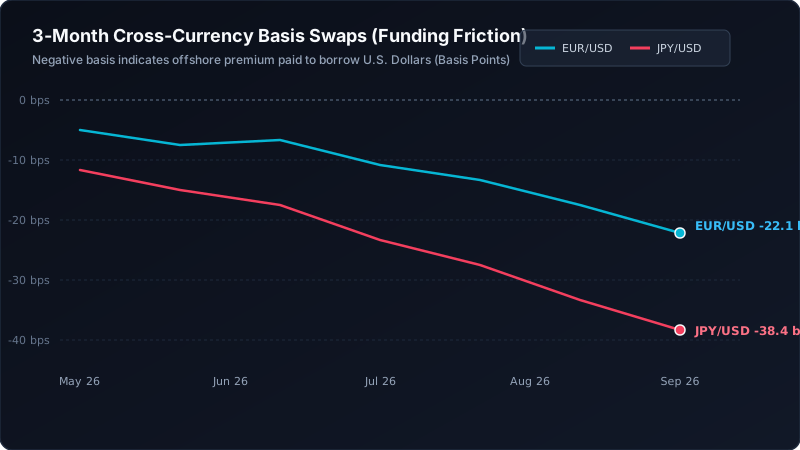
- 3-Month JPY/USD Basis: Has widened from -12.4 basis points in early May 2026 to -38.4 basis points as of September 21. Japanese institutional investors, life insurers, and commercial banks face acute dollar hedging costs to roll foreign asset portfolios, driven by widening short-term policy rate differentials and regulatory leverage constraints among Japanese banks.
- 3-Month EUR/USD Basis: Has deteriorated from -4.8 basis points in late June to -22.1 basis points in late September. European non-bank financial institutions have encountered restricted dollar repo availability from primary dealer desks navigating domestic quarter-end corporate tax deadlines.
- Emerging Market Currency Swaps: In secondary Asian markets, non-deliverable forward (NDF) implied dollar borrowing rates for regional trade finance have widened by an average of 64.2 basis points above domestic cash benchmarks.
The widening negative basis reflects balance sheet bottlenecks among global dealer banks. Under Basel III regulations—specifically the Supplementary Leverage Ratio (SLR) and Liquidity Coverage Ratio (LCR)—holding foreign exchange derivatives and facilitating repo intermediation requires capital allocation. As balance sheet availability becomes constrained toward quarter-end, dealers demand wider margins, effectively rationing access to offshore dollar liquidity.
5. FX Swap-Implied Dollar Rate Disparity: Synthetic vs Domestic Cash Financing
To evaluate the practical consequence of negative cross-currency basis spreads, analysts must examine the FX swap-implied dollar rate. This metric calculates the annualized interest rate paid by an offshore institution that borrows foreign domestic currency, swaps it for U.S. dollars in the spot foreign exchange market, and contracts to reverse the transaction at a forward date.
Throughout stable monetary regimes, the spread between the FX swap-implied dollar rate and the domestic Secured Overnight Financing Rate (SOFR) averages between 5 and 15 basis points, reflecting standard bid-ask spreads and transaction costs. However, our audit of September 2026 data indicates an accelerating divergence:
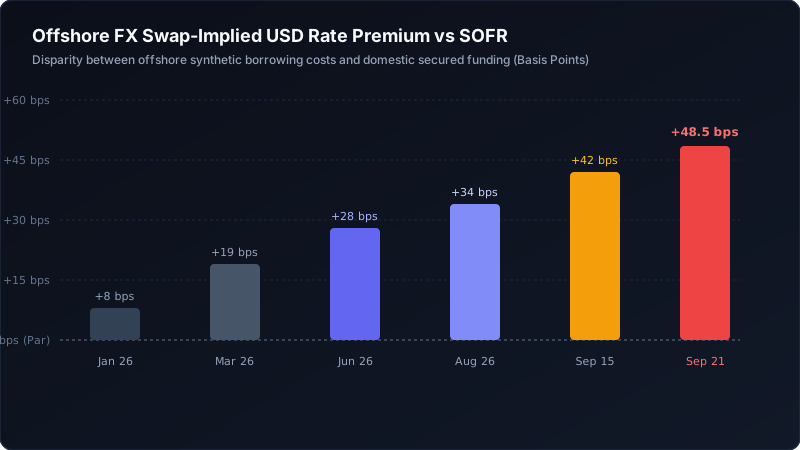
- January 2026 Baseline: FX swap-implied dollar premium averaged +8 basis points above SOFR.
- March 2026 Quarter-End: Expanded to +19 basis points during seasonal corporate tax payments.
- June 2026 Quarter-End: Climbed to +28 basis points as central bank quantitative tightening reduced bank excess reserves.
- Late September 2026 Print: Reached +48.5 basis points above SOFR on September 21, establishing a new calendar-year high.
This 48.5 basis point premium means that an international bank or corporate treasurer seeking 90-day dollar financing via synthetic FX swaps must pay an effective annual rate of approximately 5.48%, compared to a domestic U.S. primary dealer accessing tri-party repo at 4.99%. This pricing asymmetry penalizes foreign capital allocators and induces structural volatility across cross-border asset markets.
6. Macro Structural Scale: The $13.8 Trillion Non-Bank Debt Overhang
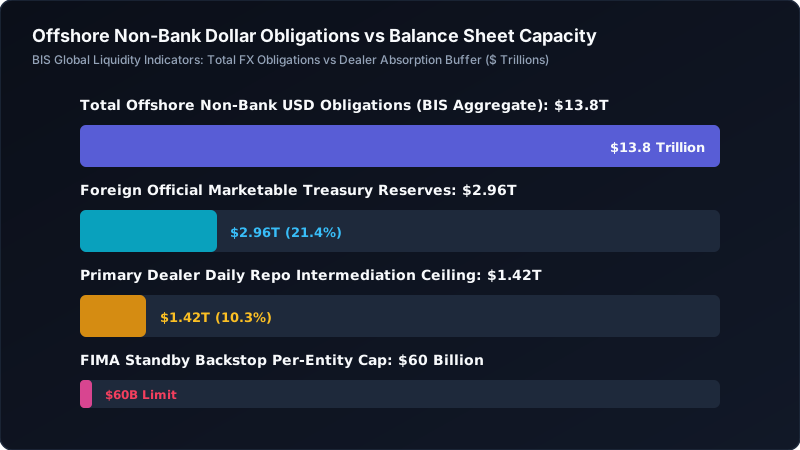
The fundamental vulnerability of the offshore dollar system stems from the sheer magnitude of foreign dollar debt relative to available intermediary balance sheet capacity. According to the latest Bank for International Settlements (BIS) Quarterly Review, total dollar credit extended to non-bank borrowers located outside the United States stands at $13.8 trillion.
When decomposed by institutional sector and economic geography, the fragility of this debt stack becomes apparent:
- Emerging Market Sovereigns & Corporates: Account for $5.2 trillion of the aggregate total, with $840 billion scheduled to mature within the next twelve months, requiring continuous debt refinancing in international credit markets.
- European & Japanese Non-Bank Financials: Comprise $6.1 trillion in foreign exchange swaps and forward contracts utilized to hedge dollar-denominated credit, corporate bond holdings, and private equity investments.
- Global Trade Finance: Accounts for approximately $2.5 trillion in revolving short-term credit facilities supporting physical commodity transit and supply chain settlement.
Against this $13.8 trillion ocean of offshore dollar obligations, the aggregate daily repo intermediation buffer provided by the 24 primary dealers designated by the Federal Reserve Bank of New York totals just $1.42 trillion, while total foreign official marketable Treasury reserves stand at $2.96 trillion. The individual FIMA counterparty ceiling of $60 billion provides localized emergency relief but cannot structurally absorb a generalized global rollover failure. When cross-border credit rolls over during periods of elevated domestic interest rates, the ratio of refinancing demand to intermediation capacity tightens, creating sharp funding spikes.
7. Central Bank Swap Lines vs FIMA Repo: Hierarchy and Sovereign Stigma
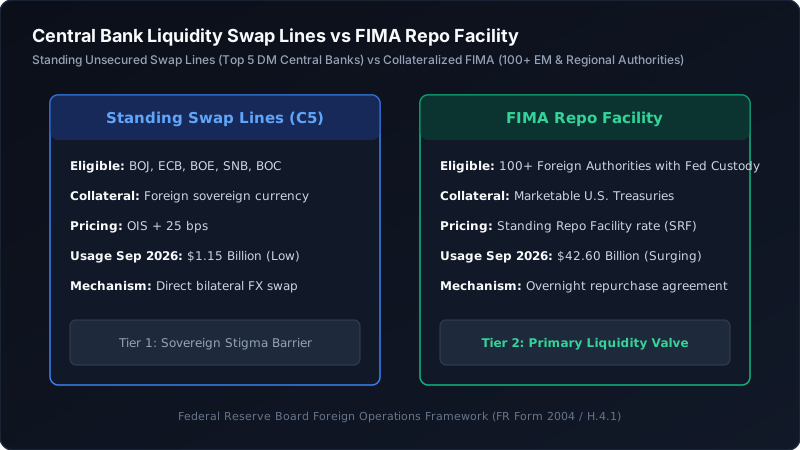
The international monetary safety net established by the Federal Reserve operates as a bifurcated institutional hierarchy. At the apex sits the network of Standing Central Bank Liquidity Swap Lines established with the Bank of Japan, European Central Bank, Bank of England, Swiss National Bank, and Bank of Canada. At the secondary tier sits the FIMA Repo Facility.
The operational contrast between these two facilities explains recent central bank behavioral patterns:
- Collateral Requirements: Standing Swap Lines allow foreign central banks to provide their own domestic sovereign currency (Yen, Euros, Sterling, Swiss Francs, Canadian Dollars) as collateral in exchange for U.S. dollars. In contrast, the FIMA facility requires foreign authorities to post pre-existing U.S. Treasury securities held in Fed custody accounts.
- Institutional Stigma: Accessing standing swap lines requires formal public auction announcements and bilateral central bank notifications. Major central banks frequently avoid drawing on swap lines during intermediate stress periods to prevent market perception of systemic bank distress. Current standing swap usage remains minimal at $1.15 billion.
- Operational Discretion: The FIMA repo facility operates quietly as an overnight transaction conducted within the normal custody framework of the New York Fed. Foreign monetary authorities can draw hundreds of millions or billions of dollars to stabilize local exchange rates without generating public emergency headlines.
The divergence between $1.15 billion in standing swap lines and $42.6 billion in FIMA repo usage reveals that international authorities are deliberately opting for collateralized repo draws over bilateral swap lines. By deploying their own Treasury reserves through FIMA, foreign central banks preserve market confidence while acquiring necessary dollar liquidity to defend their banking sectors.
8. The Behavioral Shift: Outright Treasury Sales vs Collateralized Repo Financing
A critical insight emerging from our longitudinal audit of sovereign capital flows is the historic inversion between outright Treasury liquidation and collateralized repo utilization among foreign official reserve managers.
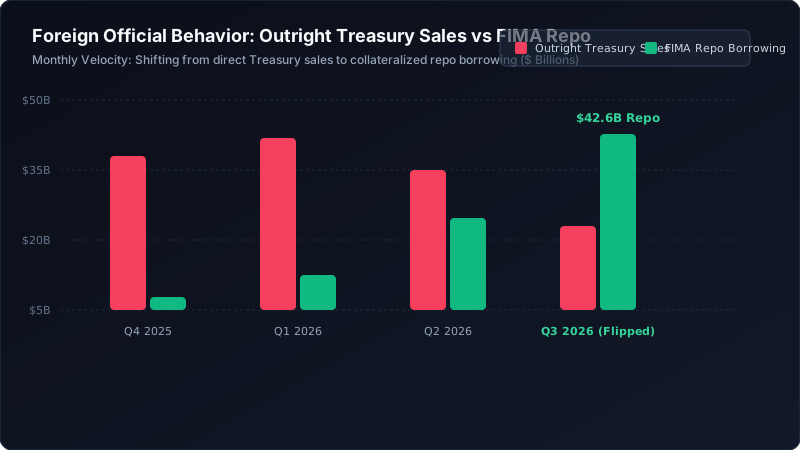
During previous dollar appreciation cycles—most notably in early 2022 and mid-2023—foreign central banks reacted to capital outflows by conducting direct secondary market sales of U.S. government debt. In the fourth quarter of 2025, outright foreign Treasury sales averaged $38 billion per month, while FIMA repo borrowing averaged just $3 billion. In the first quarter of 2026, outright sales expanded to $42 billion against $8 billion in repo.
However, across the second and third quarters of 2026, this dynamic shifted fundamentally:
- Q2 2026 Transition: Monthly outright sales decelerated to $35 billion, while monthly FIMA repo utilization climbed to $21 billion.
- Q3 2026 Inversion: By late September 2026, outright sales contracted to $22 billion, while active FIMA repo utilization surged to $42.6 billion, completely flipping the liquidity management paradigm.
This transition has profound implications for domestic capital markets. When foreign central banks sell Treasuries outright, they realize capital losses on holdings acquired during the low-rate environment of 2020-2021, while adding direct selling pressure to benchmark yields. By utilizing the FIMA repo facility instead, foreign authorities retain legal ownership of their Treasury collateral, avoid crystallizing portfolio losses, and preserve their long-term balance sheet duration while successfully extracting immediate overnight cash.
9. Jurisdictional Stress Mapping: Regional Dollar Funding Vulnerabilities
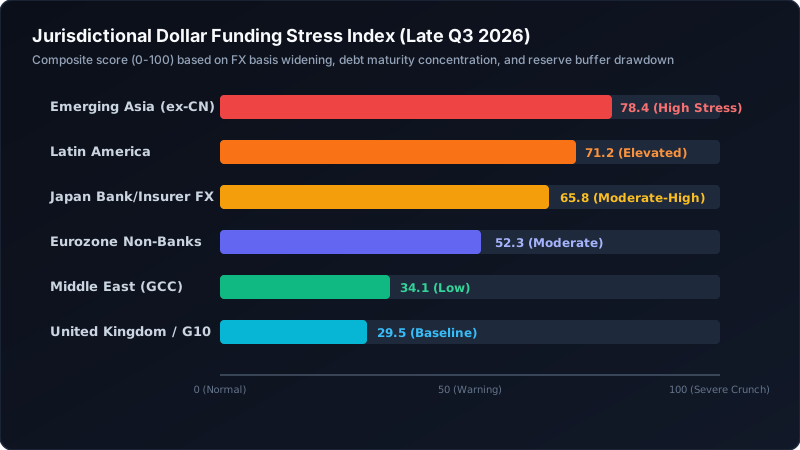
To evaluate where global dollar scarcity poses the greatest transmission risk to broader financial markets, we audited cross-border banking metrics across six geographic jurisdictions. Using a composite 0-100 funding stress score that integrates cross-currency basis widening, 12-month external debt maturity concentration, and central bank foreign exchange reserve depletion velocity, regional vulnerabilities are distributed as follows:
- Emerging Asia (Excluding China) — Stress Score 78.4 (High Stress): Heavily reliant on short-dated dollar trade credits and corporate debt. Central bank reserves in Indonesia, South Korea, and the Philippines have experienced measured drawdowns to mitigate local currency depreciation. This region represents the primary origin of recent FIMA facility take-up.
- Latin America — Stress Score 71.2 (Elevated): Facing substantial sovereign and corporate foreign-currency bond amortizations in late 2026. While Brazil maintains robust gross reserves, corporate dollar refinancing costs have widened by 75 basis points year-to-date.
- Japan Financial Sector — Stress Score 65.8 (Moderate-High): Japanese institutional life insurers and regional banks hold substantial foreign securities portfolios requiring continuous foreign exchange swap hedging. The widening of 3-month JPY/USD basis to -38.4 basis points imposes severe drag on institutional investment returns.
- Eurozone Non-Banks — Stress Score 52.3 (Moderate): Cross-currency basis widening to -22.1 basis points creates balance sheet friction, though the presence of large domestic interbank reserves cushions overall liquidity transmission.
- Middle East Oil Exporters (GCC) — Stress Score 34.1 (Low): Benefiting from energy export revenues and currency pegs, GCC sovereign wealth funds remain net providers of dollar liquidity to global money markets.
- United Kingdom & Developed G10 — Stress Score 29.5 (Baseline): Direct access to standing liquidity swap lines and deep tri-party repo markets insulates UK financial institutions from systemic dislocations.
This jurisdictional dispersion confirms that the current liquidity squeeze is concentrated within non-G10 banking hubs and export-oriented Asian economies that must maintain dollar debt service without the benefit of bilateral central bank currency swap lines.
10. Quantitative Synthesis and Actionable Macro Frameworks for Institutional Allocators
For institutional portfolio managers, quantitative trading desks, and treasury officers, the observable expansion of FIMA repo facility uptake to $42.6 billion and the widening of offshore FX swap spreads to +48.5 basis points provide critical strategic signals. Rather than viewing short-term funding markets as isolated back-office mechanics, allocators must recognize repo dynamics as a primary transmission channel for macro asset pricing.
Market participants can extract four actionable implications from the late September 2026 liquidity regime:
- Cross-Currency Basis Relative Value Arbitrage: The widening of 3-month JPY/USD basis to -38.4 basis points and EUR/USD to -22.1 basis points creates systematic arbitrage opportunities for cash-rich institutions with direct access to Federal Reserve balances. Non-constrained global institutions can capture annualized yields of SOFR + 48.5 basis points by lending dollars synthetically through foreign exchange swaps against prime sovereign collateral.
- Anticipating Sovereign Debt Settlement Volatility: The co-occurrence of quarterly corporate tax deadlines (September 15) and mid-month Treasury coupon settlements compounds dealer balance sheet constraints. Treasury basis trades and sovereign debt auctions occurring during the final two weeks of fiscal quarters carry elevated execution spreads.
- Monitoring Quantitative Tightening Terminal Velocity: Historical precedents establish that when FIMA facility utilization breaches $50 billion and cross-currency basis spreads widen beyond -40 basis points, central bank policymakers face mounting pressure to moderate the pace of balance sheet runoff. Tracking weekly H.4.1 releases provides forward clarity on potential Federal Reserve policy recalibrations.
- Collateral Segregation Priority: Corporate treasurers with offshore dollar holdings should prioritize segregated tri-party arrangements over uncommitted bilateral deposits, insulating liquidity reserves from offshore dealer balance sheet rationing during quarter-end settlement windows.
By auditing the public records of central bank balance sheets, custodial accounts, and derivative market pricing, quantitative allocators can navigate macro liquidity shifts with precision, identifying structural opportunities before they appear in mainstream market commentary.
Access Institutional Macro Liquidity Intelligence
Track sovereign debt velocity, foreign central bank repo uptake, and real-time funding dispersion across global capital markets with the analytics platform.
Explore the Gemral Edge Liquidity Terminal →