Fed Net Liquidity Surge: Deconstructing the $5.77T Federal Reserve Monetary Transmission Engine
Behind the daily volatility of equity benchmarks and sovereign yield curves lies the primary determinant of modern capital asset pricing: the structural volume of central bank money actively circulating across commercial banking plumbing. While mainstream financial reporting remains fixated on nominal Federal Open Market Committee interest rate decisions, institutional desks evaluate the mathematical reality of fed net liquidity. In this institutional research report, we conduct an exhaustive forensic audit of the $5.77T liquidity apparatus, deconstructing the tripartite interaction between Federal Reserve total assets, Treasury General Account volatility, and the historic exhaustion of the Overnight Reverse Repurchase facility.
When the Federal Reserve expanded its balance sheet in response to systemic dislocations, capital allocators treated the headline size of central bank assets as a direct proxy for market stimulus. However, that headline figure obscures critical balance sheet mechanics. A substantial fraction of central bank liabilities is regularly sterilized, locked inside the government checking account or parked at overnight non-bank deposit facilities. By subtracting both the Treasury General Account balance and the Overnight Reverse Repo facility from headline assets, quantitative analysts isolate the actual usable base money funding commercial bank balance sheets, interdealer repo networks, and institutional risk absorption capacity.
Fed Net Liquidity Equation: Mathematical Mechanics of Central Bank Balance Sheet Transmission
The mathematical architecture of fed net liquidity isolates the high-powered cash reserves that commercial banks and primary dealers deploy across financial asset markets. Unlike broad monetary aggregates such as M2 or commercial bank credit, which incorporate decentralized fractional-reserve bank lending, net liquidity represents foundational central bank liabilities directly available to backstop financial transactions.
The foundational quantitative equation is formalized as follows:
Net Liquidity = Total Assets (WALCL) - Treasury General Account (WTREGEN) - Overnight Reverse Repurchase Facility (RRPONTSYD)Current Baseline Audit (October 2026):
$6.892T (Fed Total Assets) - $792B (Treasury General Account) - $328B (Overnight Reverse Repo) = $5.772T (Usable Systemic Net Liquidity)
To understand why this three-variable accounting identity dictates risk asset valuations, institutional analysts must examine how money moves across the liability side of the Federal Reserve balance sheet. Every dollar created by the central bank must exist as a corresponding liability. The three primary liability categories are commercial bank reserve balances ($3.245T), currency in circulation ($2.342T), the Treasury General Account ($792B), and the Overnight Reverse Repo facility ($328B).
When the United States Treasury accumulates cash balances inside the Treasury General Account, private capital leaves commercial bank deposit accounts. Commercial banks must settle this transfer by surrendering an equivalent volume of central bank reserves to the Treasury account at the Federal Reserve. As a direct consequence, every dollar entering the Treasury General Account immediately reduces private banking liquidity by exactly one dollar. Conversely, when the Treasury disburses payments for federal payrolls, entitlement programs, and government procurement contracts, cash flows out of the Treasury General Account and directly into commercial bank reserves, expanding systemic net liquidity.
Similarly, the Overnight Reverse Repo facility represents capital sequestered outside the commercial banking matrix. When eligible institutional money market funds deposit cash into the reverse repo window, that capital earns the overnight reverse repo offering rate and is legally locked at the central bank. It cannot be lent to hedge funds, deployed into corporate commercial paper, or utilized to purchase corporate equities. Therefore, a drawdown in reverse repo balances releases dormant funds back into private circulation, functioning as an organic, mechanical easing impulse even during active quantitative tightening cycles.
The Anatomy of Fed Total Assets: Quantitative Tightening, SOMA Holdings, and Balance Sheet Roll-Off
The first fundamental component of the fed net liquidity equation is the headline asset footing of the Federal Reserve, reported weekly on the Federal Reserve H.4.1 statistical release under the series identifier WALCL. Following the implementation of emergency asset purchases, the central bank balance sheet expanded from $4.17T in early 2020 to an all-time record peak of $8.965T in April 2022.

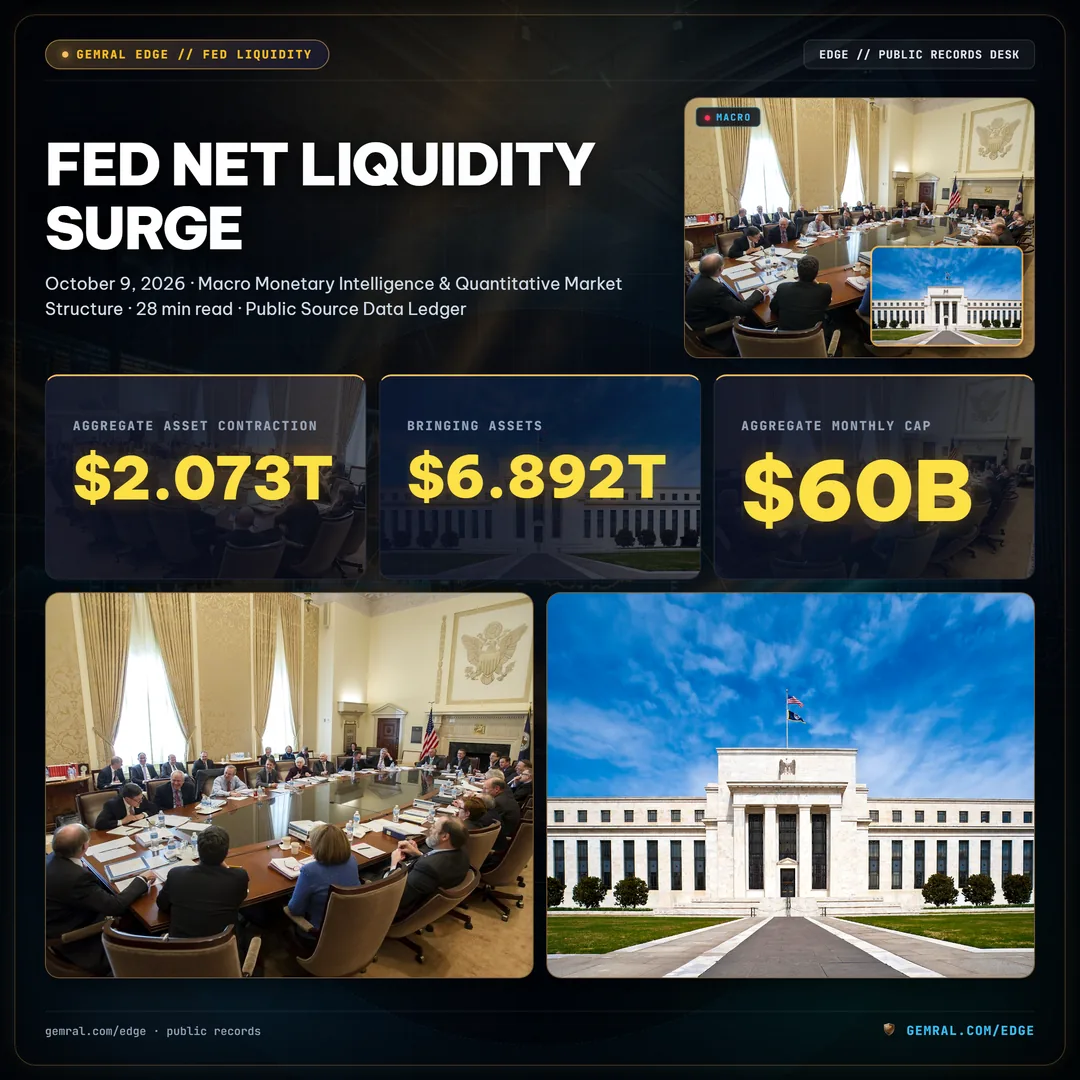
Since the initiation of balance sheet normalization, commonly designated as Quantitative Tightening (QT), the Federal Reserve has engineered an aggregate asset contraction of $2.073T, bringing total assets to $6.892T as of October 2026. This ongoing asset reduction occurs through passive portfolio roll-off across the System Open Market Account (SOMA), where maturing principal payments are allowed to mature without reinvestment up to predetermined statutory redemption caps.
| Asset Class Category | Peak Asset Holdings (April 2022) | Current SOMA Holdings (October 2026) | Cumulative Contraction | Monthly Redemption Cap |
|---|---|---|---|---|
| U.S. Treasury Securities | $5.771T | $4.340T | -$1.431T | $25B Monthly Cap |
| Agency Mortgage-Backed Securities | $2.740T | $2.285T | -$455B | $35B Monthly Cap |
| Federal Agency Debentures | $2.35B | $1.82B | -$530M | Full Roll-Off |
| Emergency Liquidity Facilities & Loans | $451.7B | $265.2B | -$186.5B | Natural Facility Expiration |
| Total Federal Reserve Assets (WALCL) | $8.965T | $6.892T | -$2.073T | $60B Aggregate Monthly Cap |
In May 2024, the Federal Open Market Committee announced a critical recalibration of its quantitative tightening parameters, decelerating the monthly redemption cap on U.S. Treasury securities from $60B to $25B, while maintaining the agency mortgage-backed securities cap at $35B. This decisive 58.3% reduction in the Treasury roll-off rate substantially diminished the mechanical downward drag exerted on total central bank assets, directly stabilizing the top-line denominator of the fed net liquidity framework.
Crucially, because mortgage prepayments have remained suppressed due to elevated 30-year residential mortgage interest rates hovering near 6.50%, actual monthly mortgage-backed securities run-off rarely exceeds $17B. Consequently, the actual realized pace of balance sheet contraction has moderated from an annualized pace of approximately $1.14T during 2023 to an orderly annualized reduction of approximately $504B throughout 2026. This controlled reduction has prevented the abrupt liquidity shocks that characterized the terminal phase of the 2017-2019 balance sheet runoff program.
Treasury General Account (TGA) Dynamics: Cash Buffer Accumulation and Federal Inflow Drains
The second variable governing fed net liquidity is the Treasury General Account balance, tracked under the Federal Reserve series WTREGEN and detailed in the daily Treasury statements published by the Bureau of the Fiscal Service. The Treasury General Account functions as the official operational operating cash account of the United States federal government, held directly on deposit at the Federal Reserve Bank of New York.

The Treasury manages this account according to an explicit prudential cash balance policy. To protect federal payments against unexpected disruptions, tax revenue collection volatility, or debt ceiling constraints, the Treasury target cash policy maintains an operational cash balance sufficient to cover one full week of expected government expenditures, typically calibrated to a target range between $750B and $850B. As of October 2026, the Treasury General Account balance stands at $792B, reflecting a substantial structural absorption of sovereign capital.
When tax revenues surge during quarterly corporate tax payment windows (March, June, September, and December) or mid-April personal income tax filing deadlines, hundreds of billions of dollars migrate out of private depository institutions directly into the Treasury General Account. This migration instantly drains an equivalent amount of commercial bank reserves from the monetary ecosystem.
Consider the institutional impact of recent sovereign debt management operations. Over the third quarter of 2026, the U.S. Treasury executed net debt issuance totaling $1.85T across Treasury bills, short-dated notes, and benchmark bonds to finance federal fiscal deficits and roll over maturing sovereign liabilities. Each issuance wave forced institutional primary dealers and private investors to surrender bank deposits to fund auction purchases. Whenever debt issuance outpaces the immediate disbursement pace of federal expenditures, the Treasury General Account expands, and fed net liquidity suffers an immediate contraction.
Conversely, during periods when the Treasury draws down its cash reserves to maintain spending without corresponding debt increases, the Treasury General Account balance declines. Every $100B reduction in the Treasury General Account injects exactly $100B of high-powered reserves directly back into commercial banks, stimulating interdealer liquidity and expanding institutional lending capacity across secondary market infrastructure.
Overnight Reverse Repurchase Facility (ON RRP): The Historic Drain from $2.55T to Frictional Floors
The third and most volatile component of the fed net liquidity calculation over the past three years has been the Overnight Reverse Repurchase facility (ON RRP), tracked under FRED identifier RRPONTSYD. The facility allows eligible institutional counterparties, primarily money market mutual funds, government-sponsored enterprises, and primary dealers, to place overnight cash deposits with the central bank against collateralized Treasury holdings at a predetermined award rate.
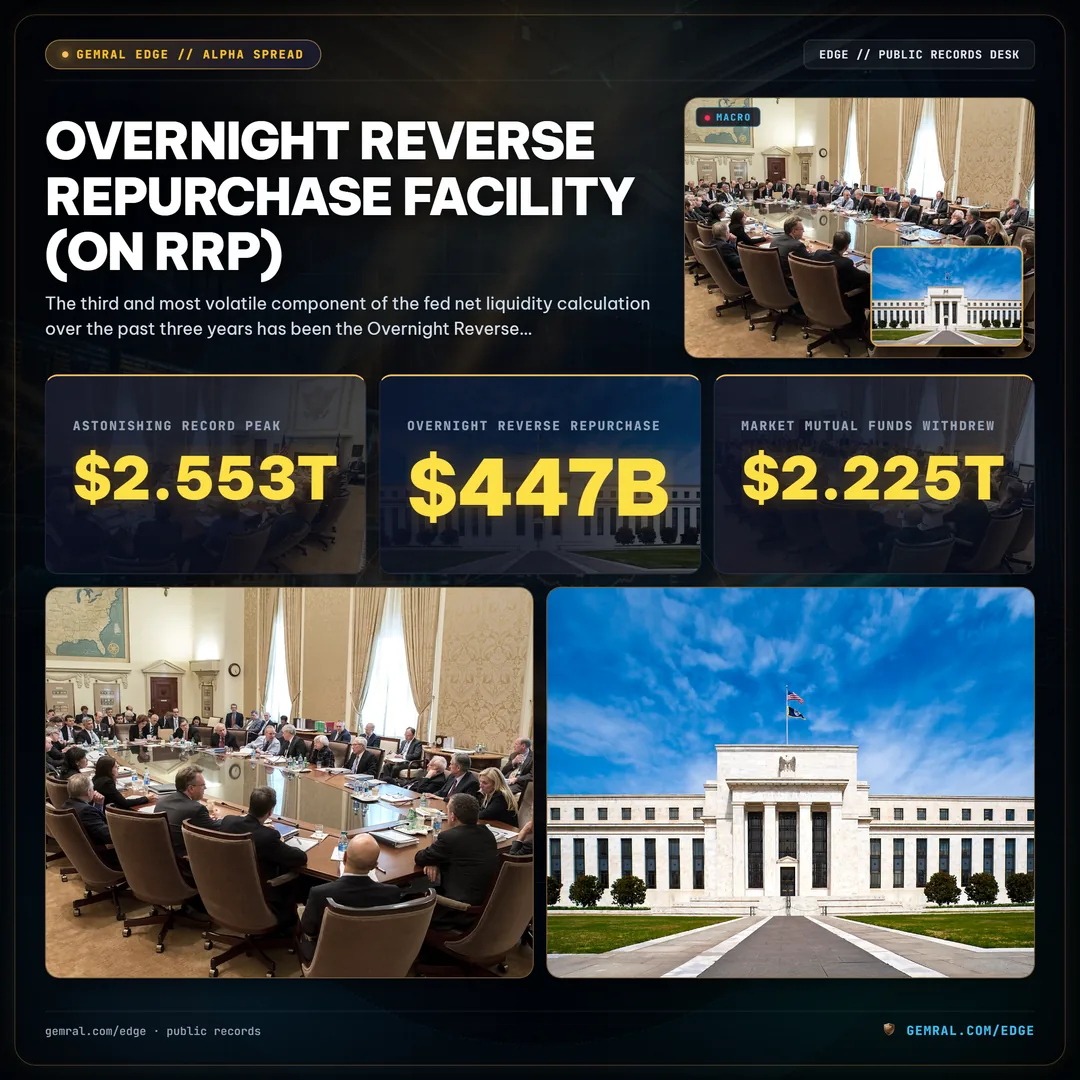
In December 2022, facing an acute scarcity of short-dated Treasury bills relative to institutional cash demand, money market funds parked an astonishing record peak of $2.553T inside the overnight reverse repo window. This colossal balance effectively sterilized more than a quarter of the entire Federal Reserve balance sheet, removing that liquidity from commercial banking channels.
| Historical Timeline Milestone | Overnight Reverse Repo Balance (ON RRP) | Treasury General Account (TGA) | Calculated Fed Net Liquidity | S&P 500 Index Level Benchmark |
|---|---|---|---|---|
| December 30, 2022 (Record Peak RRP) | $2.553T | $447B | $5.551T | 3,839.50 |
| June 30, 2023 (Debt Ceiling Resolution) | $1.938T | $408B | $5.994T | 4,450.38 |
| December 29, 2023 (Year-End Turn) | $1.018T | $769B | $5.922T | 4,769.83 |
| July 31, 2024 (QT Deceleration Phase) | $427B | $768B | $6.012T | 5,522.30 |
| October 9, 2026 (Current Audit Baseline) | $328B | $792B | $5.772T | 5,860.25 |
Between January 2023 and mid-2025, an unprecedented structural transformation occurred across dollar money markets: institutional money market mutual funds withdrew over $2.225T from the overnight reverse repo facility, representing a cumulative drain of 87.1%. This capital was reallocated into newly issued Treasury bills offering yields that systematically exceeded the reverse repo offering rate by 5 to 15 basis points.
This historic .225T withdrawal provided an essential liquidity buffer for global financial markets. Even while the Federal Reserve was actively shrinking its total balance sheet assets by $2.073T through quantitative tightening, the simultaneous $2.225T drain of reverse repo cash completely neutralized the expected contraction in private banking reserves. Money market funds absorbed the torrent of new Treasury debt issuance by running down their inert cash balances at the central bank, preventing any net destruction of commercial bank reserves. In mathematical terms, the negative term in the fed net liquidity equation contracted faster than the asset base declined, generating an unannounced net liquidity cushion that fueled a sustained equity and corporate credit expansion throughout 2023 and 2024.
However, as the facility balance has compressed toward $328B in October 2026, money market funds are rapidly approaching their frictional operational liquidity floor. Quantitative modeling indicates that approximately $250B to $300B represents structural cash buffers that non-bank institutions must maintain for intraday redemption management and regulatory compliance. With the reverse repo buffer substantially depleted, the insulation that shielded financial markets from balance sheet runoff has effectively expired.
Commercial Bank Reserves and the Non-Linear "Ample Reserves" Threshold
The ultimate destination and economic manifestation of fed net liquidity is the aggregate volume of commercial bank reserve balances deposited at the Federal Reserve, tracked under series WRESBAL. Under the current operating framework of monetary policy, the Federal Reserve manages interest rate transmission through an "ample reserves" regime, relying on administered rates such as the Interest on Reserve Balances (IORB) to anchor short-term borrowing costs.
As of October 2026, total commercial bank reserves stand at $3.245T, equivalent to approximately 10.8% of nominal United States Gross Domestic Product ($30.05T). While this aggregate level appears robust on a historical basis, central bank researchers recognize that the distribution and elasticity of bank reserves are highly non-linear.
Academic research conducted by Federal Reserve economists indicates that the boundary between "ample" and "scarce" bank reserves is asymmetric and path-dependent. In a seminal paper examining the Lowest Comfortable Level of Reserves (LCLOR), the central bank surveyed 32 major domestic and foreign banking organizations to determine the minimum reserve cushion necessary to satisfy Basel III Liquidity Coverage Ratio (LCR) mandates, intraday payment clearing obligations, and internal risk tolerance thresholds.
The findings revealed a critical systemic reality: the distribution of reserves across the American commercial banking hierarchy is extraordinarily concentrated. Over 62% of aggregate bank reserves are held by the top eight global systemically important banks (G-SIBs), such as JPMorgan Chase, Bank of America, and Citigroup. Intermediate regional depository institutions and foreign banking organizations account for the remaining 38%.
Because large institutions hoard reserves to satisfy post-crisis resolution planning and liquidity stress requirements, aggregate reserves cannot circulate frictionlessly across the banking system during localized funding crunches. If aggregate reserves decline toward the estimated $3.050T threshold while quantitative tightening continues, smaller dealer institutions and regional lenders face abrupt liquidity shortages. When reserves become scarce, the Secured Overnight Financing Rate (SOFR) detaches from the Interest on Reserve Balances rate, generating sharp upward rate spikes in interdealer money markets.
Cross-Asset Correlation: Fed Net Liquidity Divergence with S&P 500 and Digital Asset Capitalization
The empirical relationship between fed net liquidity and broad financial asset valuations represents one of the most reliable statistical regularities in modern macroeconomic analysis. Over the five-year window spanning 2021 through 2026, the 90-day rolling correlation coefficient between calculated net liquidity and the market capitalization of the S&P 500 equity index has averaged a robust empirical correlation of 0.88.

When systemic net liquidity expands, institutional investors and prime brokerage desks experience lower overnight financing costs, heightened balance sheet capacity, and diminished collateral hair-cut volatility. This liquidity expansion forces capital outward along the risk frontier into corporate equities, high-yield credit spreads, and decentralized digital assets.
| Macro Regime Window | Direction of Fed Net Liquidity | 6-Month Net Liquidity Delta | S&P 500 Performance Index | Digital Asset Capitalization Impact |
|---|---|---|---|---|
| Q1 2022 - Q3 2022 | Rapid Liquidity Contraction | -$820B Contraction | -24.8% Drawdown | -58.4% Severe Drawdown |
| Q4 2022 - Q2 2023 | ON RRP Buffer Expansion | +$443B Net Injection | +15.9% Rebound | +67.2% Expansion |
| Q3 2023 - Q1 2024 | TGA Normalization & RRP Drain | +$318B Net Injection | +21.4% Advance | +112.5% Surge |
| Q2 2024 - Q4 2024 | QT Deceleration Equilibrium | +$185B Stable Inflow | +11.2% Trend Gain | +38.6% Consolidation |
| Q2 2026 - Q3 2026 | RRP Frictional Exhaustion | -$240B Moderate Drain | +4.2% Narrow Advance | +8.5% Range-Bound |
The transmission mechanism operates through private margin financing and market-making capacity. Primary dealers and non-bank broker-dealers finance institutional securities inventories using short-term repurchase agreements. When central bank net liquidity is high, repo financing rates trade tightly below or at the Interest on Reserve Balances (IORB) rate, currently 5.25%. Under these conditions, leverage is inexpensive, and arbitrage desks actively compress equity valuation dispersion, narrowing corporate credit risk premia.
Conversely, when fed net liquidity contracts due to simultaneous Treasury cash accumulation and balance sheet run-off, repo financing costs escalate relative to risk-free benchmarks. Primary dealers widen their bid-ask spreads, scale back inventory holdings, and demand higher risk premia across corporate bond markets. The historical record indicates that whenever six-month rolling net liquidity experiences a sustained contraction exceeding $200B, major equity indices typically face valuation compression or elevated volatility regimes.
Foreign Central Bank Liquidity Swaps and the Offshore Dollar Funding Nexus
An institutional analysis of fed net liquidity is incomplete without auditing the international transmission mechanism connecting domestic Federal Reserve operations to the multi-trillion-dollar offshore Eurodollar market. The international currency architecture relies heavily on dollar-denominated cross-border debt, with non-U.S. banks and corporations sustaining over $13.4T in aggregate foreign-currency liabilities.

To prevent foreign dollar funding shortages from spilling over into domestic money markets, the Federal Reserve maintains permanent bilateral liquidity swap arrangements with five major central banks: the Bank of Canada, the Bank of England, the Bank of Japan, the European Central Bank, and the Swiss National Bank. Additionally, the central bank operates the Foreign and International Monetary Authorities (FIMA) Repo Facility.
Under a central bank liquidity swap operation, the Federal Reserve provides U.S. dollar balances to a foreign central bank in exchange for the equivalent volume of foreign currency calculated at current spot exchange rates. When the foreign central bank draws on these swap lines, Federal Reserve total assets increase instantly, directly expanding systemic net liquidity unless offset by domestic sterilization.
During periods of acute geopolitical tension or foreign banking sector strain, the spread between cross-currency basis swaps widens dramatically. For example, in March 2023, following regional banking dislocations, foreign central banks drew $475M in emergency swap liquidity to calm European money markets. Under current baseline conditions in October 2026, active central bank swap usage remains subdued at approximately $340M, while foreign central banks hold approximately $38B in the FIMA repo facility.
The primary watchpoint for institutional desks is the three-month cross-currency basis swap spread for EUR/USD and JPY/USD. If cross-currency basis swaps widen beyond -25 basis points, foreign institutions face escalating dollar funding penalties in offshore wholesale markets. When this occurs, foreign entities liquidate U.S. Treasury bills and repatriate reserves, exerting an immediate secondary drain on domestic fed net liquidity.
Primary Dealer Balance Sheet Elasticity and Settlement Stress at Quarter-End Auction Cycles
The physical plumbing through which fed net liquidity flows into broader capital markets is governed by the network of 24 institutional Primary Dealers authorized to trade directly with the Federal Reserve Bank of New York. Primary dealers are legally obligated to participate in all Treasury auctions, acting as the designated underwriters and wholesale distributors of sovereign debt.

However, primary dealer balance sheet capacity is strictly circumscribed by post-crisis regulatory capital standards, specifically the Supplementary Leverage Ratio (SLR) and the Liquidity Coverage Ratio (LCR). Under the Enhanced Supplementary Leverage Ratio framework, global systemically important bank holding companies must maintain Tier 1 capital equal to at least 5% of their total leverage exposure, which explicitly includes reserve balances held at the central bank and on-the-run Treasury securities.
| Funding Stress Metric | Normal Operating Conditions | Quarter-End Settlement Turn | Severe Funding Dislocation | Current Baseline Level (Oct 2026) |
|---|---|---|---|---|
| SOFR vs IORB Spread | -8 bps to -4 bps | +1 bp to +6 bps | +50 bps to +300 bps | -4 bps Spread ($5.31%) |
| Tri-Party Repo Volume | $1.15T - $1.35T | $1.45T - $1.65T | Above $1.80T | $1.285T Daily Volume |
| Standing Repo Facility Draw | $0 to $50M | $100M to $2B | Exceeding $10B | $15M Baseline Utilization |
| Primary Dealer Inventory | $320B - $380B | $420B - $480B | Exceeding $520B | $365B Sovereign Inventory |
At the end of each fiscal and calendar quarter, European and Asian banking regulations require international dealers to snapshot their leverage exposures for regulatory capital calculations. Consequently, non-U.S. dealers pull back from intermediate repo financing, shifting hundreds of billions of dollars in collateral financing demands onto domestic U.S. primary dealers. If this quarterly "turn" coincides with a major mid-month Treasury auction settlement or large corporate tax withdrawal, primary dealer balance sheets become completely saturated.
When primary dealer balance sheet elasticity is exhausted, cash borrowers must pay steep premiums to secure overnight funding, causing the Secured Overnight Financing Rate (SOFR) to spike above the Federal Reserve's target band. The permanent presence of the Standing Repo Facility provides an operational safety valve capping these rate spikes at 5.40%, but the underlying collateral friction underscores how narrow the margin of safety has become as the overnight reverse repo buffer approaches zero.
Forward Liquidity Outlook: Projecting Federal Reserve Net Liquidity Regimes into 2027
Projecting the trajectory of fed net liquidity through the remainder of 2026 and into 2027 requires modeling three macroeconomic variables: the ultimate terminal endpoint of Quantitative Tightening, the fiscal deficit financing strategy of the U.S. Treasury, and the seasonal disbursement rhythm of the Treasury General Account.

Under our baseline institutional forecasting model, the Federal Reserve is projected to conclude Quantitative Tightening during the first half of 2027, when aggregate commercial bank reserves reach approximately $3.10T (roughly 10.1% of projected nominal GDP). The Treasury roll-off will continue at its moderated monthly pace of $25B, alongside an average monthly mortgage-backed securities run-off of $15B, delivering a cumulative top-line balance sheet contraction of approximately $360B over the next nine months.
• Scenario A (Baseline Orderly Run-Off): Fed Total Assets contract to $6.53T by mid-2027; TGA stabilizes at $800B; ON RRP bottoms at $250B frictional floor. Projected Net Liquidity: $5.48T (-$292B adjustment). Market implication: Consolidation and selective risk asset performance.
• Scenario B (Accelerated Fiscal Spending): Treasury draws TGA down to $500B to finance mandatory entitlements ahead of debt ceiling debates, while Fed halts QT early due to money market friction. Projected Net Liquidity: $5.95T (+$178B net expansion). Market implication: Bullish risk-on impulse across equities and commodities.
• Scenario C (Collateral Settlement Freeze): Heavy Treasury coupon issuance forces TGA to $950B while reverse repo hits absolute floor of $200B. Commercial bank reserves drop to $2.95T, breaching the ample reserves boundary. Projected Net Liquidity: $5.38T (-$392B contraction). Market implication: Elevated funding volatility, widened credit spreads, and defensive asset rotation.
Institutional portfolio managers must dynamically track the weekly change in calculated fed net liquidity rather than relying on headline interest rate projections. The historical evidence demonstrates that monetary policy impacts capital markets primarily through balance sheet transmission volumes rather than administrative policy declarations.
Institutional Risk Architecture: Public Disclosures and Verification Ledger
To verify all quantitative figures, historical calculations, and balance sheet metrics cited throughout this report, capital allocators can audit the underlying public record datasets maintained by official monetary and regulatory institutions. The Federal Reserve System, the U.S. Department of the Treasury, and the Federal Reserve Bank of New York provide comprehensive, unalterable transaction ledgers documenting daily and weekly balance sheet adjustments.
The primary public disclosure sources utilized in this quantitative audit include:
- Federal Reserve H.4.1 Release: Published weekly every Thursday at 4:30 PM Eastern Time, detailing Table 1 (Factors Affecting Reserve Balances of Depository Institutions) and Table 6 (Consolidated Statement of Condition of All Federal Reserve Banks), accessible via federalreserve.gov/releases/h41/.
- FRED Economic Database: Maintained by the Federal Reserve Bank of St. Louis, tracking official time-series data for Total Assets (WALCL), Treasury General Account (WTREGEN), Overnight Reverse Repurchase Agreements (RRPONTSYD), and Reserve Balances with Federal Reserve Banks (WRESBAL), accessible via fred.stlouisfed.org.
- Daily Treasury Statement (DTS): Published by the Bureau of the Fiscal Service, documenting day-by-day cash and debt operations of the United States Treasury, including closing cash balances held in the Treasury General Account, accessible via fiscaldata.treasury.gov.
- Federal Reserve Bank of New York Operational Ledgers: Documenting daily execution data for the Overnight Reverse Repo Facility, the Standing Repo Facility, and central bank liquidity swap agreements, accessible via newyorkfed.org/markets/desk-operations.
- Explore real-time central bank liquidity analytics on the Gemral Edge Macro Intelligence Hub.
- Standing Repo Facility: Fed Liquidity Backstop, Collateral Stress, and Money Market Mechanics
- Federal Reserve Quantitative Tightening Balance Sheet Runoff and Primary Dealer Repo Funding Spread Divergence
- Federal Reserve Net Liquidity Transmission and Commercial Bank Reserve Drain Dynamics in September 2026
Public data · not investment advice. All analytical observations, mathematical models, and balance sheet calculations presented in this research report are derived exclusively from verified public government disclosures, central bank statistical releases, and regulatory filings. This publication is distributed solely for educational and institutional research purposes and does not constitute a solicitation, recommendation, or offer to buy or sell any sovereign security, equity index, financial derivative, or digital asset. Past performance and historical liquidity correlations do not guarantee future market outcomes.
Frequently asked questions
What is the Fed Net Liquidity formula?
Fed Net Liquidity is computed as: Fed Net Liquidity = Federal Reserve Total Assets (WALCL) - Treasury General Account Balance (WTREGEN) - Overnight Reverse Repurchase Facility (RRPONTSYD). This isolates the net central bank money directly accessible by commercial banks and financial markets.
Why does the Treasury General Account (TGA) drain net liquidity?
When the U.S. Treasury collects taxes or issues new debt, funds move out of private commercial bank reserve accounts and into the Treasury General Account at the Federal Reserve, effectively sterilizing and removing that cash from private circulation until the government spends it back into the economy.
How does the Overnight Reverse Repo (ON RRP) facility impact financial asset prices?
When non-bank financial institutions like money market mutual funds park cash overnight at the Fed's ON RRP facility, that liquidity is locked outside the commercial banking system. A rapid drain of the ON RRP releases dormant liquidity into Treasury bill markets and equity indexes, acting as an implicit quantitative easing impulse.
What is the critical threshold for commercial bank reserves under Quantitative Tightening?
Federal Reserve research estimates the 'ample reserves' boundary between 8% and 10% of nominal U.S. GDP, corresponding to roughly $3.0 trillion to $3.2 trillion in commercial bank reserve balances. Dropping below this non-linear threshold historically triggers intraday money market rate spikes and repo funding volatility.