Federal Reserve Quantitative Tightening Balance Sheet Runoff and Primary Dealer Repo Funding Spread Divergence: Q3 2026 Macro Liquidity Report
Federal Reserve Quantitative Tightening Balance Sheet Runoff and Primary Dealer Repo Funding Spread Divergence: Q3 2026 Macro Liquidity Report
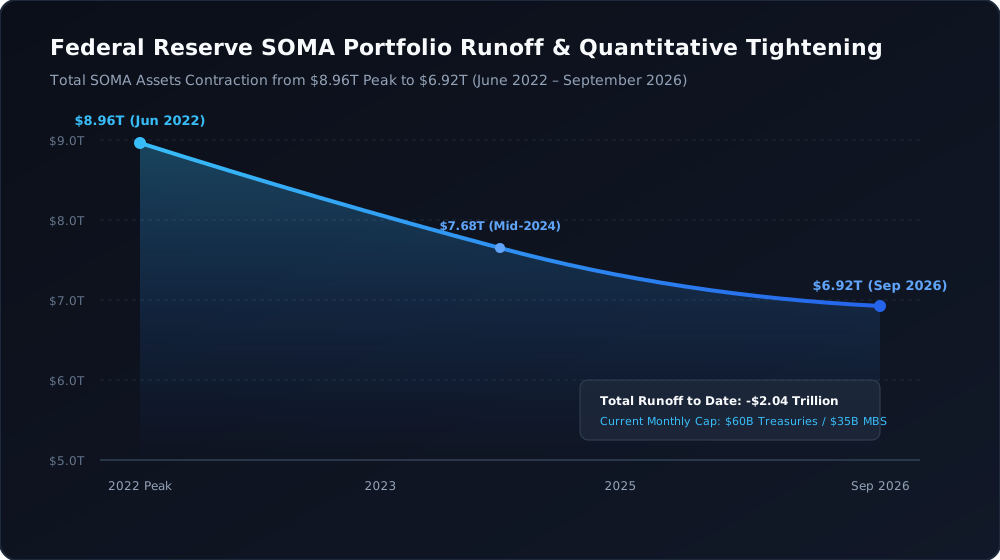
Underneath the surface of global equity valuations and benchmark interest rate expectations, a structural shift is taking place across the plumbing of the United States monetary system. For over four years, the Federal Reserve has executed quantitative tightening (QT), reducing its System Open Market Account (SOMA) portfolio from a peak of $8.96 trillion in June 2022 to $6.92 trillion in late September 2026. While the first phase of this balance sheet runoff was absorbed smoothly by the depletion of the Overnight Reverse Repurchase Agreement (ON RRP) facility, that protective buffer has now contracted to $148 billion. As a direct consequence, the ongoing sovereign runoff has begun transmitting directly into commercial bank reserves and short-term secured financing markets, generating measurable spread dispersion between the Secured Overnight Financing Rate (SOFR) and the Interest on Reserve Balances (IORB).
This comprehensive quarterly market report delivers an exhaustive audit of United States sovereign liquidity mechanics. Based on verified public data from the Federal Reserve Board of Governors H.4.1 releases, the Federal Reserve Bank of New York open market operation accounts, the United States Department of the Treasury Daily Statements, and DTCC clearing indices, this study establishes the precise mathematical relationships governing net system liquidity, audits primary dealer inventory absorption limits, and models the multimonth transmission lags connecting central bank balance sheet runoff to broad financial asset pricing.
1. Executive Synthesis: The Structural Inflection in Federal Liquidity Architecture
The Federal Reserve balance sheet represents the primary foundation of dollar-denominated global credit. During the quantitative easing era, the expansion of central bank asset purchases flooded commercial banks with reserve deposits. Conversely, the balance sheet runoff initiated under the Fed Policy Normalization Principles has removed $2.04 trillion in aggregate sovereign and agency assets from circulation since June 2022. Currently, the Federal Open Market Committee operates under a tapered runoff cap structure that permits up to $60 billion in Treasury securities and $35 billion in agency mortgage-backed securities (MBS) to mature each month without reinvestment.
For the initial 24 months of the tightening cycle, money market funds reallocated capital away from the Fed Overnight Reverse Repo facility into newly issued Treasury bills. This dynamic allowed the central bank to sterilize over $2.30 trillion of its balance sheet without triggering a parallel reduction in commercial bank depository reserves. However, with the ON RRP facility currently resting at $148 billion in late September 2026, down 93.9% from its December 2022 peak of $2.45 trillion, the shock absorber has been depleted.
Every subsequent dollar of SOMA asset contraction, combined with quarterly Treasury General Account (TGA) cash rebuilds, now extracts liquidity dollar-for-dollar from the commercial banking sector. In the third quarter of 2026, total commercial bank reserves stand at $3.18 trillion. While aggregate reserves remain above the Federal Reserve estimated ample reserve threshold of $3.05 trillion, their uneven distribution across the domestic banking system has produced localized settlement friction. Primary dealer net inventories of Treasury securities have expanded to $342 billion, requiring continuous overnight repo financing that collides with regulatory balance sheet constraints under the Supplementary Leverage Ratio (SLR).
2. The Net System Liquidity Framework: SOMA Contraction and Liability Mechanics
To analyze the macroeconomic impact of quantitative tightening, institutional analysts cannot rely solely on broad money aggregates such as M2. Instead, sovereign liquidity must be evaluated through the Net System Liquidity equation, which defines the precise volume of central bank assets available to support private settlement liquidity and commercial banking intermediation:
In this operational framework, Federal Reserve total assets represent the asset side of the central bank ledger. The Treasury General Account and the Overnight Reverse Repo facility represent liabilities that quarantine cash away from commercial banks. When either the TGA or RRP increases, net liquidity contracts. Conversely, when the Treasury spends cash or money funds withdraw capital from RRP, net liquidity expands.
As documented in Figure 1, the total assets held by the Federal Reserve have declined from $8.96 trillion at the start of quantitative tightening to $6.92 trillion in September 2026. Net system liquidity, which reached a high of $6.48 trillion in early 2022, currently measures $5.957 trillion ($6.92 trillion total assets minus $815 billion TGA minus $148 billion RRP). This reflects a structural contraction of $523 billion over the past 24 months, representing a disciplined, measured withdrawal of central bank accommodation.
| Balance Sheet Variable | Peak Cycle Value | September 2025 Level | September 2026 Current | Total Cycle Variance |
|---|---|---|---|---|
| Federal Reserve Total Assets | $8.96 Trillion | $7.48 Trillion | $6.92 Trillion | -$2.04 Trillion (-22.8%) |
| Overnight Reverse Repo (RRP) | $2.45 Trillion | $380 Billion | $148 Billion | -$2.302 Trillion (-93.9%) |
| Treasury General Account (TGA) | $910 Billion | $740 Billion | $815 Billion | +$75 Billion (Post-Sept 15 Tax) |
| Commercial Bank Reserves | $4.25 Trillion | $3.32 Trillion | $3.18 Trillion | -$1.07 Trillion (-25.2%) |
| Net System Liquidity | $6.48 Trillion | $6.36 Trillion | $5.957 Trillion | -$523 Billion (-8.1%) |
The core finding from this balance sheet accounting is that while the Federal Reserve balance sheet contracted by $2.04 trillion, commercial bank reserves fell by only $1.07 trillion over the same period. The $970 billion differential was absorbed entirely by the drain of the Overnight Reverse Repo facility, which acted as a shock absorber. Because that buffer is now substantially depleted, the future trajectory of SOMA runoff will transmit directly into depository reserve balances.
3. The Exhaustion of the Overnight Reverse Repo Buffer
The Overnight Reverse Repurchase Agreement facility served as the primary mechanism through which excess liquidity was quarantined between 2021 and 2023. Money market funds (MMFs), facing a dearth of high-yielding Treasury bills and negative real yields on bank commercial paper, deposited trillions of dollars overnight at the Federal Reserve at the administered ON RRP offering rate.
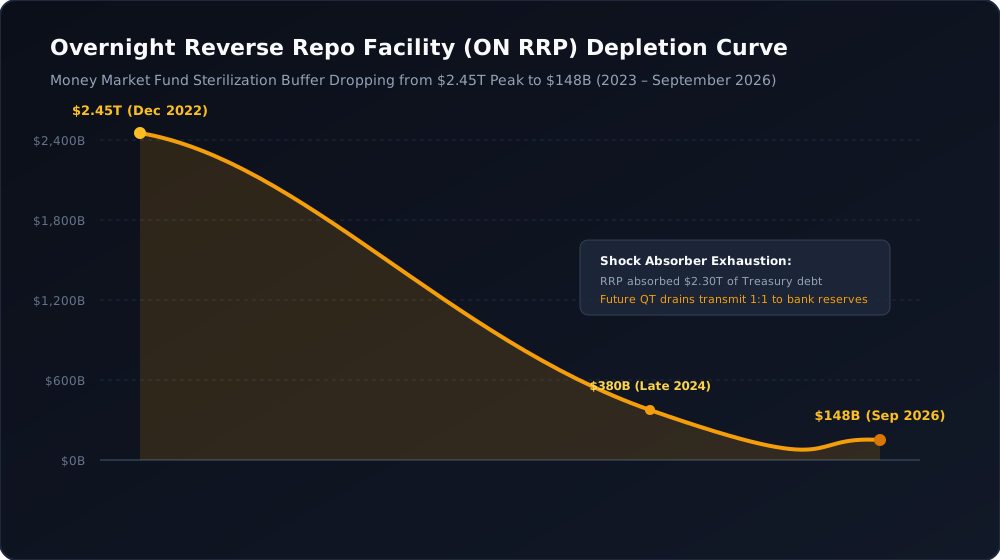
As illustrated in Figure 2, the facility experienced a steady drawdown throughout 2023 and 2024. When the Treasury ramped up short-term bill issuance following the suspension of the statutory debt ceiling, bill yields traded at a slight premium of 4 to 8 basis points above the ON RRP rate. Institutional money market managers rationally rotated cash out of the central bank facility to capture higher yields on sovereign paper.
By early 2025, the facility had declined to approximately $380 billion. During the subsequent quarters of fiscal year 2026, participation continued to erode, reaching $148 billion in late September 2026. Structural analysis conducted by the Federal Reserve Bank of New York indicates that the remaining $148 billion represents friction-bound balances held by smaller government-only funds, foreign official institutions, and regional institutions with specific collateral mandate restrictions. Functionally, the elastic buffer of non-bank liquidity is exhausted.
4. Treasury General Account Volatility and Sovereign Debt Settlement Drains
While the Federal Reserve determines the pace of asset runoff, the Department of the Treasury dictates the timing and magnitude of short-term liquidity drains through the management of the Treasury General Account. The TGA functions as the operating checking account of the federal government, maintained on the liability ledger of the Federal Reserve.
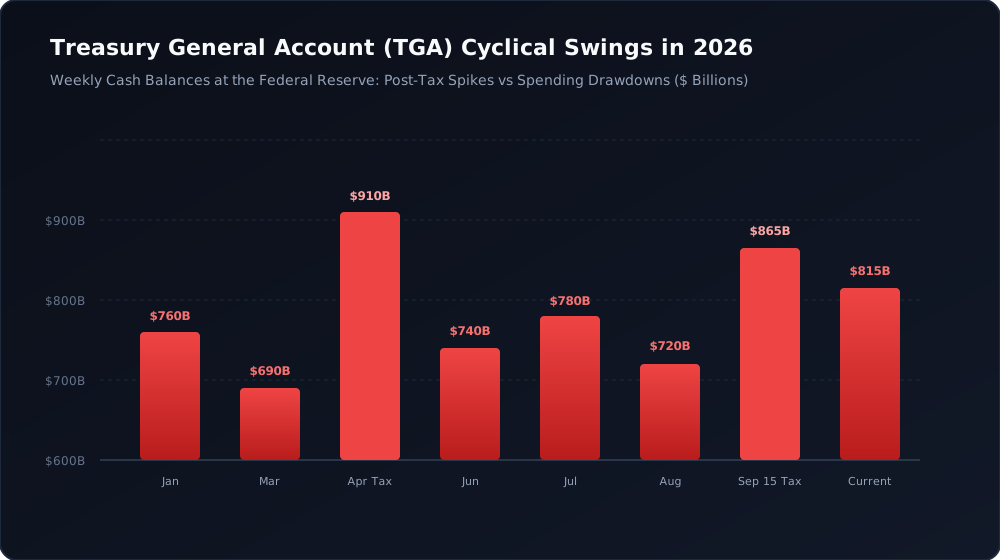
Under formal policy guidance established with the Treasury Borrowing Advisory Committee (TBAC), the Treasury targets an intermediate operational cash balance of $750 billion, designed to buffer against unexpected spending requirements and debt issuance timing mismatches. However, actual TGA balances fluctuate substantially around key calendar deadlines.
As detailed in Figure 3, the TGA experienced a $220 billion surge following the April 2026 individual tax remittance deadline, climbing to $910 billion. Over the subsequent two months, government spending reduced the account balance to $740 billion in June. However, the September 15 corporate tax remittance cycle, paired with large mid-month Treasury coupon auction settlements, injected another wave of tax receipts, driving the cash balance back up to $865 billion. As of late September 2026, the balance stands at $815 billion.
When the Treasury General Account expands by $125 billion in a concentrated two-week window, that cash is drawn directly out of commercial bank depositor accounts into the Federal Reserve. For the banking system, this represents an immediate drain of reserve balances, creating acute cash demand at primary dealer repo desks and regional bank treasury departments.
5. Bank Reserves Approaching the Structural Ample Reserves Threshold
Under the Federal Reserve operating framework established post-2008, monetary policy is implemented in an ample reserves regime. In this framework, the central bank maintains an aggregate quantity of bank reserves sufficiently large that overnight interest rates are controlled via administered rates (the IORB and ON RRP rates) without requiring frequent open market fine-tuning operations.
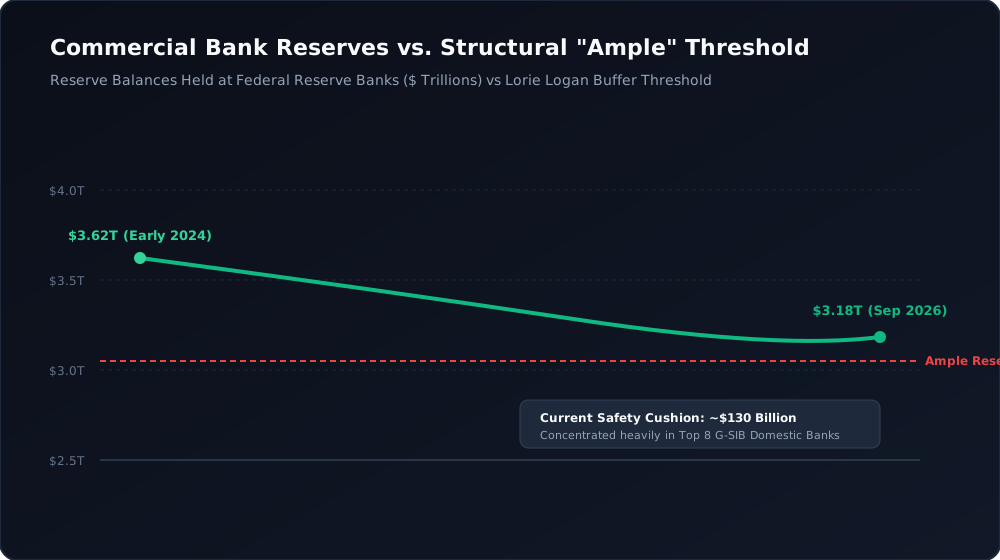
The central question confronting monetary authorities is defining the precise numerical boundary of the ample reserve threshold. In seminal research presented by Federal Reserve officials and confirmed by former New York Fed SOMA manager Lorie Logan, the lowest comfortable level of reserves (LCLOR) is estimated between 10% and 11% of nominal United States Gross Domestic Product (GDP). With annualised United States GDP measuring approximately $28.80 trillion in 2026, the structural ample reserve floor is calculated at $3.05 trillion.
As plotted in Figure 4, current commercial bank reserve balances stand at $3.18 trillion. This provides an aggregate safety buffer of approximately $130 billion above the estimated structural floor. However, aggregate figures obscure a critical structural asymmetry: reserve concentration.
| Banking Sector Category | Number of Institutions | Total Reserves Held | Share of Aggregate Reserves | Operational Liquidity Profile |
|---|---|---|---|---|
| Global Systemically Important Banks (G-SIBs) | 8 | $2.035 Trillion | 64.0% | Surplus reserves, regulatory SLR constraints |
| Large Domestic Commercial Banks | 24 | $668 Billion | 21.0% | Near internal LCR targets, inelastic sellers |
| Regional and Community Banks | 4,100+ | $477 Billion | 15.0% | Active borrowers in FHLB and fed funds |
| Total Banking System | 4,130+ | $3.18 Trillion | 100.0% | Aggregate cushion: $130B above LCLOR |
Because the top eight domestic G-SIBs hold 64.0% of total reserves, the remaining 4,120+ commercial banks operate with aggregate reserves of just $1.145 trillion. The large G-SIBs face strict regulatory constraints under the Liquidity Coverage Ratio (LCR), Resolution Liquidity Adequacy and Positioning (RLAP), and the Supplementary Leverage Ratio. Consequently, these institutions cannot freely lend excess reserves into the overnight repo market during settlement crunches without incurring balance sheet capital charges. The effective, friction-free reserve cushion is therefore measurably narrower than the headline $130 billion figure suggests.
6. Repo Rate Friction: SOFR-IORB Spread Inversions and Liquidity Dispersion
The most direct empirical evidence of balance sheet tightening appears in money market spread dispersion. In a perfectly frictionless monetary system with abundant reserves, the Secured Overnight Financing Rate (SOFR)—which measures the cost of borrowing cash overnight collateralized by Treasury securities—trades 2 to 4 basis points below the Interest on Reserve Balances (IORB), reflecting the risk-free, collateralized nature of the trade relative to unsecured bank deposits.
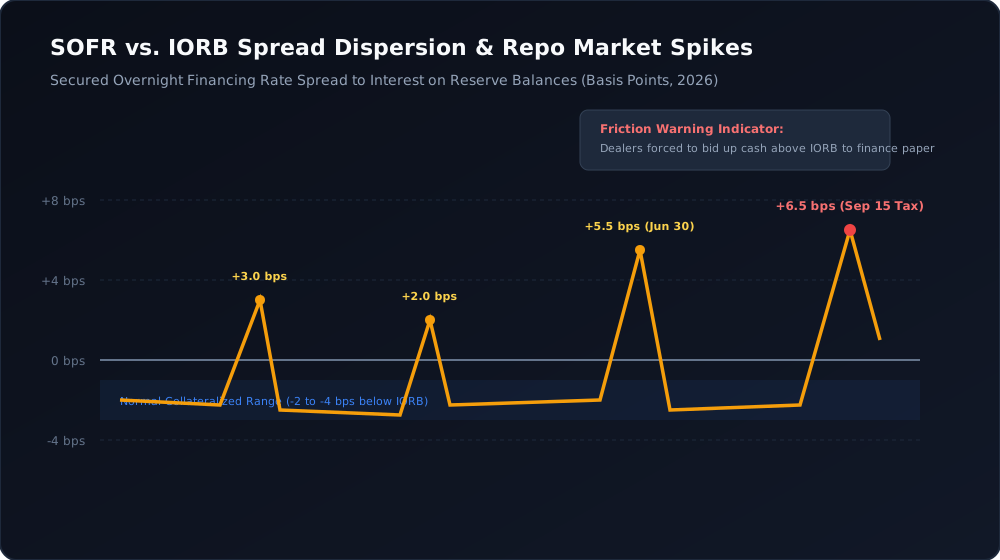
Throughout the early phase of quantitative tightening, SOFR traded consistently within its historical corridor below IORB. However, as documented in Figure 5, the spread dynamic has decoupled during major settlement dates in 2026. On June 30, the SOFR-IORB spread surged to +5.5 basis points above IORB. More recently, during the September 15 corporate tax remittance date, which coincided with the settlement of $120 billion in Treasury 3-year, 10-year, and 30-year bond auctions, SOFR spiked to +6.5 basis points above IORB.
Detailed analysis of DTCC FICC GCF Repo indices reveals that intraday 99th-percentile repo trades printed as high as 22 basis points above IORB during the late afternoon clearing window on September 15. While these spread spikes subsided within 48 hours as tax receipts flowed back into money market funds through government agency disbursements, their frequency and magnitude have escalated steadily across each subsequent quarter of 2026.
7. Primary Dealer Sovereign Inventory Accumulation and SLR Balance Constraints
To understand why repo spreads invert during Treasury settlement dates, analysts must examine the balance sheets of the 24 primary dealers designated by the Federal Reserve Bank of New York. Primary dealers are legally obligated to bid competitively at all United States Treasury debt auctions, underwriting the fiscal borrowing requirements of the federal government.
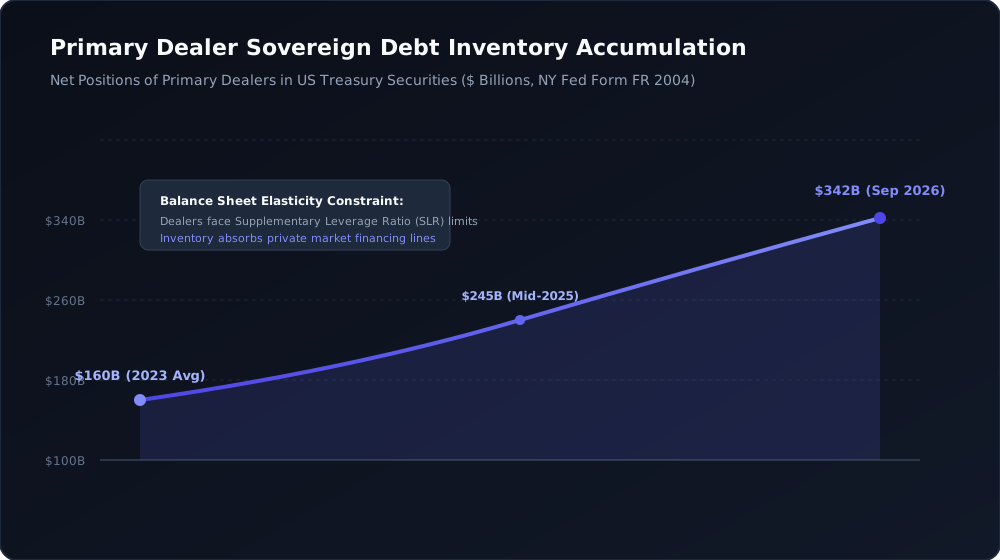
With annual federal fiscal deficits exceeding $1.90 trillion in fiscal year 2026, the Department of the Treasury has expanded auction sizes across all benchmark tenors. As shown in Figure 6, primary dealer net inventory of Treasury notes, bonds, and bills has surged from an average of $160 billion in 2023 to $342 billion in late September 2026.
Primary dealers do not hold these securities as permanent investments; they warehouse them temporarily while distributing them to institutional investors, pension funds, and foreign central banks. To warehouse $342 billion in debt, dealers must finance their positions daily in the tri-party and bilateral repo markets. Each dollar of inventory requires a corresponding dollar of overnight financing.
However, dealer balance sheet capacity is constrained by the Supplementary Leverage Ratio, which mandates that bank-affiliated dealers maintain a minimum Tier 1 capital ratio of 5% (and 6% for holding company parent entities) against all on-balance-sheet assets, regardless of risk weighting. Because Treasuries and reverse repos carry a 0% risk weight under risk-based capital rules but are fully counted under the SLR, holding sovereign debt consumes scarce equity capital. When auction settlement waves hit dealer balance sheets simultaneously, dealer repo desks reach their internal leverage limits, forcing them to bid aggressively for private cash.
8. The Standing Repo Facility (SRF): Backstop Capacity, Stigma, and Structural Limits
In response to the historic repo market dislocation of September 2019, when overnight borrowing rates briefly surged to 10.0%, the Federal Open Market Committee created the Standing Repo Facility (SRF) in July 2021 as a permanent liquidity backstop. The SRF allows eligible counterparties to exchange Treasury, agency debt, and agency mortgage-backed securities for overnight cash directly with the Federal Reserve.
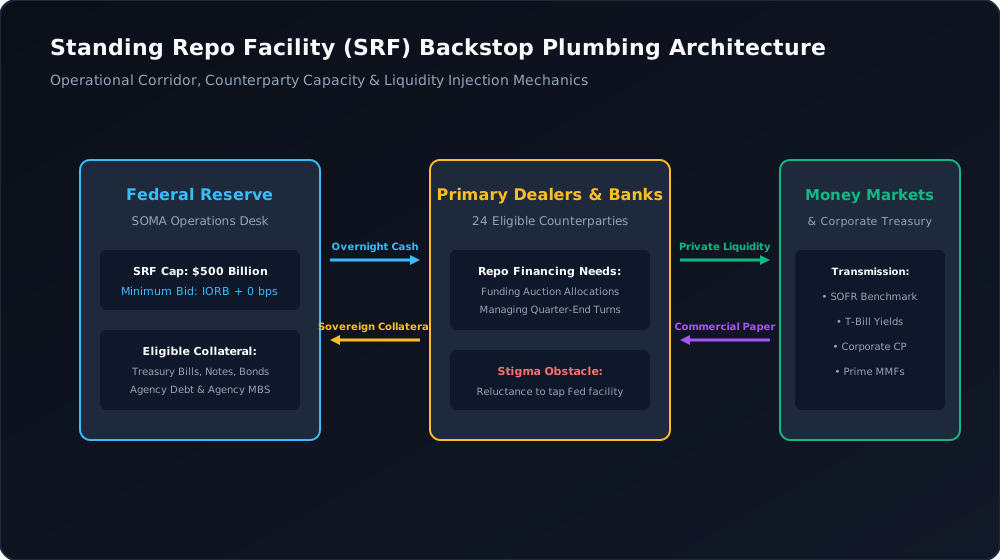
The operational parameters of the Standing Repo Facility, mapped in Figure 7, define its role in the monetary plumbing:
- Total Program Capacity: The facility provides up to $500 billion in overnight liquidity per daily operation.
- Minimum Bid Rate: Set equal to the top of the target range for the federal funds rate (or IORB + 0 bps), ensuring that institutions only utilize the facility when private market repo rates trade at or above the policy rate ceiling.
- Eligible Counterparties: All 24 primary dealers, alongside expanded depository institutions that meet specific asset and regulatory criteria (currently 29 commercial banks).
- Eligible Collateral: United States Treasury bills, notes, bonds, TIPS, agency debentures, and agency residential and commercial mortgage-backed securities.
Despite the presence of the SRF, utilization has remained negligible during the spread spikes of 2026, averaging less than $1.2 billion per turn. Two primary structural frictions explain this reluctance:
First, operational stigma remains an obstacle. While the Fed explicitly designed the SRF to serve as an ordinary market-making backstop rather than a discount window rescue tool, bank compliance officers and risk committees remain wary that tapping a Federal Reserve liquidity facility will be perceived by supervisors or rating agencies as an indicator of internal funding distress.
Second, counterparty access is restricted. Non-bank financial intermediaries—such as hedge funds executing Treasury basis trades, independent mortgage originators, and non-dealer brokerages—do not have direct access to the SRF. When non-bank entities experience collateral financing squeezes, they must rely on primary dealers to intermediate. If primary dealers are balance-sheet constrained by SLR rules, they cannot intermediate SRF liquidity to the private market without expanding their gross balance sheets.
9. The Four-Stage Macro Transmission Horizon: From Sovereign Ledgers to Corporate Valuations
The central strategic insight for institutional portfolio management is recognizing that sovereign liquidity shifts operate as a multi-month macro backdrop rather than an intraday trading signal. The historical evidence from prior tightening cycles demonstrates that balance sheet contraction filters through the financial system across four sequential transmission phases over a 16-to-20 week horizon.
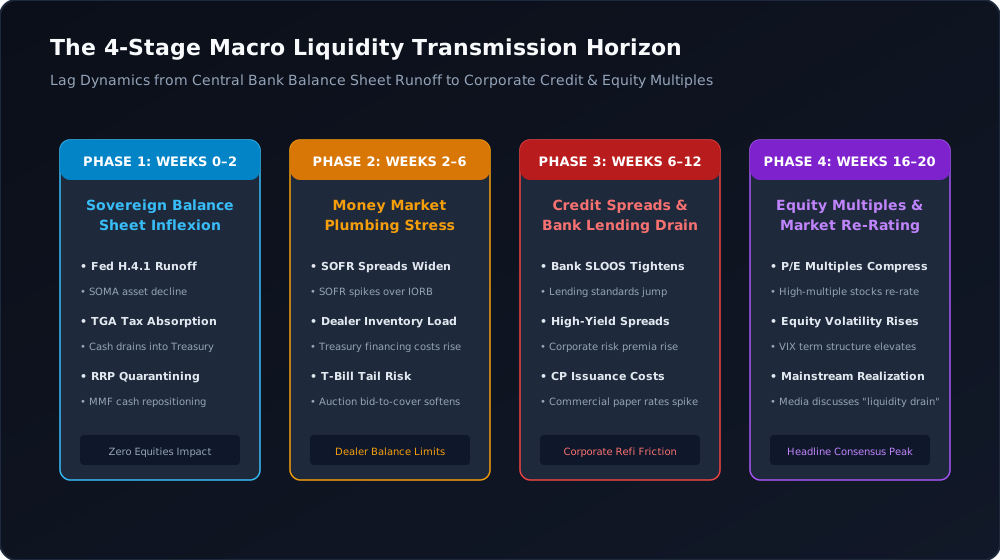
As diagrammed in Figure 8, the transmission mechanism progresses through the following distinct stages:
Phase 1: Sovereign Balance Sheet Inflexion (Weeks 0 to 2)
The initial impact is confined strictly to official accounting ledgers: the weekly Federal Reserve H.4.1 statement records SOMA portfolio runoff, Treasury Daily Statements reflect TGA tax absorption, or the New York Fed reports RRP contraction. At this juncture, broader equity and corporate debt markets exhibit virtually zero price discovery reaction. Retail sentiment, corporate earnings, and high-yield spreads remain unaffected.
Phase 2: Money Market Plumbing Stress (Weeks 2 to 6)
As commercial bank reserves decline, primary dealers encounter rising capital costs to finance their inventory of newly auctioned Treasury debt. Spreads between SOFR and IORB invert into positive territory. Treasury bill auction bid-to-cover ratios soften, and tier-2 commercial paper rates for non-financial corporations creep upward. Bank treasury desks begin trimming discretionary lending lines in the interbank market.
Phase 3: Credit Spreads and Bank Lending Contraction (Weeks 6 to 12)
Compressed bank reserves translate into tighter credit conditions across the private economy. In the Federal Reserve Senior Loan Officer Opinion Survey on Bank Lending Practices (SLOOS), commercial banks report raising interest rate spreads on commercial and industrial (C&I) loans, increasing collateral requirements, and restricting credit card line expansions. High-yield corporate bond spreads widen by 35 to 65 basis points as debt refinancing costs adjust higher.
Phase 4: Equity Valuation Multiple Re-Rating (Weeks 16 to 20)
Only after higher funding costs and restricted credit access permeate the corporate sector do equity valuation multiples experience systematic repricing. Forward price-to-earnings (P/E) ratios compress, high-beta growth equities undergo multiple compression, and realized equity volatility elevates. Mainstream financial commentary begins actively highlighting a "liquidity squeeze," even though the sovereign balance sheet inflection occurred four to five months earlier.
10. Institutional Conclusions and Strategic Implications for Capital Allocation
The structural audit of United States sovereign liquidity in the third quarter of 2026 establishes five foundational conclusions for macroeconomic analysts, treasury executives, and institutional asset allocators:
- The Exhaustion of the Non-Bank Cash Buffer: With the Overnight Reverse Repo facility resting at $148 billion, the liquidity cushion that absorbed over $2.30 trillion of quantitative tightening has effectively vanished. Future SOMA balance sheet contraction will translate directly into a dollar-for-dollar drain on commercial bank reserves.
- Narrowing Margin for Error in Reserve Plumbing: Commercial bank reserves at $3.18 trillion are operating just $130 billion above the estimated ample reserve threshold of $3.05 trillion. Because 64.0% of reserves are concentrated within the top eight domestic G-SIBs, regulatory capital constraints (SLR and LCR) prevent surplus liquidity from circulating smoothly to regional banks and primary dealers during settlement pinches.
- Escalating Repo Rate Spread Volatility: The repeated inversion of the SOFR-IORB spread, which reached +6.5 basis points on September 15, confirms that the secured funding market is encountering structural balance sheet constraints. Month-end and quarter-end settlement turns will continue to produce rate spikes until the pace of quantitative tightening is further tapered or halted.
- Primary Dealer Inventory Saturation: Primary dealer holdings of Treasury debt have surged to $342 billion, driven by $1.90 trillion annual fiscal deficit financing. This inventory overhang consumes dealer balance sheet capacity, increasing underwriting risk and raising the cost of capital for corporate issuers reliant on commercial paper and syndicated loans.
- The Transmission Horizon Reality: Sovereign liquidity operates as a slow-moving monetary tide. When net liquidity contracts from $6.48 trillion to $5.957 trillion over a two-year horizon, asset class valuations face persistent downward pressure on valuation multiples. Portfolio managers must position for tighter financing conditions well before headline consensus recognizes the turn.
By monitoring the balance sheet interactions between the Federal Reserve, the Department of the Treasury, and primary dealer funding markets, institutional investors can navigate the shifting monetary currents with empirical precision, avoiding the traps of superficial narrative commentary.