Data Center Energy Stocks: Tracking Utility Generation, Air Permits, and High-Voltage Grid Interconnection for AI Compute
An empirical investigation into how institutional quantitative funds track data center energy stocks through high-voltage substation telemetry, state air permits, and long-term clean power purchase agreements.
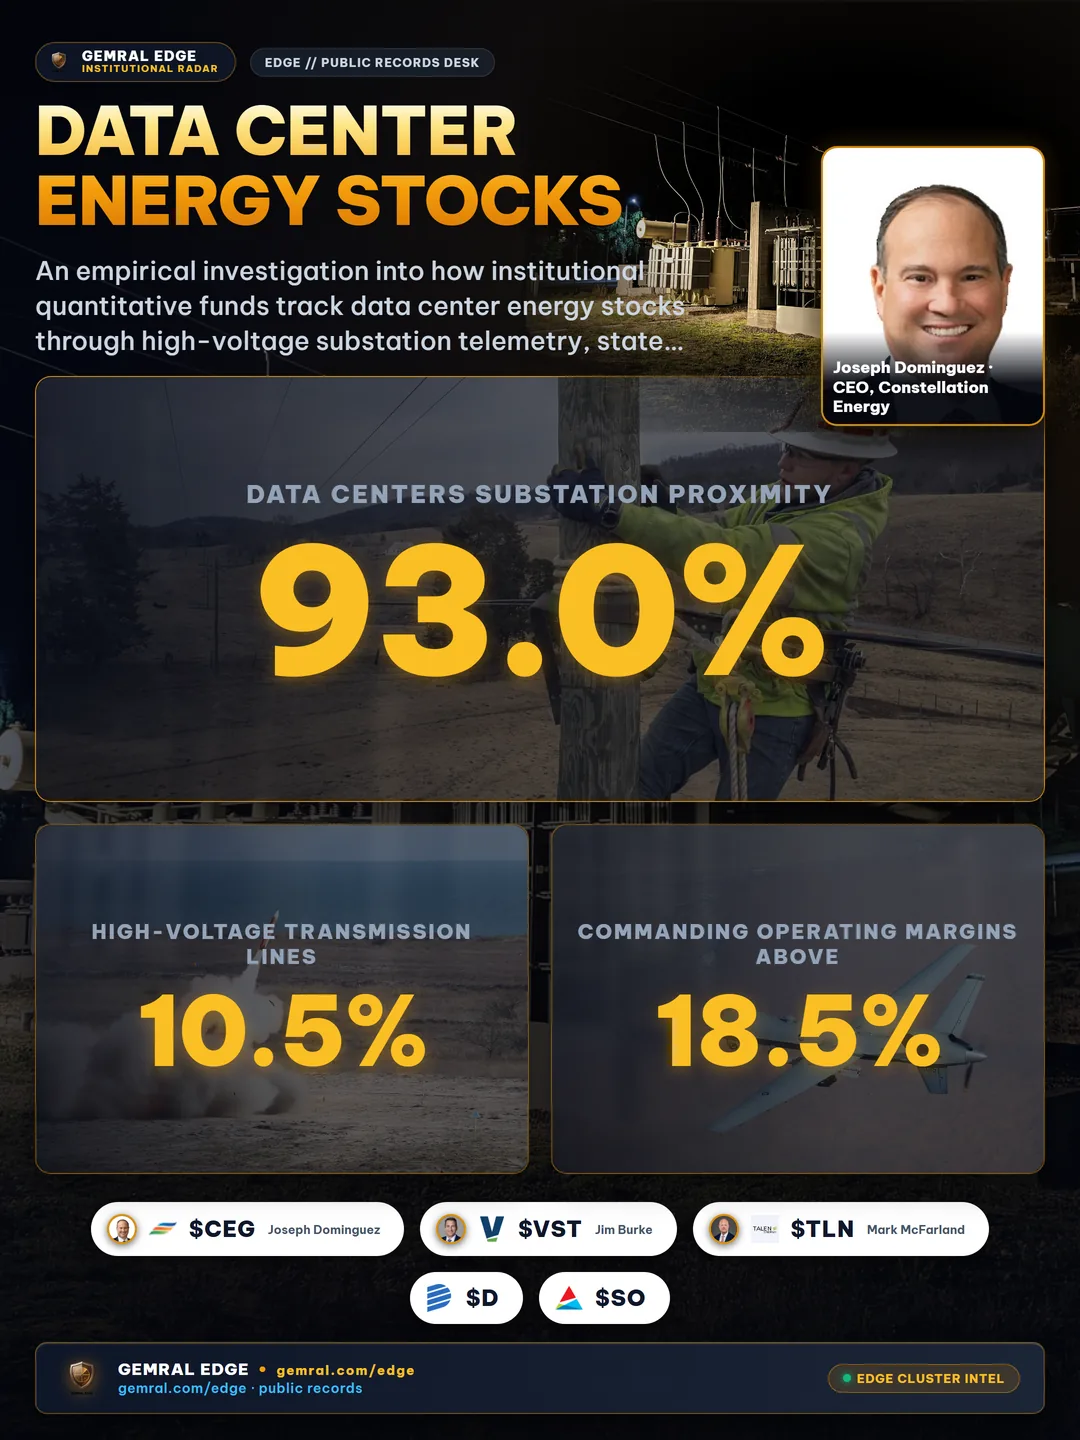
The explosive buildout of accelerated compute clusters has fundamentally shifted the bottleneck of artificial intelligence from semiconductor fabrication to bulk electricity delivery. Across public equity markets, institutional capital is aggressively rotating into data center energy stocks—a specialized cross-section of regulated electric utilities, independent power producers (IPPs), and high-voltage transmission equipment manufacturers that supply the massive electrical power required to energize modern AI data center campuses.
Yet, public equity valuation multiples in the AI power sector are increasingly detached from physical reality. Equity analysts frequently model multi-gigawatt power additions based on corporate slide decks and preliminary letters of intent, neglecting the multi-year regulatory hurdles, transformer procurement backlogs, and environmental air permitting delays that govern real-world grid interconnections. To separate structural infrastructure winners from speculative press releases, institutional investors track verifiable physical telemetry via our hub for AI Data Center Power and Grid Transformer Stocks and explore point-in-time machine feeds through the Data Preview terminal.
Mapping Data Center Energy Stocks Across Utility Generation and AI Compute Loads
To accurately evaluate data center energy stocks, quantitative researchers must map publicly traded equity tickers across the complete electric power supply chain. High-density compute facilities housing tens of thousands of accelerated GPUs operate at power densities exceeding 40 kW to 100 kW per rack, transforming individual data center campuses into 300 MW to 1,200 MW continuous baseload consumers. This immense scale requires a synchronized network of energy providers spanning three core equity categories:
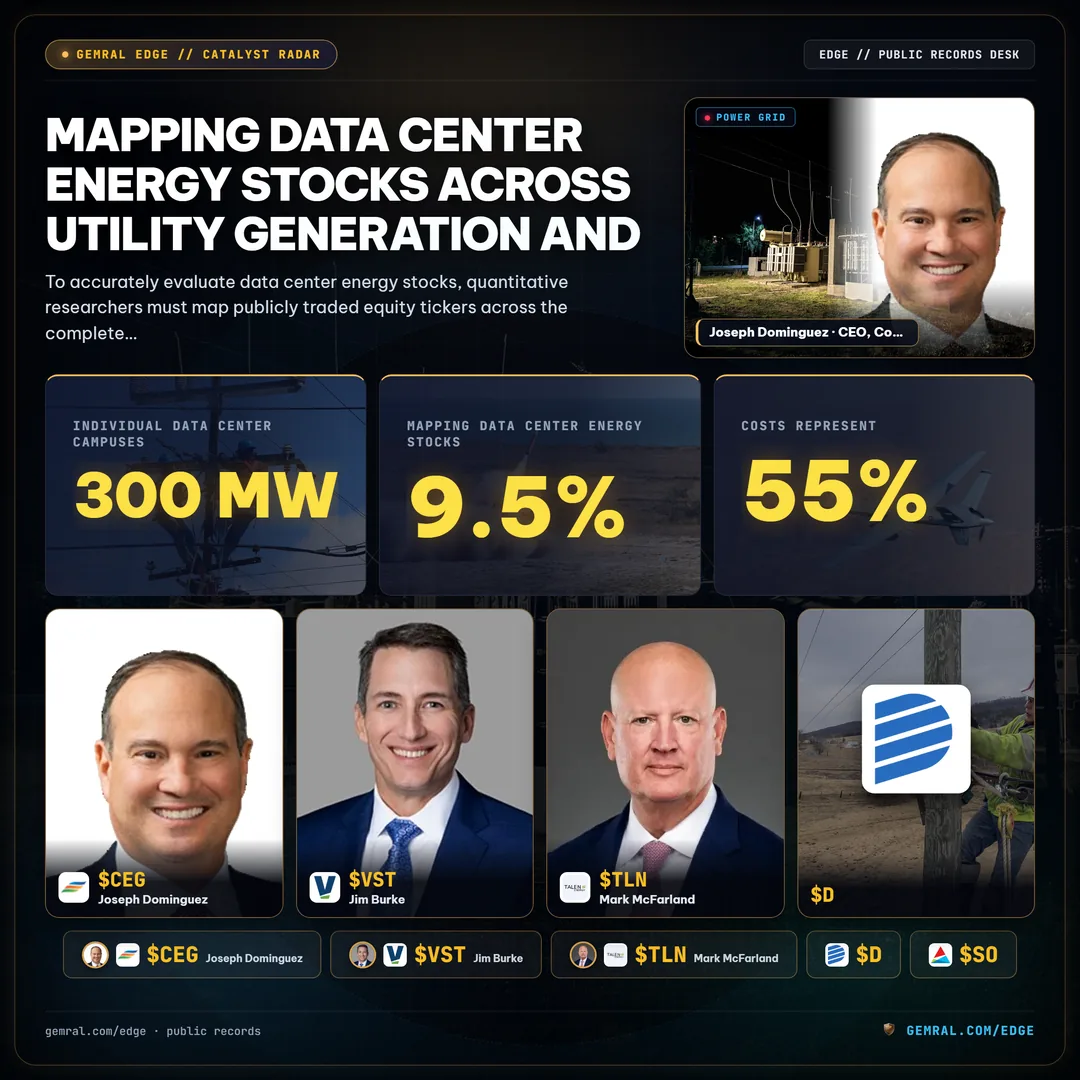
- Independent Power Producers (IPPs): Unregulated merchant power generators that own baseload nuclear, combined-cycle natural gas, and geothermal assets. Companies such as Constellation Energy (NASDAQ: CEG), Vistra Corp (NYSE: VST), and Talen Energy (NASDAQ: TLN) can negotiate direct, bilateral long-term power purchase agreements (PPAs) with hyperscale cloud operators, capturing wholesale power price premiums without public utility commission rate-base caps.
- Regulated Electric Utility Holding Companies: Monopolistic regional grid operators including Dominion Energy (NYSE: D), Southern Company (NYSE: SO), American Electric Power (NASDAQ: AEP), and Entergy (NYSE: ETR). These utilities monetize AI data center power demand through massive multi-billion-dollar capital expenditure programs approved by state regulators, earning an authorized return on equity (ROE) of 9.5% to 10.5% on newly constructed high-voltage transmission lines, substations, and generation plants.
- Electrical Grid and Power Equipment Manufacturers: Industrial suppliers producing critical grid hardware, including GE Vernova (NYSE: GEV), Eaton Corporation (NYSE: ETN), Hubbell (NYSE: HUBB), and Schneider Electric. These companies provide high-voltage step-down transformers, switchgear, and substation busbars, commanding operating margins above 18.5% amid historic multi-year delivery lead times.
Quantitative analysis reveals that energy costs now represent over 55% to 65% of the total 10-year total cost of ownership (TCO) for accelerated data center campuses. Consequently, hyperscalers like Microsoft, Amazon Web Services, Alphabet, and Meta are willing to pay forward capacity premiums exceeding $95 to $115 per megawatt-hour (MWh) for guaranteed 24/7 carbon-free baseload energy, creating unprecedented earnings visibility for merchant generators with uncontracted nuclear capacity.
The Physical Bottleneck: High-Voltage Substations, Transformer Lead Times, and Interconnection Queues
While corporate announcements often project rapid campus energization schedules, the physical timeline of electrical infrastructure is governed by strict engineering constraints. Connecting a 500 MW AI data center campus to the regional transmission grid requires dedicated high-voltage substation interconnections operating at 115 kV, 230 kV, or 500 kV.
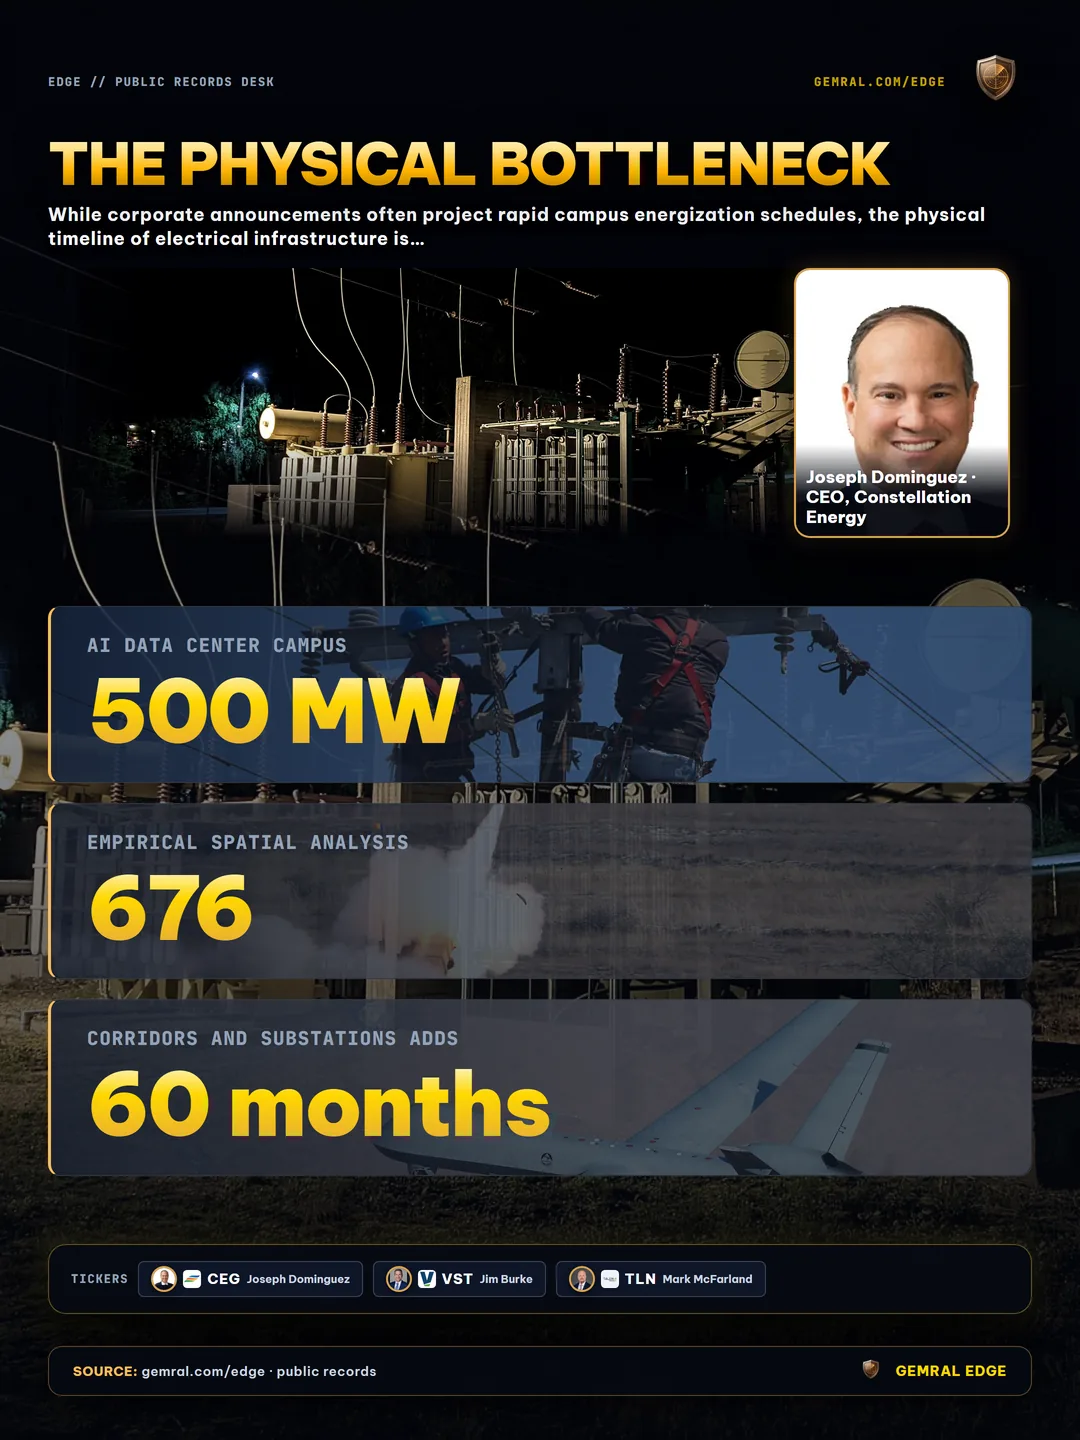
Empirical spatial analysis across 676 tracked US data center campuses demonstrates that 93.0% of operational and planned facilities sit within close proximity to a high-voltage substation, with a median physical distance of just 1.02 km. For campuses situated beyond 3 km from existing high-voltage infrastructure, constructing dedicated transmission corridors and substations adds 36 to 60 months of permitting, right-of-way acquisition, and construction delay, severely degrading projected return on invested capital (ROIC). Researchers tracking regional grid bottlenecks frequently cross-reference our investigation into Data Center Substation Interconnection Capacity.
The primary physical chokepoint delaying grid energization is the historic procurement backlog for extra-high-voltage (EHV) power transformers (rated at ≥345 kV). Industry lead times for large step-down transmission transformers have expanded from an average of 115 weeks in 2021 to over 190 to 240 weeks in late 2026. This equipment shortage is exacerbated by heavy reliance on specialized electrical steel imports and overseas manufacturing capacity, as detailed in our analysis of Data Center Transformers and Lead Times.
Furthermore, regional transmission organization (RTO) interconnection queues have ballooned to historic proportions. In major balancing authorities such as PJM Interconnection (covering Northern Virginia, Ohio, and Pennsylvania), Midcontinent ISO (MISO), and ERCOT in Texas, thousands of generation and large load interconnection requests remain stalled in multi-year system impact studies. Investors tracking data center energy stocks must monitor whether a utility's projected load growth reflects finalized engineering interconnection agreements or merely speculative exploratory queue filings that face a 72% historical withdrawal rate.
Empirical Verification: Point-in-Time Air Permits and Backup Generator Telemetry Across Key States
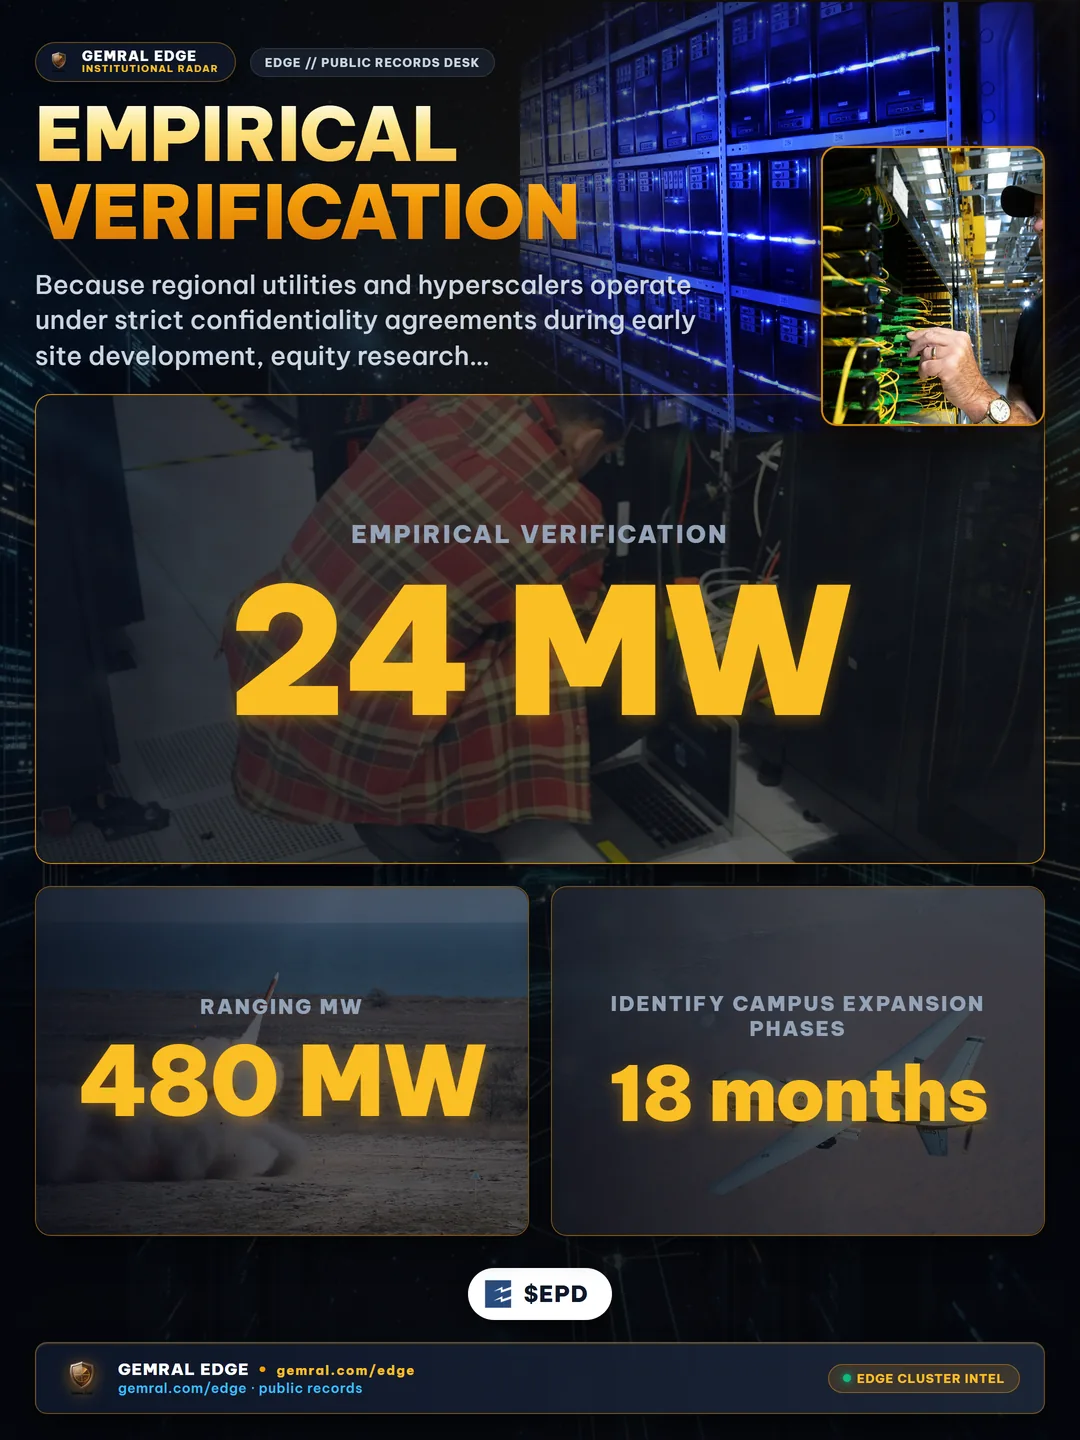
Because regional utilities and hyperscalers operate under strict confidentiality agreements during early site development, equity research desks relying on public press releases remain systematically behind the information curve. The earliest verifiable public indicator of data center campus power capacity appears in environmental air quality permitting filings.
Modern data centers maintain on-site emergency diesel and natural gas generators to ensure continuous runtime during utility grid interruptions. Because these reciprocating internal combustion engines emit nitrogen oxides (NOx), carbon monoxide (CO), and particulate matter, operators are legally mandated by the Clean Air Act to obtain stationary source air permits from state environmental protection agencies prior to equipment installation and commissioning.
By systematically monitoring dated air permit applications, draft permits, and final minor New Source Review (NSR) or Title V permits, institutional analysts track empirical backup power deployment across key data center clusters:
- Virginia: The Department of Environmental Quality (DEQ) maintains comprehensive stationary source permitting registries. In northern regional corridors, campus air permits reveal aggregate on-site generator installations ranging from 24 MW to over 480 MW per campus. Tracking these dated filings allows researchers to identify campus expansion phases 9 to 18 months before commercial IT energization.
- Georgia: The Georgia Environmental Protection Division (EPD) issues air quality permits for rapidly expanding hyperscale clusters in Douglas and Fulton counties, recording specific generator engine make, model, and kilowatt ratings.
- Texas & Arizona: State registries from the Texas Commission on Environmental Quality (TCEQ) and Arizona Department of Environmental Quality (ADEQ) document massive industrial generator deployments across ERCOT and the desert Southwest, pairing environmental filings with regional water-cooling authorizations.
- Ohio: Federal air program registrations under the EPA provide independent facility verification across central Ohio compute hubs where state-level unified permit portals are unavailable.
Essential Methodological Disclosure: Permitted backup-generator MW is an upper bound on on-site backup capacity, not IT load; we do not convert it. Backup generators provide emergency contingency power for mission-critical IT racks, chillers, and auxiliary pumps during grid failure; real-time operational IT load depends on server utilization, power usage effectiveness (PUE), and active compute workloads.
For an in-depth breakdown of backup generation telemetry and emissions monitoring, explore our technical study on Data Center Backup Generators.
Commercial Offtake Economics: Nuclear PPAs, Behind-the-Meter Power, and Long-Term Utility Tariffs
The commercial architecture connecting data center energy stocks to hyperscale customers is undergoing a rapid evolution. Historically, data centers purchased power under standard commercial utility tariffs, paying retail industrial rates structured by state regulators. However, the sheer magnitude of AI cluster loads has rendered traditional retail structures inadequate, driving the adoption of specialized bilateral power contracts:

| Contract Structure | Primary Beneficiaries | Economic Mechanism | Grid Risk Profile |
|---|---|---|---|
| Behind-the-Meter (BTM) Nuclear PPA | Merchant Nuclear IPPs (CEG, TLN) | Co-located compute campus receives direct power from reactor busbar; fixed pricing at $85–$105/MWh. | Avoids transmission tariffs; subject to FERC co-location and transmission diversion scrutiny. |
| Front-of-the-Meter Virtual Clean PPA | Renewable Developers & Solar IPPs | Financial contracts-for-difference settling against wholesale locational marginal prices (LMP). | Full exposure to regional grid congestion, intermittency, and transmission wheeling charges. |
| Dedicated Large-Load Utility Tariffs | Regulated Utilities (D, AEP, SO) | Specialized rate-riders mandating minimum take-or-pay capacity charges and 10-year capital cost recovery. | Guaranteed utility ROE (9.8%–10.4%); consumer ratepayer protection clauses prevent stranded asset risk. |
| On-Site Reciprocating Gas & Fuel Cells | Gas Turbine & Fuel Cell Vendors (BE, CAT) | Distributed continuous generation bypassing grid interconnect delays entirely; premium capital cost ($1,800/kW). | Subject to local pipeline gas supply constraints and air quality emissions caps. |
The economic divergence between these structures directly impacts equity returns. Behind-the-meter nuclear co-location deals offer merchant generators massive EBITDA expansion with zero transmission wheeling fees. However, regulatory scrutiny by the Federal Energy Regulatory Commission (FERC) regarding cost-shifting onto ordinary retail consumers highlights the ongoing institutional risks facing merchant nuclear contracts.
Conversely, regulated utilities are successfully instituting large-load tariff schedules that require data center operators to sign 10- to 15-year take-or-pay contracts. These provisions obligate tech companies to pay for 80% to 90% of their requested transmission capacity even if compute deployment lags, insulating utility equity investors from technological obsolescence or cluster relocation.
Regulated Utilities vs Independent Power Producers: Mapping Equity Exposure Across the AI Power Chain
When constructing an investment thesis around data center energy stocks, institutional portfolio managers must balance the differing risk-return profiles of regulated electric utilities against independent power producers:
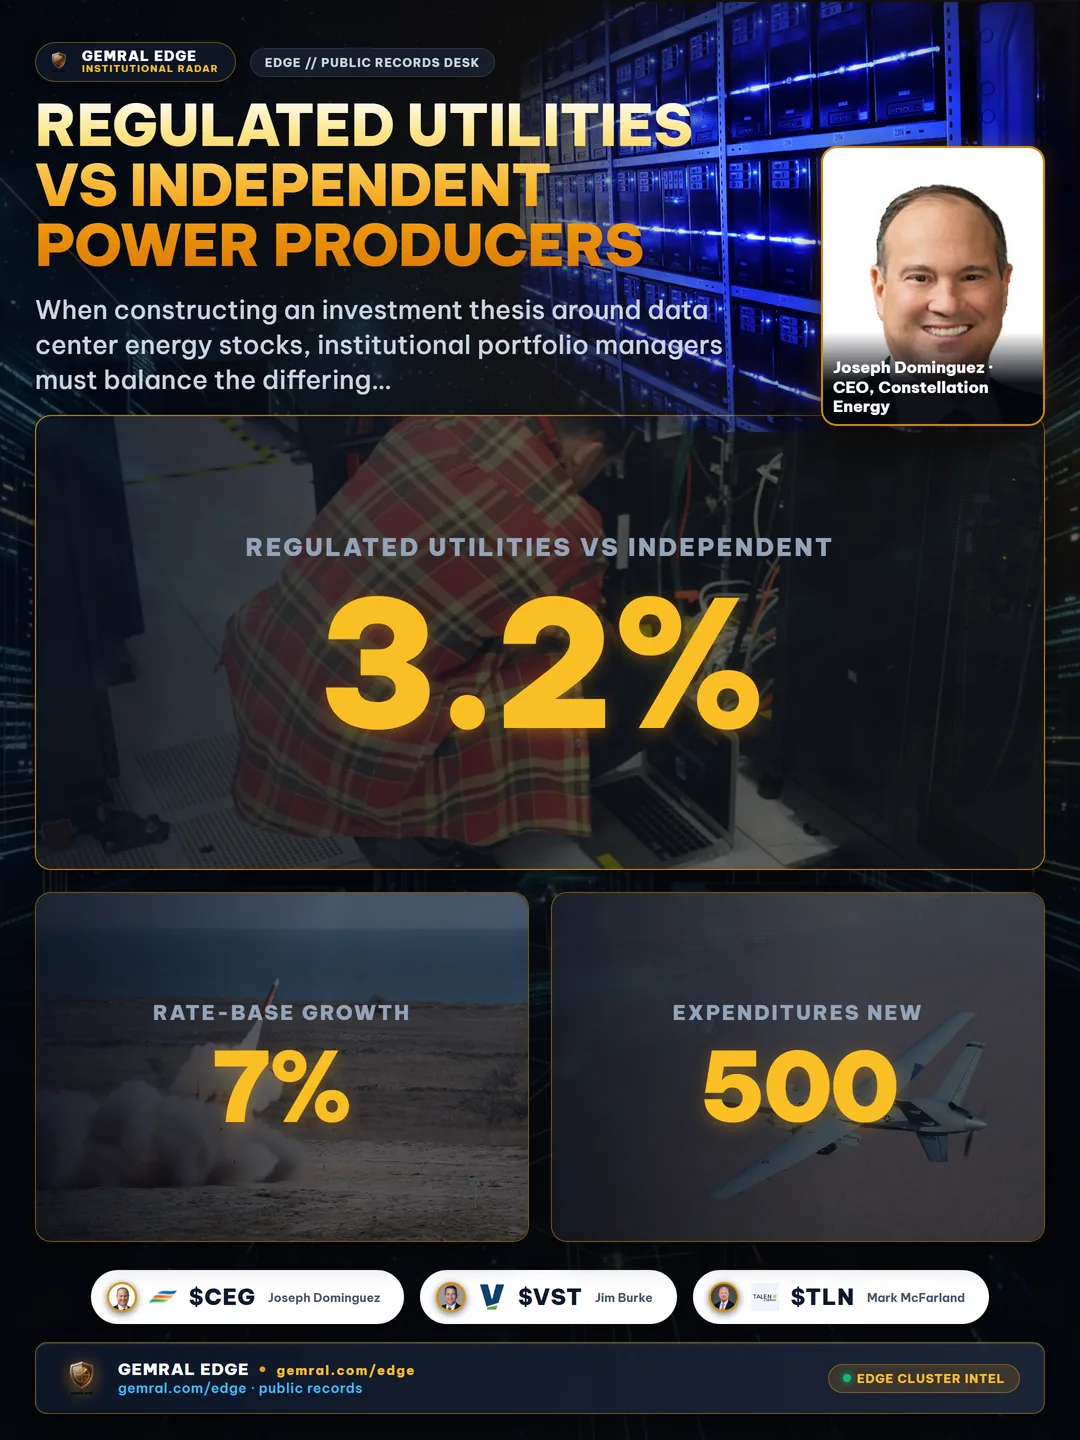
Equity Risk-Reward Comparison Matrix
Utilities provide stable dividend yields (typically 3.2% to 4.5%) combined with rate-base growth of 7% to 9% per year. Because capital expenditures on new 500 kV transmission lines and peaking gas plants are added directly to the regulated rate base, earnings visibility is exceptionally high. However, equity valuation multiples are capped by state regulatory commissions that seek to prevent retail rate spikes. If a utility's state regulator denies capital expenditure recovery, projected earnings can stall rapidly.
Merchant power producers operate with high operational leverage to wholesale power prices and capacity auction clearings. In the PJM 2025/2026 Base Residual Auction, capacity prices surged by over 800% to $269.92 per MW-day (compared to $28.92 per MW-day in the prior year), driven by retiring coal generation and skyrocketing data center demand. This price surge provides merchant generators with multi-billion-dollar unhedged cash flow expansion. However, IPP earnings remain vulnerable to regulatory intervention, commodity gas price volatility, and potential FERC transmission rulings.
High-voltage electrical suppliers operate with zero commodity power price exposure, monetizing the absolute volume of grid construction. With multi-year backlogs stretching into 2029 and 2030, companies producing substation circuit breakers, protective relays, and high-capacity conductors capture structural margin expansion regardless of which utility or hyperscaler wins individual regional power bids.
Institutional Data Hygiene: Point-in-Time Parcel Ownership and Machine Feed Verification
The fatal flaw in many alternative data analyses of AI infrastructure is the uncritical use of static property directories and corporate press releases. A data center campus announced by a holding entity or specialized developer often operates under multiple legal layers, corporate shell companies, and joint ventures before a listed hyperscaler assumes tenancy.
Rigorous quantitative modeling requires point-in-time parcel ownership resolution. By linking county tax parcels, commercial land deeds, and dated utility interconnection requests directly to public corporate parents, analysts eliminate look-ahead bias and avoid attributing speculative third-party development projects to public equity balance sheets prematurely.
At Gemral Edge, our physical telemetry engine indexes 49 US-listed AI infrastructure equities across 676 verified campuses, integrating 24 distinct public data tables into point-in-time machine feeds. Institutional subscribers access complete historical datasets via:
- Data Coverage & Density: Review comprehensive historical record counts and telemetry density across the Data Coverage portal.
- Point-in-Time Machine Feeds: Direct Parquet and REST API feeds documented in our Public Datasets directory.
- Subscription Tiers: Standard research tiers start with the Pro package at $39/month, institutional B2B intelligence access at $299/month, and direct machine API integration at $2,000/month. Fund licensing for full point-in-time historical tables is quoted on request by email.
Research Disclaimer & Compliance Statement
Public data · not investment advice. All physical data center telemetry, substation proximity calculations, environmental air permit records, and electrical grid measurements presented in this publication are derived exclusively from publicly accessible municipal, state, and federal regulatory filings. Gemral Edge does not provide investment advisory services or personalized financial recommendations. Past performance, regulatory queue filings, and historical grid load telemetry do not guarantee future equity market outcomes.
Frequently asked questions
What are data center energy stocks and which sectors are most exposed to AI power growth?
Data center energy stocks are publicly traded companies that generate, transmit, or manage the electrical power required to operate high-density artificial intelligence compute facilities. The primary exposed sectors include independent power producers (such as nuclear and gas turbine operators), regulated electric utilities providing grid interconnections, power equipment manufacturers producing high-voltage transformers and switchgear, and energy infrastructure real estate developers.
How does high-voltage substation proximity impact data center energy stocks?
Proximity to high-voltage substations (operating at 115 kV to 500 kV) dictates the feasibility, speed, and capital expense of connecting gigawatt-scale data center campuses to the regional power grid. Empirical telemetry shows that 93.0% of tracked AI data center campuses sit within close proximity to a high-voltage substation, with a median distance of 1.02 km. Utilities and operators located near established grid nodes experience significantly shorter interconnection queue delays.
Why are state environmental air permits critical for measuring data center power capacity?
Data center campuses require state air permits to install and operate emergency diesel and natural gas backup generators. Tracking air permits across state environmental agencies provides dated, audited public records of total permitted backup-generator megawatt (MW) capacity. This data establishes an empirical upper bound on site backup capacity and reveals facility expansion phases months before commercial operations commence.
What is the structural difference between regulated utilities and independent power producers in AI power contracts?
Regulated utilities operate under state public utility commissions with guaranteed returns on equity (ROE) based on capital expenditure, but they are constrained by rate-base approvals and lengthy interconnect queues. Independent power producers (IPPs) operate merchant generation assets that can contract directly with hyperscalers via unregulated bilateral power purchase agreements (PPAs), capturing market-clearing wholesale electricity prices and premium tariffs for dedicated baseload nuclear or clean energy.