Data Center Substation: High-Voltage Grid Interconnection, Substation Capacity, and Power Delivery for AI Campuses
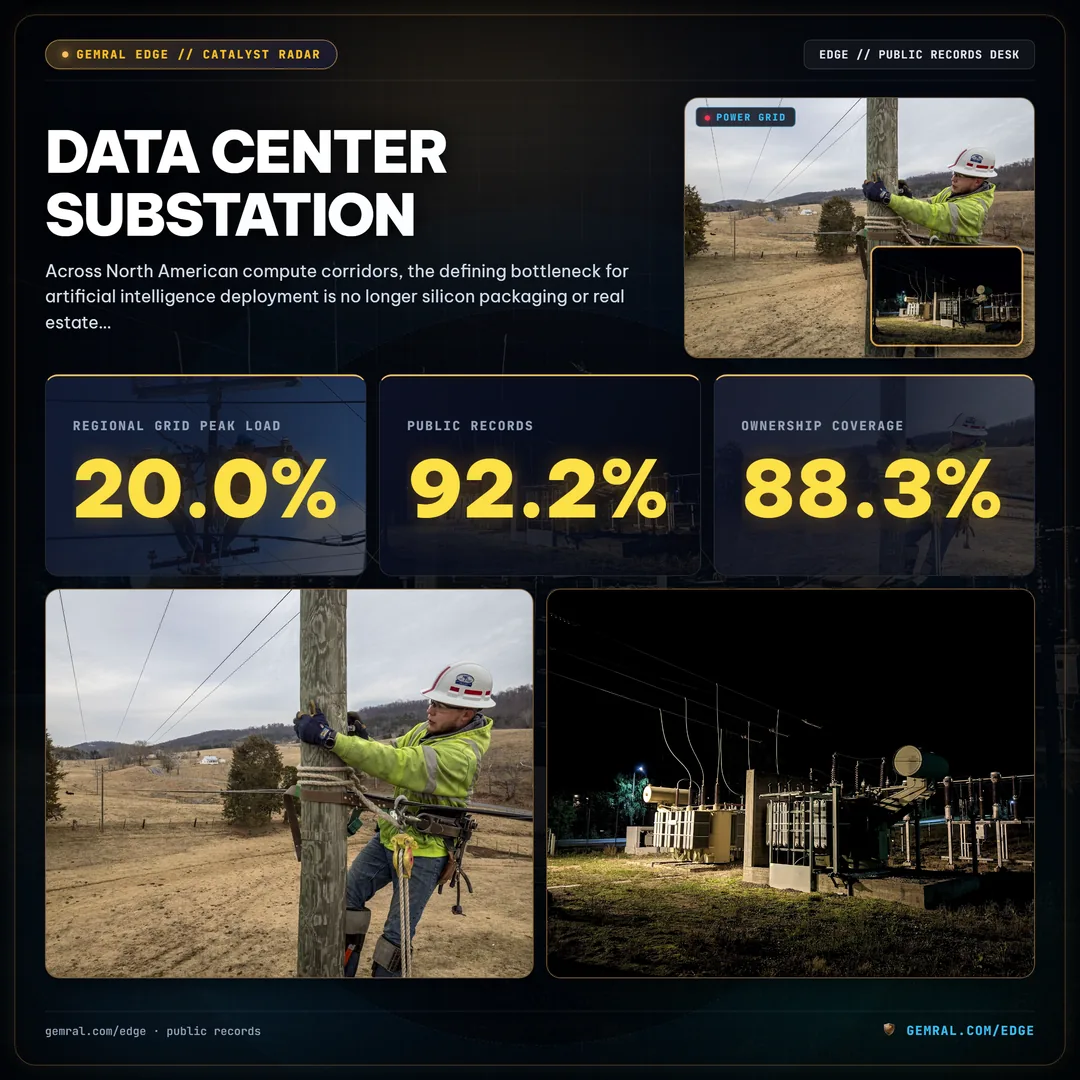
Across North American compute corridors, the defining bottleneck for artificial intelligence deployment is no longer silicon packaging or real estate acquisition. The critical operational constraint is the high-voltage electrical substation. As enterprise accelerated computing campuses scale from tens of megawatts to multi-hundred-megawatt utility loads, interconnecting with high-voltage transmission lines through dedicated substation infrastructure dictates development timelines, capital expenditure, and tenant energization dates.
Why High-Voltage Substations Form the Physical Bottleneck for AI Data Centers
The structural transition toward accelerated artificial intelligence workloads has fundamentally altered the power topology of enterprise digital infrastructure. Conventional enterprise cloud facilities historically operated at modest power densities, averaging between 5 and 10 kilowatts per rack. In stark contrast, modern high-density artificial intelligence architectures housing specialized compute clusters routinely draw between 40 and 60 kilowatts per cabinet, with liquid-cooled deployments frequently scaling from 100 to 120 kilowatts per enclosure. This concentration of electrical load transforms single data center facilities into utility-scale industrial loads that municipal distribution networks cannot support.
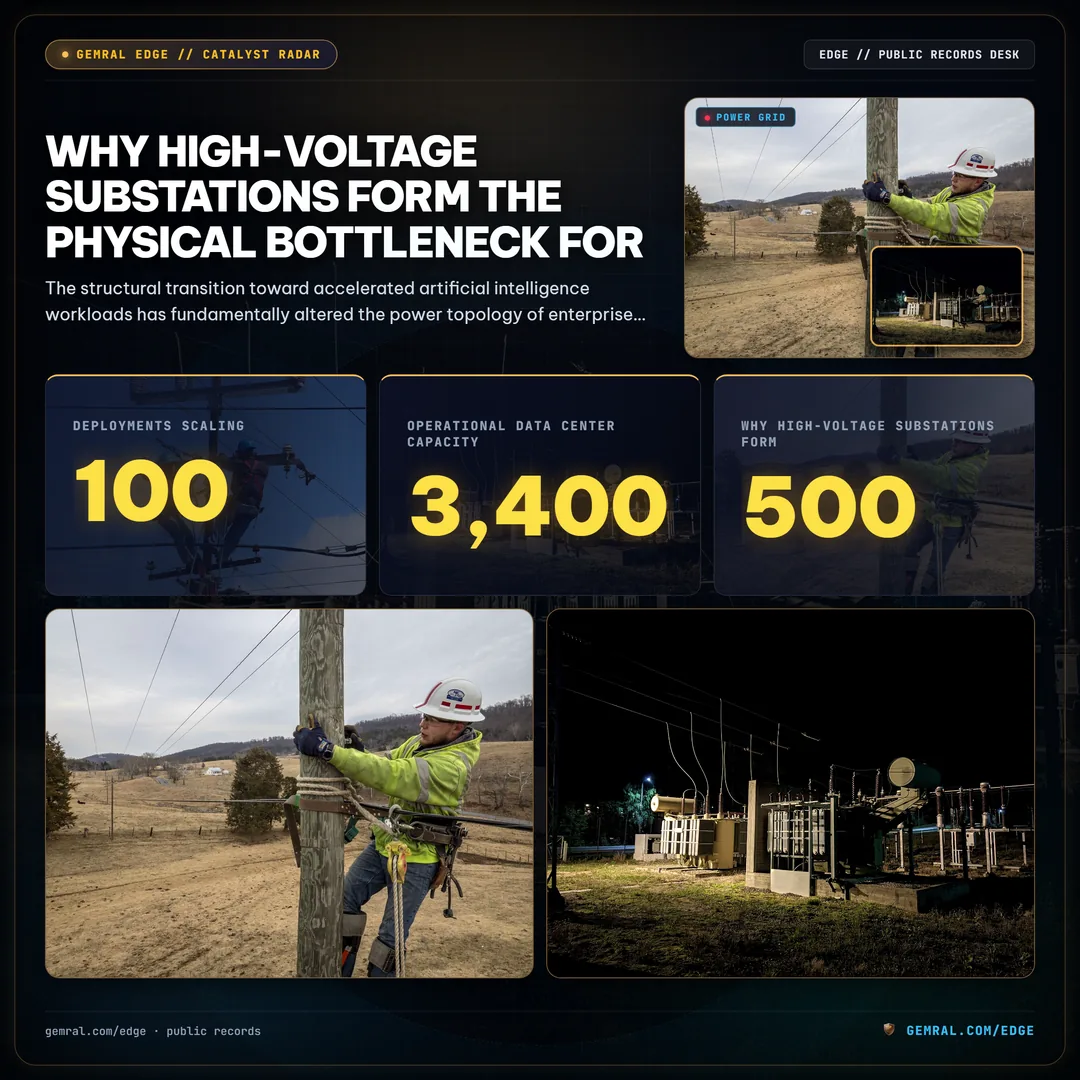
Consequently, hyperscale operators and institutional data center developers cannot energize modern compute clusters through conventional commercial utility distribution lines. Securing access to high-voltage transmission networks requires engineering, constructing, and commissioning dedicated data center substations. As documented across our analysis of the Defense and Data Center Power Hub and previous reviews of regional generator and grid capacity, transmission constraints represent the ultimate physical governor on compute expansion. In prime digital infrastructure corridors such as Northern Virginia, where active operational data center capacity exceeds 3,400 megawatts, high-voltage interconnection backlogs extend development timelines by 36 to 60 months.
A data center substation functions as the vital electrical translation interface between high-voltage bulk transmission grids and the step-down distribution systems powering server power distribution units. Operating at nominal capacity levels that rival medium-sized municipalities, a single hyperscale campus substation routinely handles between 100 and 500 megavolt-amperes (MVA) of transformation capacity. Without an operational substation backed by approved transmission interconnection agreements, a newly completed building shell remains an unenergized stranded asset.
Substation Voltage Classes and Step-Down Architecture for Compute Campuses
Understanding data center power delivery requires examining the standardized voltage hierarchies governing electrical transmission. Bulk power generation facilities transmit electricity over vast geographic distances at extra-high voltages to minimize resistive line losses. In the United States, utility bulk power transmission corridors operate primarily across distinct standardized voltage tiers, specifically 115 kV, 138 kV, 230 kV, 345 kV, 500 kV, and 765 kV.
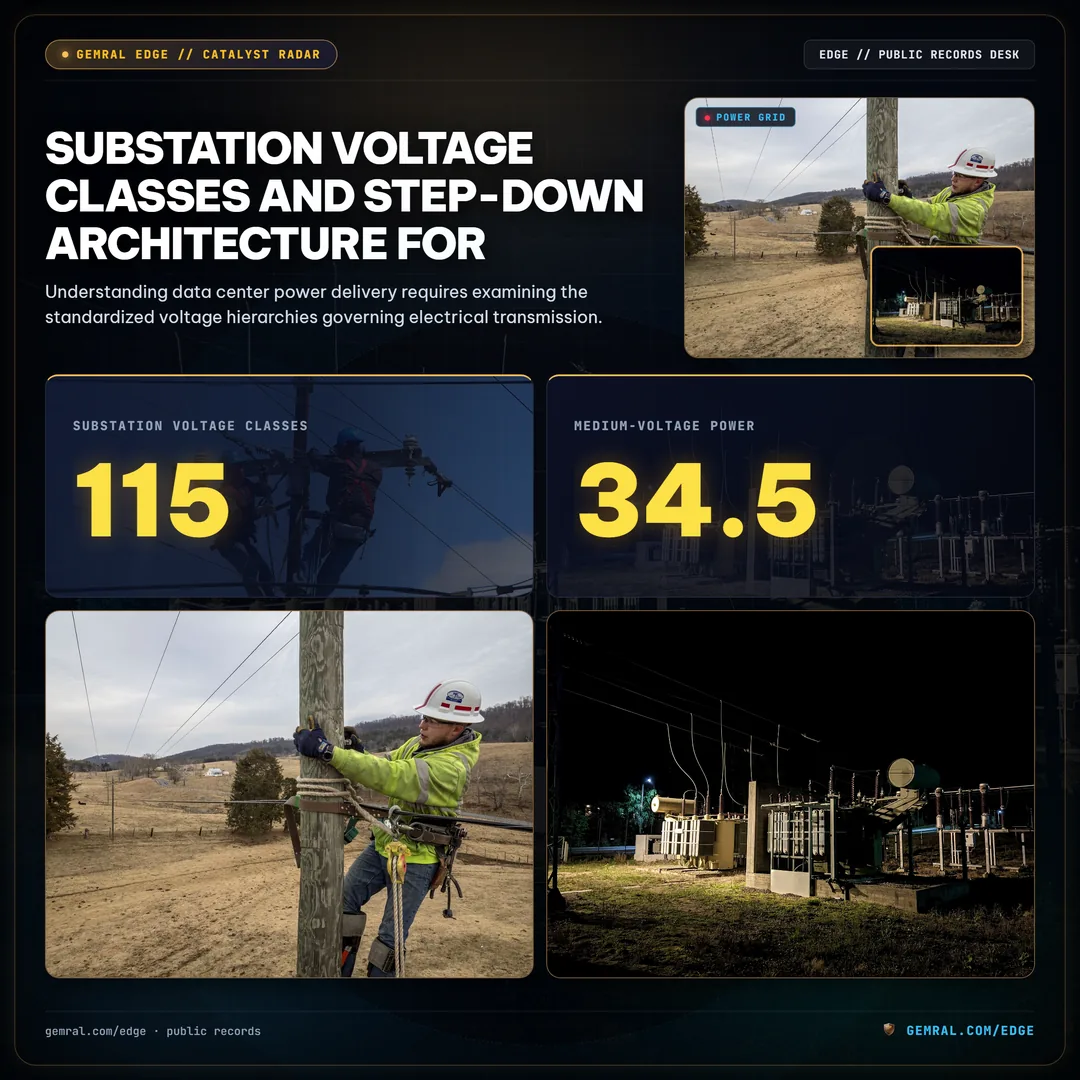
When high-voltage utility transmission lines reach a dedicated data center substation, the electrical infrastructure executes a stepped voltage transformation process. The substation yard houses large power transformers (LPTs) that step down the transmission voltage from bulk levels (such as 230 kV or 500 kV) down to intermediate medium-voltage distribution tiers, typically 34.5 kV or 13.8 kV. These medium-voltage feeders route subterranean cable arrays directly into the data center facility switchgear galleries.
Inside the building envelope, secondary substations and unit substations execute subsequent voltage reductions. Medium-voltage power is stepped down from 34.5 kV or 13.8 kV to low-voltage distribution levels, commonly 480V three-phase power in North America. This low-voltage supply feeds uninterruptible power supply (UPS) battery systems and static transfer switches before reaching power distribution units (PDUs) that deliver 415V or 208V power directly to individual server racks.
To preserve uninterrupted operational uptime meeting stringent Tier 3 and Tier 4 service level availability targets, campus substation design incorporates extensive hardware redundancy. Standard utility substation topology utilizes dual-bus, double-breaker, or ring-bus configurations. By connecting to two independent high-voltage utility transmission circuits through redundant main power transformers, the substation ensures that an unexpected outage, line trip, or planned transformer maintenance on one utility path does not interrupt compute operations.
Mapping Substation Proximity and Grid Interconnection Across Major Cloud Corridors
Physical proximity to existing high-voltage transmission corridors and utility substations is the foremost criteria in data center site selection. Constructing overhead transmission lines or installing subterranean high-voltage gas-insulated transmission lines (GIL) across urbanized jurisdictions incurs severe capital expenditures and protracted right-of-way easement battles.
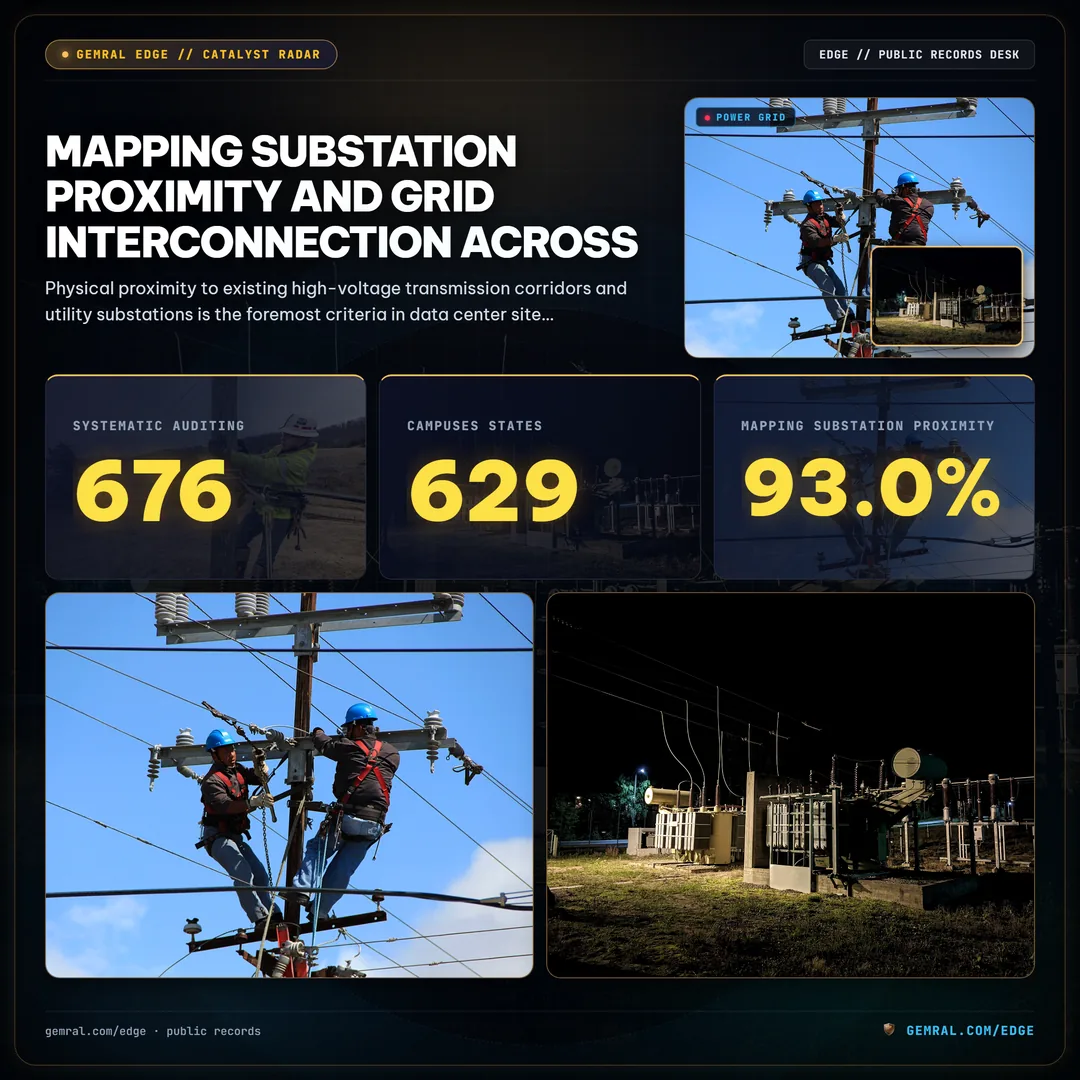
Comprehensive empirical telemetry across North American digital infrastructure demonstrates this locational dependency. Systematic auditing of 676 primary data center campuses across the United States reveals that 629 sites—representing 93.0% of monitored facilities—are situated within 5.0 kilometers of a high-voltage substation operating at 115 kV or higher. Across this monitored national footprint, the median distance from a data center property line to the nearest high-voltage substation is exactly 1.02 kilometers.
This clustering is especially pronounced across major regional cloud ecosystems. In Northern Virginia, where dense fiber-optic routes converge with major transmission corridors operated by Dominion Energy and managed within PJM Interconnection, data center developers have historically purchased parcels bordering existing utility rights-of-way. Within this corridor, data center power demand accounts for approximately 20.0% of regional grid peak load, driving long-term infrastructure projections toward 7,000 megawatts by 2030 and potentially reaching 10,000 megawatts by 2035.
Similar spatial clustering appears across secondary digital hubs including the ERCOT grid territory in Texas, Georgia Power corridors surrounding metro Atlanta, and emerging hubs across Arizona and Ohio. When developers evaluate raw land parcels, properties situated beyond a 5-kilometer radius from existing 115 kV or 230 kV substations face exponential cost escalations, often requiring multi-million-dollar line extension charges and extended regulatory reviews from regional utility commissions.
Dedicated On-Site Substations Versus Shared Utility Interconnection Feeds
As hyperscale compute campuses scale past 100 megawatts of connected load, the structural model of utility interconnection bifurcates into two distinct operating models: shared utility substations and developer-owned dedicated on-site substations.
In secondary markets and multi-tenant colocation environments, data center operators historically tapped into shared utility distribution substations. Under a shared framework, the regulated electric utility designs, owns, operates, and maintains the substation yard. The utility steps down bulk transmission voltage and delivers medium-voltage power to multiple commercial industrial customers within an industrial park. While this model minimizes upfront capital expenditure for the data center operator, it limits infrastructure control, constrains rapid capacity expansion, and exposes the tenant to shared local feeder disruptions.
For tier-one hyperscale operators deploying artificial intelligence training clusters, the dedicated on-site substation has become the mandatory standard. Under this framework, the cloud developer acquires dedicated acreage adjacent to the computing halls and either self-builds or finances a custom-engineered substation dedicated entirely to their campus.
A dedicated on-site substation provides decisive operational advantages:
- Custom Transformation Sizing: Developers install specialized large power transformers rated at 100 MVA, 150 MVA, 200 MVA, or 300 MVA, precision-engineered to match the exact phase load and harmonics generated by dense server power supplies.
- Dual-Feeder Transmission Diversity: Dedicated yards interconnect directly into two distinct bulk transmission corridors, establishing true physical redundancy back to independent utility generation sources.
- Phased Expansion Synchronization: Rather than waiting for utility municipal capital expenditure cycles, developers construct substation bays modularly, energizing new transformer banks in lockstep with server hall fit-out schedules.
- Direct Utility Telemetry Integration: On-site switchyards integrate directly with regional grid balancing authorities, providing real-time supervisory control and data acquisition (SCADA) telemetry for dynamic load management.
Interconnection Queue Bottlenecks and Large Power Transformer Lead Times
While capital availability for artificial intelligence infrastructure remains abundant, project execution is bounded by severe supply chain and regulatory bottlenecks. Foremost among these are regional transmission interconnection queues and global manufacturing constraints for electrical equipment, closely paralleling the dynamics explored in our study of hyperscaler power purchase agreements and nuclear baseload commitments.
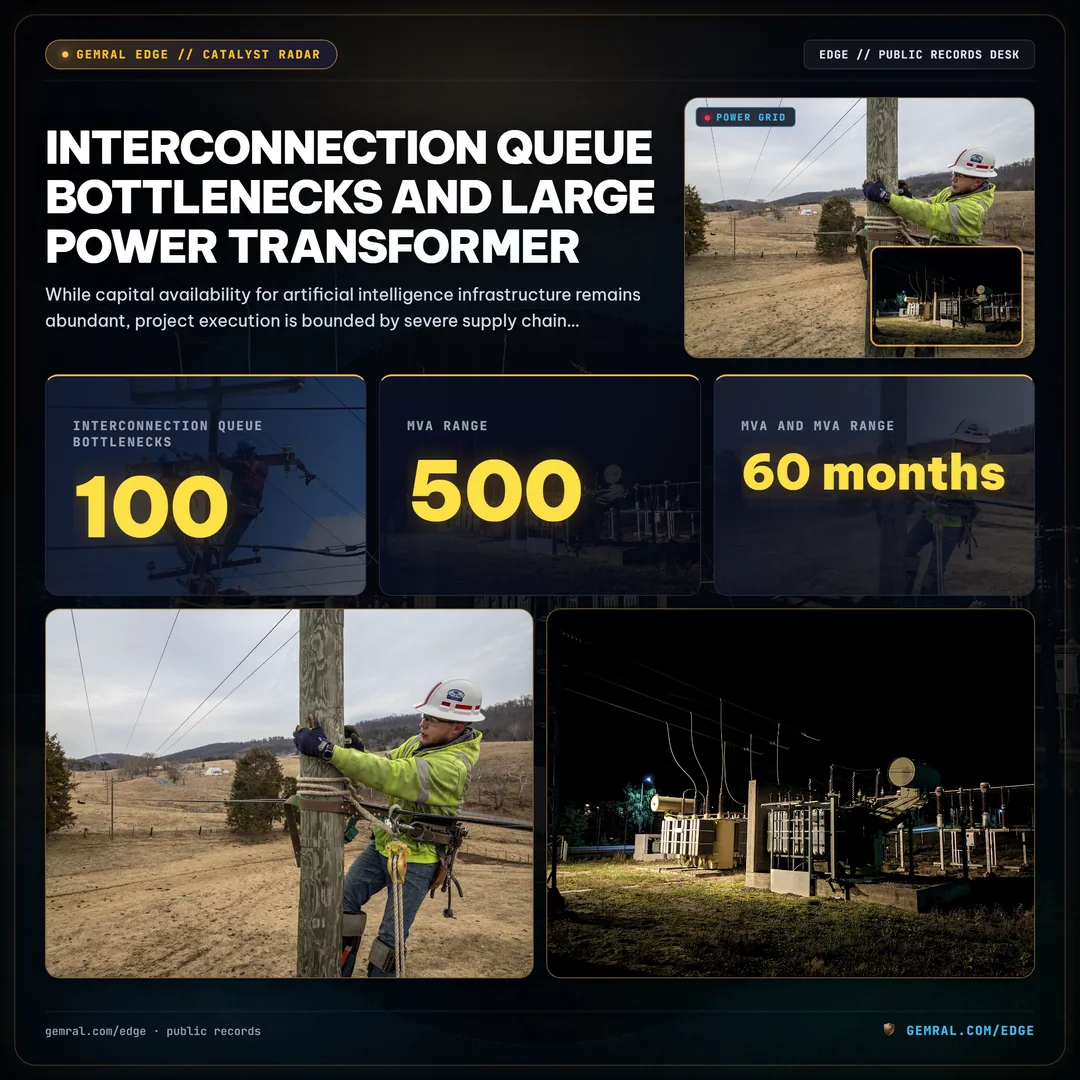
Across major Regional Transmission Organizations (RTOs) such as PJM Interconnection, MISO, and ERCOT, formal generation and large-load interconnection queues face historic backlogs. Under FERC regulatory frameworks, developers requesting utility service upgrades exceeding 50 or 100 megawatts must undergo rigorous system impact studies, feasibility reviews, and facility studies to model regional grid stability and thermal transfer limits. These administrative and engineering review cycles routinely consume between 3 and 7 years before a formal Interconnection Service Agreement (ISA) is executed.
Compounding regulatory delays is a severe global manufacturing shortage of large power transformers. High-voltage step-down transformers utilized in data center substations are complex, custom-engineered industrial assets weighing hundreds of tons and requiring specialized grain-oriented electrical steel, copper windings, and high-dielectric insulating fluids.
Prior to 2021, procurement lead times for utility-scale step-down transformers averaged between 12 and 18 months. Currently, lead times for large power transformers rated between 100 MVA and 500 MVA range from 36 to 60 months. Consequently, enterprise infrastructure developers must commit tens of millions of dollars in non-refundable equipment orders 3 to 5 years prior to breaking ground on physical building envelopes.
This equipment bottleneck directly mirrors broader utility generation timelines. Empirical analysis of 7,765 utility-scale power generation facilities tracked across public records reveals that new capacity requires measured lead time to reach commercial operation. Facilities transitioning from planned status to operating status require a median duration of 16.0 months, with an interquartile range extending from 9.0 to 25.0 months across 1,118 completed plants. For facilities already under active construction, moving to operating status requires a median duration of 7.9 months across 2,884 facilities, with an interquartile range spanning from 4.0 to 13.0 months, while 1,398 planned facilities remain in development queues.
Integrating Substation Proximity and Air Permitted Generation into Infrastructure Analysis
To evaluate artificial intelligence infrastructure risk and data center development velocity, institutional quantitative researchers must look beyond high-level cloud press releases and evaluate physical ground-level disclosures. Siting a high-density compute campus requires aligning three interdependent public regulatory layers: corporate entity identification, high-voltage substation grid interconnection, and environmental air permitting.
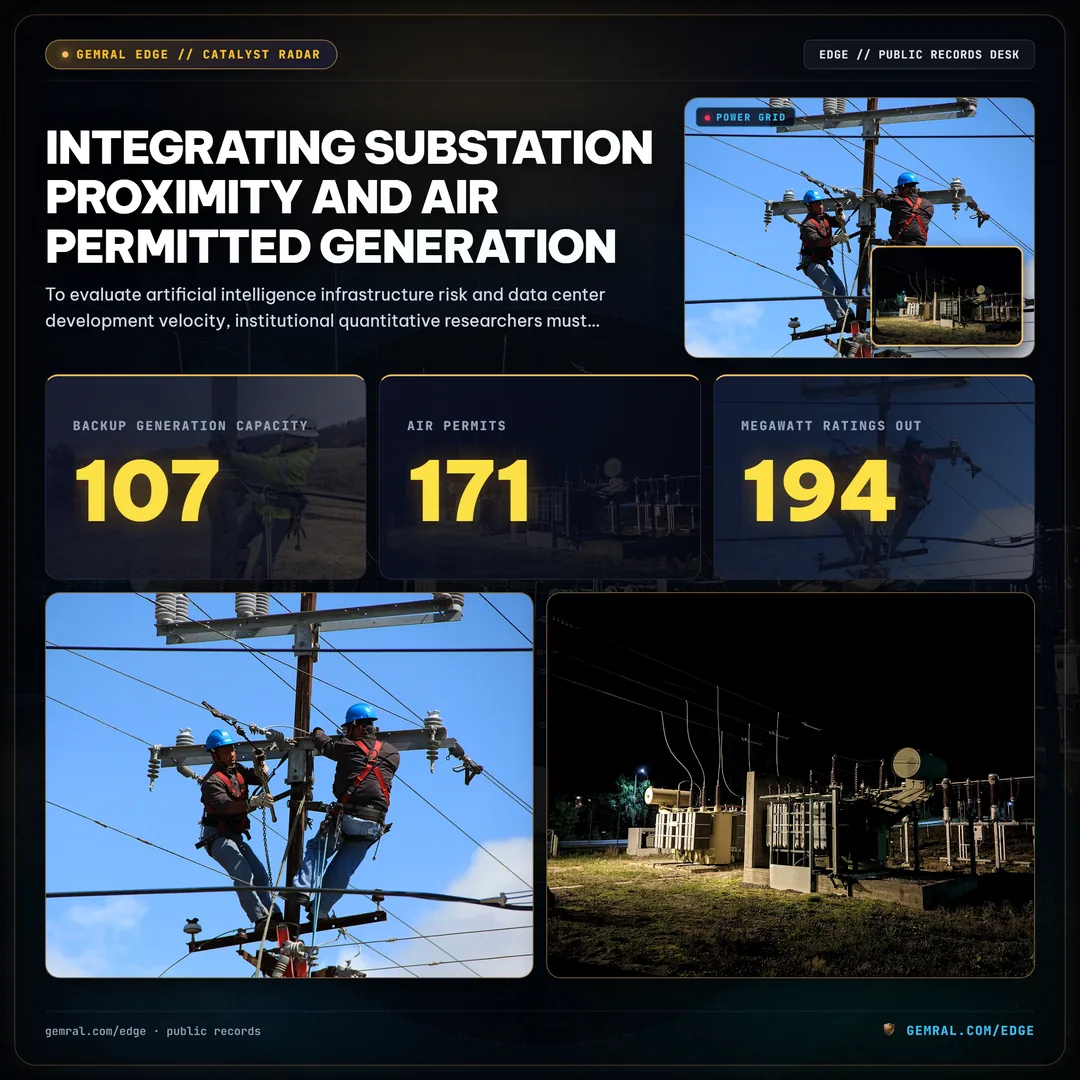
While high-voltage substations provide primary baseload utility energization, data center uptime mandates deploy arrays of on-site industrial emergency diesel generators to hedge localized grid volatility. Siting stationary internal combustion engines requires obtaining air pollution permits from state environmental regulators, such as the Department of Environmental Quality.
Methodology & Regulatory Boundary: Permitted backup-generator MW is an upper bound on on-site backup capacity, not IT load; we do not convert it. Operating power draws vary dynamically based on computational workload intensity, cooling overhead, and utility grid availability.
Regulatory disclosures document widespread coverage of environmental permitting. In Virginia, public records show 92.2% coverage of permitted backup generation capacity across 107 primary campuses, representing 171 air permits with disclosed megawatt ratings out of 194 total permits. In secondary markets, public filings detail 46 state air permits in Georgia (including 8 sites with 10 explicit backup MW records), 34 permits in Texas, and 15 permits in Arizona. Across Texas, Georgia, Ohio, and Arizona, 79 out of 81 primary data center campuses—representing 97.5% coverage—carry formal federal air-program registration records.
The convergence of these regulatory datasets establishes high-fidelity visibility into operational capacity. Across monitored digital infrastructure, 107 data center campuses carry five distinct public-record layers simultaneously: verified corporate entity ownership, high-voltage substation interconnection, balancing-authority grid zone telemetry, dated state air permits, and monthly satellite footprint measurements. Of these multi-layer facilities, 92 campuses are concentrated in Virginia.
Crucially, infrastructure research requires point-in-time entity resolution. Historical corporate reorganizations, asset acquisitions, and operating company subsidiaries frequently mask asset ownership. Merely joining property parcels through current ownership tables rather than ownership on public disclosure dates leads to severe temporal lookahead bias, misattributing 40 out of 169 historical permit events (23.7%) and 70 out of 687 power plant lifecycle events (10.2%). By tracking 489 data center campuses with identified owners out of 554 total operating sites (representing 88.3% ownership coverage), quantitative analysts trace capital deployment directly back to public corporate parents.
Institutional research platforms like Gemral Edge map these overlapping physical records, tracking high-voltage substation proximities, regional utility interconnection queues, and environmental air permits to deliver systematic intelligence across sovereign and commercial digital infrastructure. For deep dive disclosures and raw parcel metrics, access the Gemral Edge Data Center Substation Analysis.
Frequently asked questions
What is the typical voltage of a data center substation?
Data center substations typically interconnect with high-voltage utility transmission lines operating at 115 kV, 138 kV, 230 kV, or 500 kV, stepping power down to 13.8 kV or 34.5 kV for on-site distribution across data halls.
Why do AI data centers require dedicated on-site substations?
High-density AI server clusters demand immense power—often between 100 MW and 500 MW per campus. Dedicated on-site substations provide the transformation capacity, redundant feeder circuits, and dual-utility bus architectures required to sustain Tier 3 and Tier 4 operational uptime.
How long does it take to build a data center substation?
Building a dedicated data center substation typically takes 3 to 5 years, primarily driven by utility interconnection queue backlogs and manufacturing lead times for large power transformers (LPTs), which currently average 36 to 48 months.