Data Center Transformer: Sourcing Lead Times, High-Voltage Substation Interconnection, and Grid Equipment Bottlenecks
A point-in-time case study on data center transformers: analyzing large power transformer lead times, substation proximity across 676 campuses, HS 850423 trade import telemetry, and resolving tenant allocations against utility grid capacity.
Across the modern artificial intelligence landscape, computing power is bounded not merely by silicon fab capacity or rack-level cooling, but by the physical availability of a single critical component: the data center transformer. High-voltage large power transformers (LPTs) form the non-negotiable physical link between regional transmission utility grids and high-density compute halls. Stepping down transmission voltages ranging from 115 kV to 500 kV into usable distribution feeds, these heavy-duty electromagnetic units dictate when a newly constructed hyperscale facility can actually energize its graphics processing clusters.
However, tracking data center transformer availability and substation energization schedules poses substantial analytical hurdles for research desks. Raw utility interconnection queues frequently obscure true commercial energization dates, while static supply chain estimates fail to distinguish between speculative campus filings and fully permitted infrastructure. Effective infrastructure analysis requires combining point-in-time high-voltage substation mapping, international trade classification tracking, and verified campus entity resolution. To explore how physical asset telemetry integrates with institutional data feeds, research teams monitor our comprehensive data center power telemetry alongside our deep dives into data center substation interconnection and data center power consumption analysis.
The Physical Bottleneck: Why AI Data Centers Depend on High-Voltage Power Transformers
Modern artificial intelligence training clusters operate at power densities unprecedented in commercial real estate history. While legacy enterprise data centers typically required 5 kW to 10 kW per server rack, contemporary dense GPU architectures draw between 40 kW and 100 kW per rack, with next-generation liquid-cooled compute clusters demanding up to 120 kW per enclosure. A single hyperscale AI training campus encompassing multiple data halls regularly requires gross electrical capacity between 200 MW and 1,000 MW—equivalent to the power consumption of a mid-sized metropolitan city.

Delivering power at this scale directly from local municipal distribution circuits is physically impossible without causing catastrophic voltage drops and thermal line overloads. Consequently, data center developers must interconnect directly with regional high-voltage transmission networks operating at 115 kV, 138 kV, 230 kV, or 500 kV. Here lies the indispensable role of the high-voltage data center transformer: it acts as the primary step-down gateway, converting bulk transmission electricity into medium-voltage campus distribution feeds (typically 13.8 kV or 34.5 kV), which are subsequently transformed down to 415V or 480V at secondary pad-mounted units feeding power distribution units (PDUs) inside the server rows.
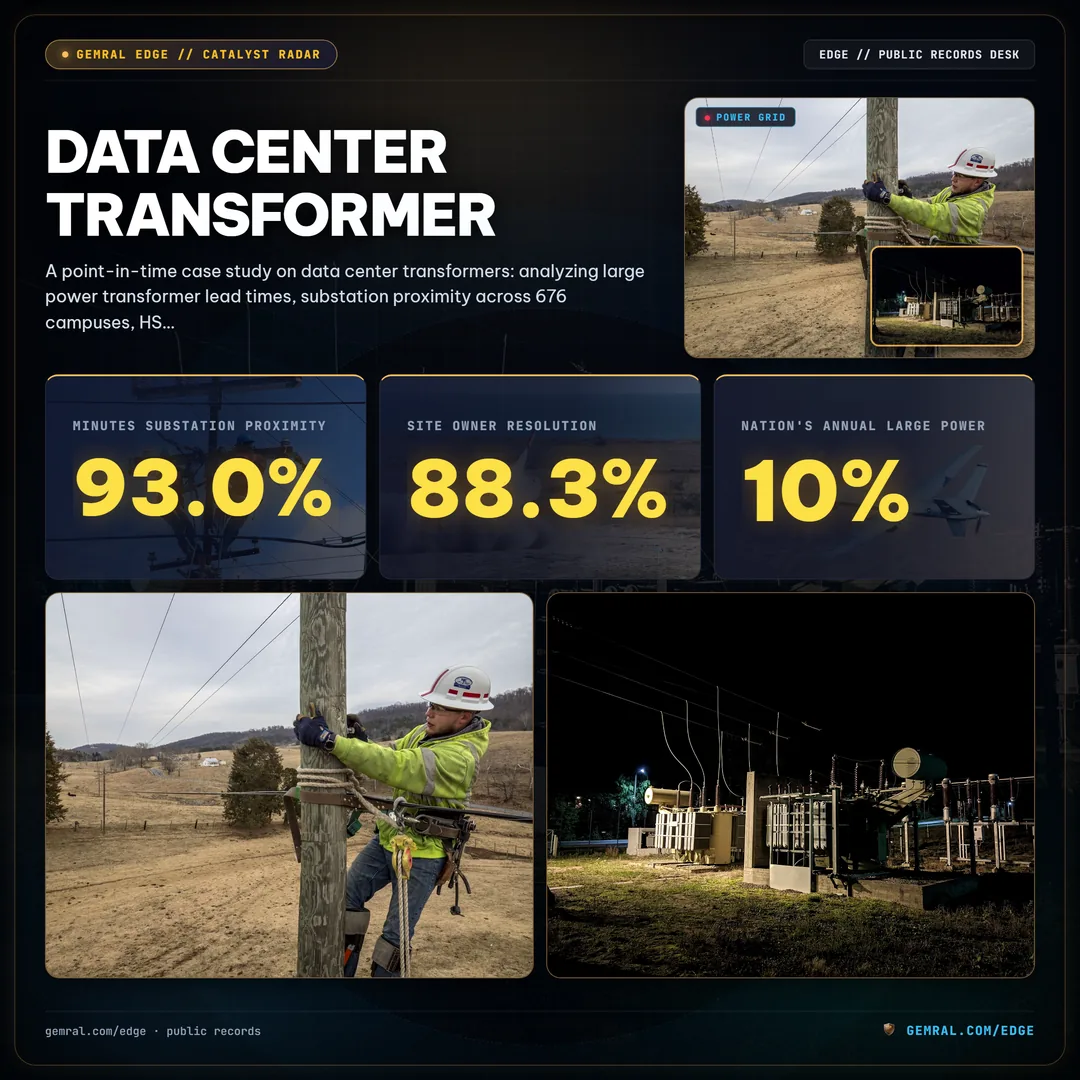
Empirical mapping of public records across 676 monitored data center campuses reveals that 629 sites—or exactly 93.0% of the universe—are situated within 5.0 km of an operational high-voltage electrical substation rated at 115 kV or higher. The median physical distance between campus property boundaries and the nearest high-voltage substation is just 1.02 km. Furthermore, within this national universe, 107 primary campuses have matured to carry all five distinct public-record infrastructure layers simultaneously: verified owner entity, nearest high-voltage substation, regional grid zone load, dated environmental air permit or program registration, and monthly satellite telemetry. Notably, 92 of these 107 comprehensive multi-layer campuses are concentrated within the Northern Virginia data center corridor out of 215 monitored Virginia facilities, illustrating the extreme geographic concentration of high-voltage transmission interconnection.
Sourcing Lead Times and Supply Constraints: Decoding the 120-Week Large Power Transformer Backlog
While software developers can deploy model weights in seconds, acquiring the physical equipment necessary to power those models is subject to multi-year industrial manufacturing cycles. Prior to 2021, procurement lead times for high-voltage large power transformers (rated at 100 MVA or greater) averaged approximately 50 weeks. Over the subsequent five years, concurrent demand surges from utility grid modernization, renewable interconnection queues, and hyperscale AI campus expansion have stretched manufacturing lead times to between 120 and 150 weeks—translating to 2.5 to 3.5 years from capital commitment to on-site delivery.
This acute procurement bottleneck stems from structural supply chain limitations that cannot be rapidly resolved by capital expenditure alone. Manufacturing large power transformers is a bespoke, labor-intensive process requiring specialized heavy industrial manufacturing facilities and clean-room assembly bays. The primary physical constraints include:
- Grain-Oriented Electrical Steel (GOES): High-efficiency LPT cores require ultra-high-grade grain-oriented electrical steel to minimize core excitation losses. Global GOES production is highly concentrated among a handful of specialized metallurgical mills, creating severe raw material allocation quotas.
- Custom Copper Windings and Dielectric Insulation: Every utility transmission interconnection operates under distinct grid voltage parameters, fault current tolerances, and impedance specifications. Consequently, high-capacity transformers are almost entirely custom-engineered rather than mass-produced, requiring manual winding of tons of high-conductivity insulated copper conductor coils.
- High-Capacity Testing and Transportation Logistics: Completed units weigh between 200,000 and 600,000 pounds when filled with dielectric fluid. Before leaving the factory, each unit must undergo extensive impulse, dielectric, and temperature-rise testing in specialized high-voltage test bays. Transportation requires heavy-haul Schnabel railcars, of which fewer than 50 operate nationwide, creating severe logistics bottlenecks between ports, factories, and campus substations.
Because domestic United States manufacturing facilities produce only 10% to 15% of the nation's annual large power transformer requirements, data center operators and electric utilities depend heavily on foreign manufacturing plants located in South Korea, Germany, Austria, Japan, and Mexico. Understanding cross-border equipment flows through systematic public trade registries provides critical foresight into which regional campuses have secured physical equipment versus those facing extended interconnection delays.
Transformer Capacity vs Grid Interconnection: Mapping High-Voltage Substations and Power Feeds
When analyzing data center power capacity, quantitative researchers must rigorously avoid confusing transformer megavolt-ampere (MVA) ratings with usable IT compute load. A transformer's nameplate rating reflects its apparent electrical capacity under continuous thermal operating limits. In commercial data center engineering, facilities operate with strict redundancy topologies to ensure five-nines (99.999%) availability.
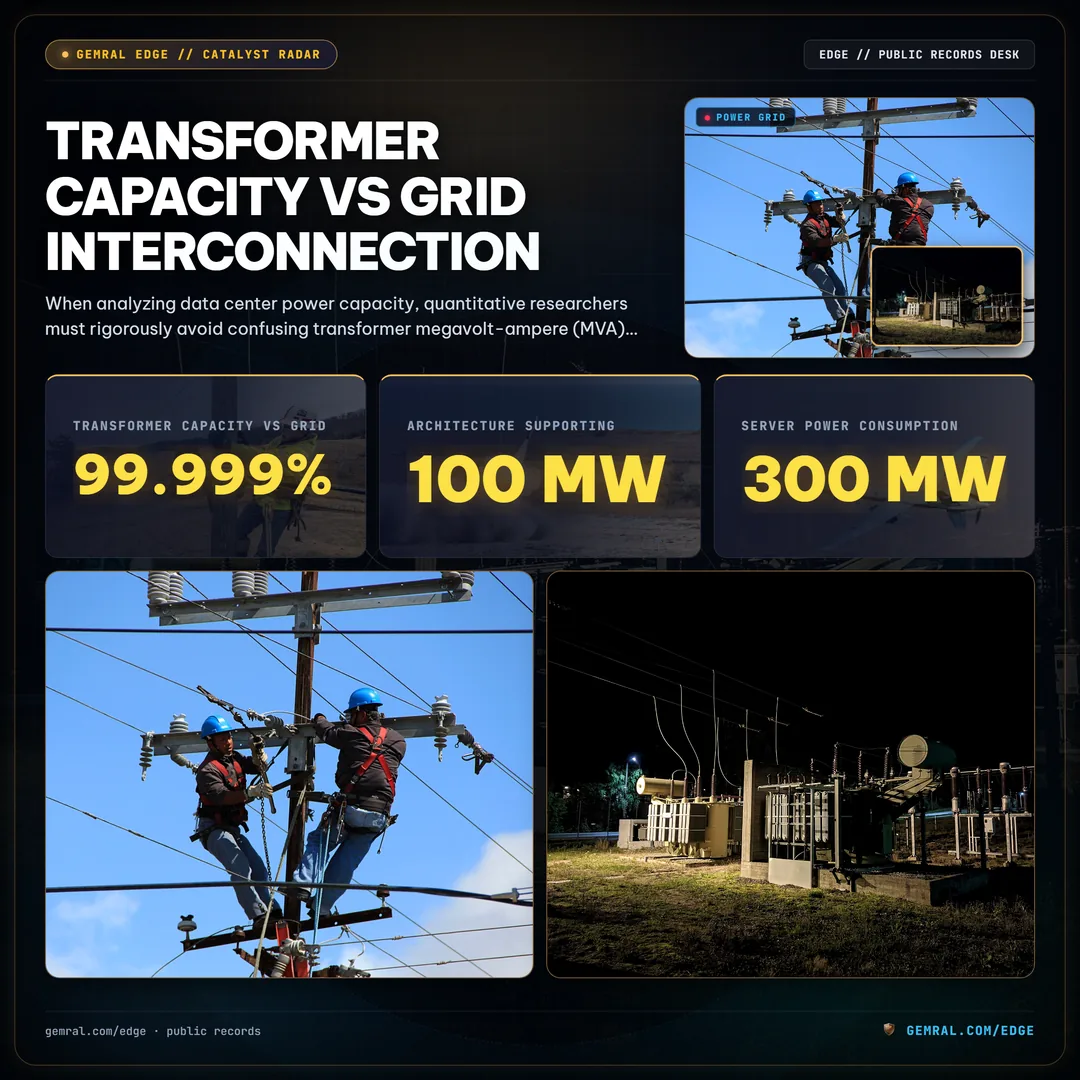
Under standard Tier 3 and Tier 4 concurrent maintainability standards, campus substations deploy redundant transformer configurations, such as N+1 (one reserve unit for every N operational units) or 2N (fully redundant parallel systems). In a 2N architecture supporting a 100 MW critical compute load, the on-site substation will house two separate 120 MVA to 150 MVA transformer bays fed by independent utility transmission circuits. Under normal operating conditions, each transformer runs at less than 50% capacity; if one transformer suffers catastrophic failure or requires maintenance, the parallel unit sustains the entire campus load without downtime. Therefore, observing 300 MVA of total installed transformer capacity does not imply 300 MW of server power consumption; rather, it indicates an engineered envelope designed to deliver approximately 120 MW to 150 MW of redundant, highly reliable IT power.
To establish an accurate point-in-time baseline of power assets, our infrastructure registry monitors 554 active data center campuses nationwide. Systematic public record verification has successfully resolved site owners across 489 of these 554 sites—achieving an 88.3% site owner coverage rate. The remaining sites represent multi-tenant leased spaces, dark fiber regeneration huts, or unclassified shell facilities. By coupling verified campus footprints with utility line voltage telemetry and regional independent system operator (ISO) load profiles, research desks can accurately assess local transmission headroom and model transformer capacity limits long before quarterly enterprise capital expenditure updates are filed.
Import Telemetry and Trade Codes: Tracking HS 850423 Equipment Shipments Across US Ports
Because domestic manufacturing covers only a minor fraction of transformer demand, international trade statistics compiled by the U.S. Census Bureau and federal customs authorities serve as an invaluable, independent point-in-time barometer of electrical infrastructure expansion. In the Harmonized Tariff Schedule (HTS), large power transformers are categorized under dedicated 6-digit trade codes:

Key Harmonized Tariff Schedule Classifications:
- HS 8504.23: Liquid dielectric transformers having a power handling capacity exceeding 10,000 kVA (10 MVA)—the benchmark classification for high-voltage data center substation and utility transmission transformers.
- HS 8504.22: Liquid dielectric transformers exceeding 650 kVA but not exceeding 10,000 kVA—capturing intermediate pad-mounted distribution transformers deployed around data hall perimeters.
- HS 8502.11 – 8502.13: Electric generating sets with compression-ignition internal combustion engines (diesel gensets)—capturing on-site backup generators.
Tracking federal international trade statistics across these specialized codes provides macroeconomic context on the volume and velocity of heavy electrical equipment arriving at U.S. marine ports and border crossings. Our physical infrastructure telemetry tracks 73,165 monthly trade rows across 17 distinct HS6 commodity codes, spanning 104 consecutive months from January 2018 through August 2026. This trade dataset covers 49 publicly traded corporate tickers distributed across 7 industry peer groups, including hyperscalers, data center REITs, electric utilities, and electrical equipment manufacturers.
However, researchers must observe a critical methodological caveat regarding trade data: imports reflect industry-level context by product code and country of origin, not company-level shipments. Equipment arriving under HS 850423 represents aggregate national intake destined for various end-users, including regional transmission utilities, industrial manufacturing plants, and hyperscale data centers. While trade flows do not indicate which specific ticker received an individual transformer crate, tracking longitudinal shifts in import volumes and average unit values provides quantitative confirmation of physical supply chain easing or intensification across the broader AI infrastructure complex.
Point-in-Time Site Resolution: Distinguishing Campus Tenants from Substation Operators
A critical trap in quantitative infrastructure modeling is the application of static, backward-looking entity resolution. In corporate real estate and utility infrastructure, data center assets frequently change hands through mergers, acquisitions, sale-leaseback transactions, and anchor tenant agreements. If an analytical model assigns historical site events using today's corporate owner, it introduces severe look-ahead bias that distorts historical backtests.

Our empirical analysis of public records demonstrates the material scale of this distortion: across the historical event registry, joining site events through today's owner rather than the point-in-time owner valid on the publication date misattributes 40 out of 169 environmental permit events (23.7%) and 70 out of 687 power-plant status events (10.2%). For nearly one-quarter of permit records, static mapping credits capital investments and regulatory authorizations to companies that had not yet acquired the property or were not yet publicly listed.
Consider a concrete commercial case study from the public record: the hyperscale computing campus located in Dalton, Georgia (monitored under EPA ECHO registry keys GA0000001331300171 and GA0000001331300172). The underlying physical site was originally owned and operated by Core Scientific. On July 28, 2026, Core Scientific disclosed in its Q2 FY26 earnings presentation and quarterly investor filings a major commercial milestone: leasing approximately 175 MW of high-density infrastructure at the Dalton campus to artificial intelligence cloud provider CoreWeave, alongside an agreement designating an additional 120 MW of power capacity for semiconductor manufacturer AMD, with deliveries commencing in the second half of 2027.
In this scenario, a naive database joining property records solely by county tax parcel titles would list only the underlying host entity, completely missing the corporate tenants funding the multi-hundred-megawatt transformer installation. Conversely, back-dating the tenant relationship to prior years would attach AI cloud activity long before the commercial lease became public. Rigorous point-in-time methodology records the site owner valid on each publication date while establishing effective-dated anchor tenant links only when formal disclosures appear in the public record.
A similar point-in-time discipline applies to regional power generation assets. Across 7,765 monitored U.S. power plants, tracking status events reveals that new electrical generation capacity becomes visible in public regulatory filings years before commercial operation:
- Planned to Operating: 1,118 power plants transitioned from initial "planned" status to fully "operating," requiring a median lead time of 16.0 months (interquartile range of 9.0 to 25.0 months).
- Under Construction to Operating: 2,884 power plants transitioned from "under construction" to "operating," requiring a median duration of 7.9 months (interquartile range of 4.0 to 13.0 months).
- Active Pipeline: As of October 2026, 1,398 power plants remain in the planned status stage across the monitored territory.
Observing the lifecycle progression of nearby generation facilities and substation transformer permits provides systematic models with point-in-time validation of whether local grid capacity will be delivered on schedule or delayed by regional transmission bottlenecks. For deeper exploration of regional environmental compliance, analysts review our research on data center air permits.
Data Center Transformer FAQ: Procurement Timelines, Voltage Classes, and Grid Delivery
What is the function of a data center transformer?
A data center transformer converts high-voltage transmission electricity (115 kV to 500 kV) supplied by regional grid operators into medium-voltage distribution power (typically 13.8 kV or 34.5 kV) for on-site substations, which is subsequently converted to low-voltage power (415V or 480V) for server power distribution units.
What are current procurement lead times for data center transformers?
Procurement lead times for high-voltage large power transformers (LPTs rated above 100 MVA) currently range between 120 and 150 weeks (approximately 2.5 to 3.5 years), driven by global shortages of grain-oriented electrical steel, specialized copper coil winding labor, and limited domestic manufacturing capacity.
How does transformer capacity compare to data center IT compute load?
Transformer megavolt-ampere (MVA) ratings represent apparent gross electrical capacity, not usable IT server power. Substations deploy redundant N+1 or 2N transformer configurations to maintain continuous uptime during equipment maintenance or transmission feeder faults, meaning total installed transformer capacity significantly exceeds peak operational compute demand.
Which international trade codes track data center power transformers?
Liquid dielectric transformers with a power handling capacity exceeding 10,000 kVA (10 MVA) are classified under Harmonized Tariff Schedule code HS 850423 in federal foreign trade statistics, providing point-in-time tracking of heavy electrical equipment imported into U.S. ports.
Regulatory Disclaimer & Public Transparency Notice
Public data · not investment advice. Data comes only from public sources and contains no material non-public information. Permitted backup-generator MW cited in state filings represents an upper bound on on-site backup capacity, not IT load; we do not convert it. Imports reflect industry-level context by product code and origin country, not company-level shipments. All substation distances, facility footprints, environmental permits, and trade statistics are compiled directly from public regulatory records maintained by state environmental protection agencies, FERC, EIA, and the U.S. Census Bureau. Sample data and table schemas are available on our Data Preview page. Institutional research feeds and API access are available through our Edge Data Plans ($39 Pro, $299 B2B, $2000 API).
Frequently asked questions
How does transformer capacity compare to data center IT load?
Transformer megavolt-ampere (MVA) ratings represent apparent gross electrical capacity, not usable IT compute load. Substations are sized with redundant N+1 or 2N transformer configurations to maintain continuous operation during maintenance or utility feeder failures, meaning total installed transformer capacity substantially exceeds peak operating compute demand.