Stocks Congress Is Buying: 2026 Cross-Signal Convergence Across Disclosures, Federal Contracts, and Lobbying
In 2026 through November 19, congressional disclosures show 7,419 trades across 94 members and 978 tickers, led by Microsoft (53 buys vs 50 sells across 24 members), S&P Global (32 buys), and Uber (29 buys). Pairing those trades with $254.83B in federal contracts and $536.88M in lobbying filings reveals where policy spending and lawmaker capital overlap.

What Stocks Congress Is Buying in 2026: The 7,419-Filing Baseline
7,419 disclosed transactions. 94 active members of Congress. 978 distinct equity tickers. When institutional analysts examine stocks congress is buying through November 19, 2026, the headline count—3,728 purchases against 3,661 sales—looks nearly balanced at the aggregate level. That surface symmetry disappears the moment you normalize by ticker concentration, lawmaker breadth, and overlapping federal policy streams.
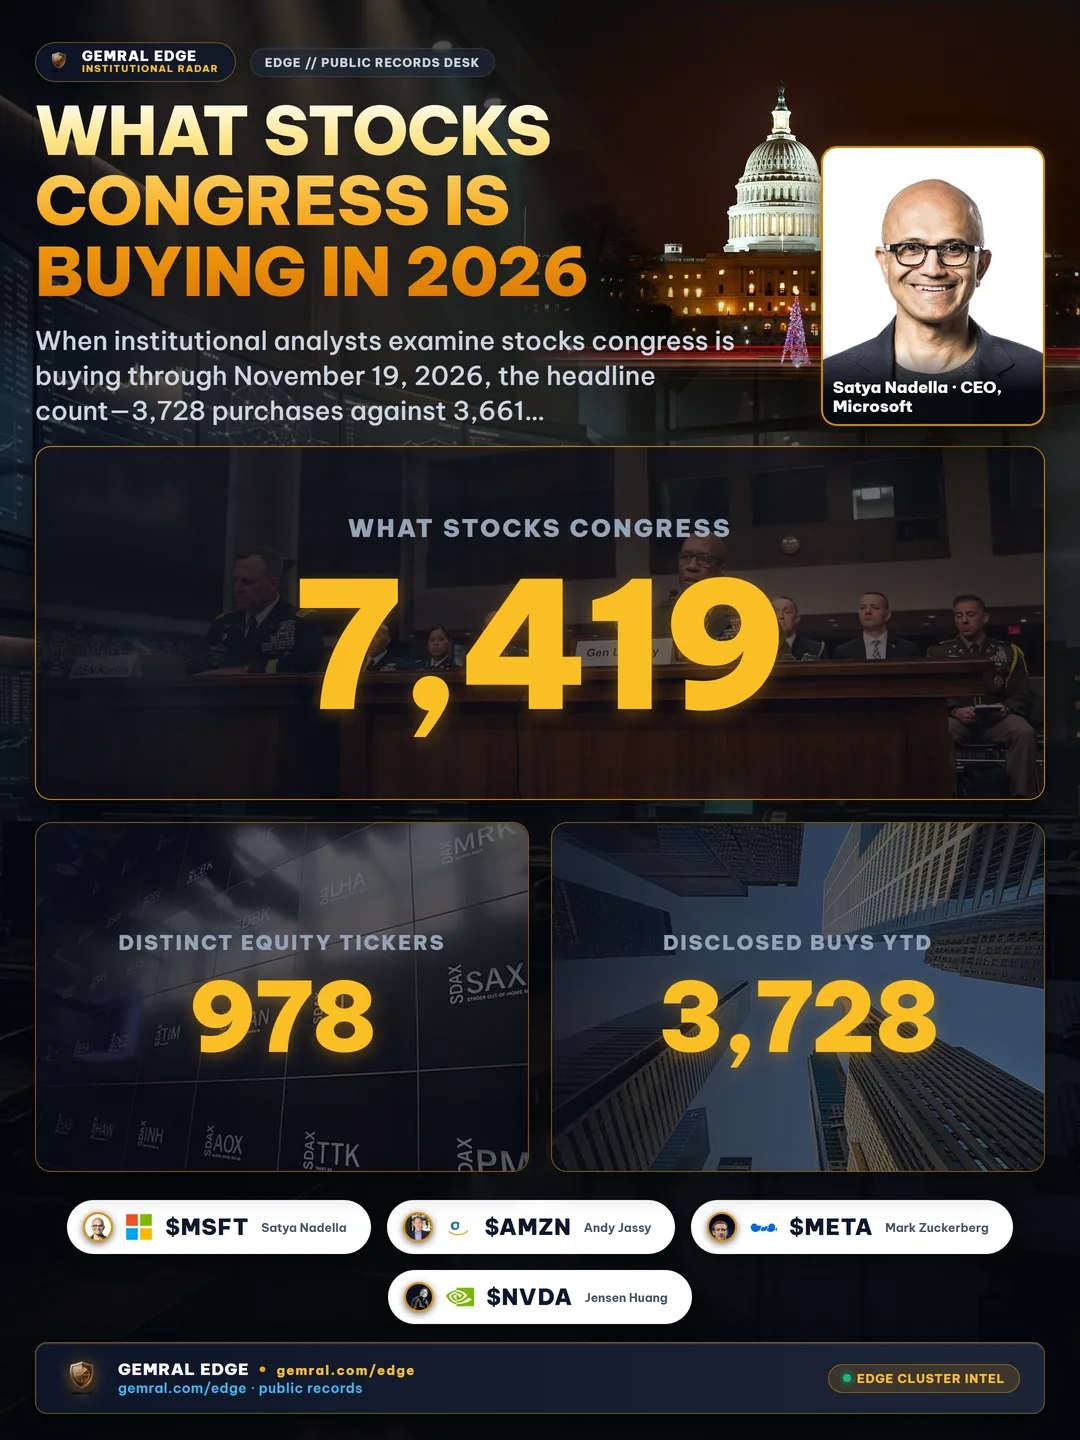
Microsoft leads every listed company in congressional activity this year with 103 total trades (53 purchases vs 50 sales) executed across 24 distinct lawmakers, including transactions dated as recently as November 4, 2026 and disclosed on November 19, 2026. Behind Microsoft, buying concentration shifts sharply toward financial market infrastructure, mobility platforms, and cloud hyperscalers: S&P Global logged 32 purchases against 14 sales across 7 members, Uber recorded 29 purchases against 21 sales across 9 members, Amazon registered 27 purchases against 28 sales across 15 members, and Meta Platforms posted 26 purchases against 14 sales across 15 members.
| Ticker | Total Trades (2026) | Disclosed Buys | Disclosed Sells | Distinct Members | Latest Disclosure |
|---|---|---|---|---|---|
| MSFT | 103 | 53 | 50 | 24 | 2026-11-19 |
| SPGI | 46 | 32 | 14 | 7 | 2026-10-14 |
| UBER | 50 | 29 | 21 | 9 | 2026-11-10 |
| AMZN | 55 | 27 | 28 | 15 | 2026-11-05 |
| META | 40 | 26 | 14 | 15 | 2026-11-10 |
| HD | 64 | 26 | 38 | 14 | 2026-11-12 |
| NVDA | 65 | 25 | 40 | 18 | 2026-11-18 |
| PLTR | 32 | 16 | 16 | 6 | 2026-09-04 |
A single trade by one member can reflect routine portfolio rebalancing by an external wealth manager. What separates isolated noise from an institutional signal is cross-dataset convergence: when dozens of lawmakers trade a ticker in the same calendar year while that same company simultaneously receives hundreds of millions of dollars in federal contract obligations and files tens of millions in lobbying disclosures. In the official filing layer, one stream is a data point; three independent trails converging on the same corporate entity is a measurable pattern.
Consider the dispersion across those top 8 names. Home Depot logged 64 total trades across 14 members, yet sales (38) outnumbered purchases (26) by nearly 50%. Nvidia recorded 65 trades across 18 members, with 40 sales against 25 purchases. By contrast, S&P Global saw more than twice as many buys (32) as sells (14), and Meta Platforms saw 26 buys against 14 sells. Counting raw transaction volume without separating buy-to-sell ratios and multi-member breadth misreads where congressional capital is actually accumulating versus trimming.
How to Track Stocks Congress Is Buying Across Periodic Transaction Reports
Every congressional equity transaction enters the public domain through Periodic Transaction Reports (PTRs) mandated by the Stop Trading on Congressional Knowledge (STOCK) Act of 2012. Under statutory rules, House and Senate members must disclose covered securities transactions exceeding $1,000 within 30 days of receiving notification of the trade, and no later than 45 days after the execution date itself. Rather than exact share counts or dollar figures, disclosures report dollar-value brackets—such as $1,001 to $15,000, $15,001 to $50,000, or $1,000,001 to $5,000,000—alongside the asset description, transaction direction, execution date, and filing date.

Because raw filings arrive in heterogeneous formats—including scanned PDFs, handwritten amendments, and electronic XML tables across both chambers—systematic tracking requires three normalization steps before any cross-signal comparison becomes valid. First, asset descriptions must be resolved to point-in-time corporate identifiers and tickers, accounting for subsidiary names, preferred shares, and corporate restructurings. Second, spousal, dependent, and joint-account trades must be tagged separately from member-direct transactions without losing the household attribution link. Third, both `tx_date` (when the trade occurred) and `disclosure_date` (when the market could first observe the filing) must be preserved as distinct timestamps.
As detailed in our congressional stock trading disclosure lag analysis, treating a trade's execution date as the moment it became public knowledge introduces severe look-ahead bias into quantitative research. A purchase executed on October 1, 2026 and disclosed on November 12, 2026 did not exist in the public information set during the intervening 42 days. Institutional research teams that index records strictly by publication timestamp eliminate retroactive contamination while still capturing multi-member clustering as disclosures hit the public tape.
Across the full historical archive of 50,000+ congressional trades, sampled accuracy verification against original House and Senate public disclosures achieved 97.7% precision (168 of 172 checkable records in the October 23, 2026 accuracy audit; 28 of 200 could not be re-checked automatically due to source-site access limits). That verification discipline ensures that when a researcher filters for multi-member buy clusters, the underlying ticker mapping reflects the actual legal entity named on the filing.
Equally critical is separating direct member trades from household-linked accounts and distinguishing option exercises or dividend reinvestments from discretionary open-market purchases. When a Periodic Transaction Report lists a purchase by a spouse or dependent child, statutory rules still require disclosure within the same 45-day ceiling, yet analytical models treat household-level clustering differently from committee-chair personal allocations. Normalizing transaction codes, asset types, and filing amendments before running cross-ticker aggregations prevents routine treasury-bill rollovers or mutual-fund sweeps from inflating individual equity buy counts.
Three-Trail Convergence: Microsoft, Amazon, and Meta Under Dual Policy Pressure
When congressional trades are joined against federal procurement obligations and corporate lobbying expenditures on the exact same timeline, three mega-cap technology companies stand out in 2026: Microsoft (MSFT), Amazon (AMZN), and Meta Platforms (META). Unlike pure-play consumer brands, these firms sit simultaneously at the center of federal cloud modernization, artificial intelligence regulation, antitrust oversight, and congressional portfolio allocations.
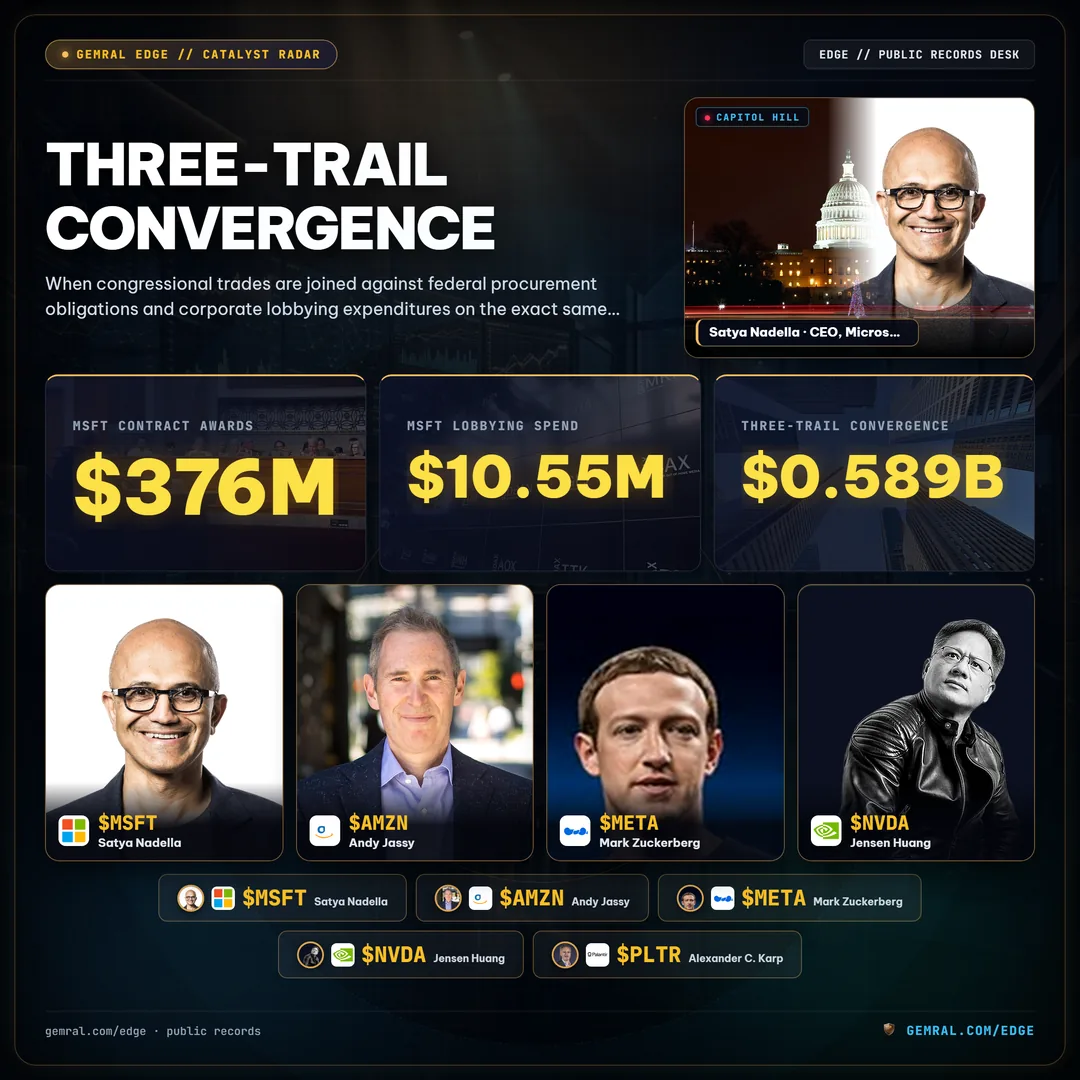
Microsoft exhibits the widest three-trail overlap among all non-defense equities in 2026. On the congressional disclosure trail, 24 members executed 103 trades (53 buys vs 50 sells) through November 19, 2026. On the federal procurement trail, Microsoft accumulated 76 federal contract transactions totaling $0.376B ($376M) through September 30, 2026. On the policy advocacy trail, Microsoft filed 62 lobbying disclosures totaling $10.55M in 2026. Every one of those three public streams operates under different statutory calendars, yet all three converge on the same parent ticker.
| Ticker | Congressional Trades (Buys/Sells) | Federal Contract Actions (2026) | Contract Value (2026) | Lobbying Filings (2026) | Lobbying Spend (2026) |
|---|---|---|---|---|---|
| MSFT | 103 (53 / 50) | 76 | $0.376B | 62 | $10.55M |
| AMZN | 55 (27 / 28) | 83 | $0.589B | 70 | $16.50M |
| META | 40 (26 / 14) | 0 | $0.000B | 71 | $22.11M |
| NVDA | 65 (25 / 40) | 0 | $0.000B | 18 | $6.04M |
| PLTR | 32 (16 / 16) | 103 | $1.611B | 43 | $9.26M |
Amazon mirrors that structural footprint with even heavier lobbying and procurement density. Across 2026, 15 members of Congress disclosed 55 Amazon trades (27 buys vs 28 sells). Simultaneously, Amazon logged 83 federal contract transactions totaling $0.589B ($589M) and 70 lobbying filings totaling $16.50M—a lobbying outlay 56% higher than Microsoft's $10.55M over the same period.
Meta Platforms demonstrates a contrasting two-trail divergence. While Meta recorded zero direct federal contract transactions in our 2026 procurement dataset, it led all major tech peers in lobbying intensity: 71 filings totaling $22.11M through November 19, 2026—more than double Microsoft's lobbying spend and nearly four times Nvidia's $6.04M across 18 filings. On the congressional side, 15 members disclosed 40 Meta trades with a clear net-buy skew of 26 purchases against 14 sales. Meanwhile, Palantir Technologies (PLTR) sits squarely in the dual-use software middle ground: 32 congressional trades across 6 members (16 buys vs 16 sells), 43 lobbying filings totaling $9.26M, and 103 federal contract actions totaling $1.611B.
Defense Primes vs Mega-Cap Tech: Where Federal Contracts Outpace Lawmaker Buys
A common retail assumption is that members of Congress heavily trade traditional defense contractors because of Armed Services committee oversight. The 2026 empirical record refutes that simplification. While federal contract obligations are overwhelmingly concentrated in defense and aerospace primes, congressional equity trading volume in those exact names is remarkably thin compared to mega-cap technology.
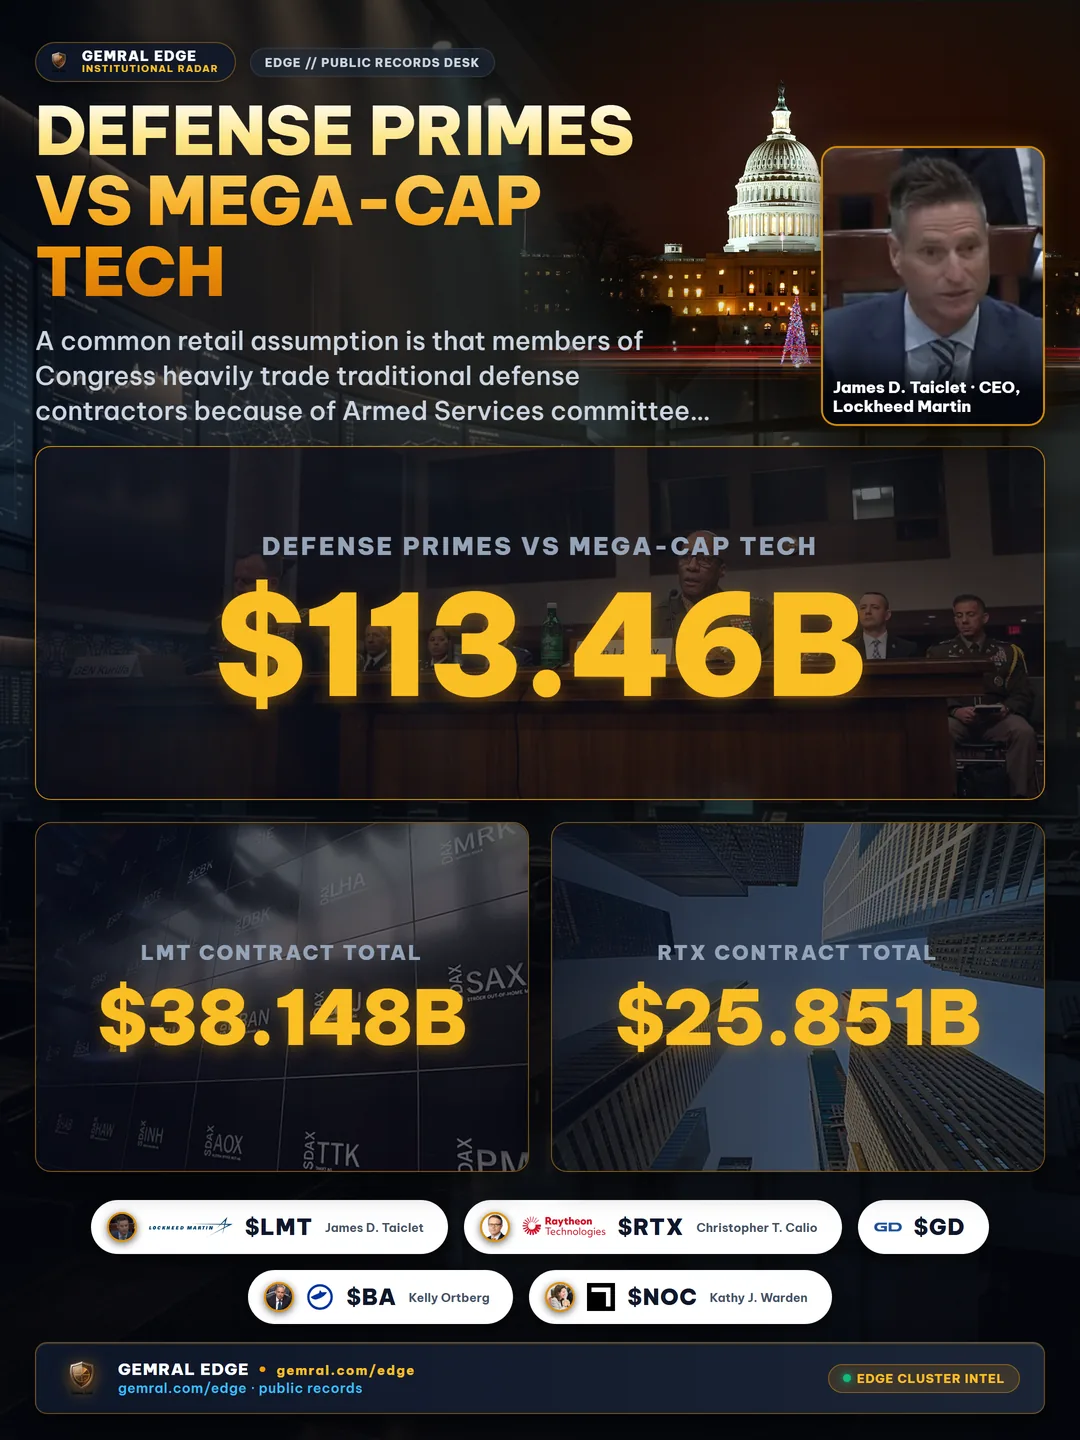
Across the entire 2026 federal procurement dataset through September 30, 2026, 15,001 contract transactions totaling $254.83B resolved to 345 listed tickers. Just five defense and industrial primes—Lockheed Martin (LMT), RTX Corporation (RTX), General Dynamics (GD), Boeing (BA), and Northrop Grumman (NOC)—accounted for $113.46B of that total, or 44.5% of all listed-ticker federal contract dollars recorded in 2026. Yet combined congressional trading across those five primes totaled only 25 transactions all year.
| Defense / Industrial Ticker | Federal Contract Actions | Contract Value (2026) | Lobbying Filings (Spend) | Congressional Trades (Buys / Sells) |
|---|---|---|---|---|
| LMT | 1,127 | $38.148B | 51 ($14.02M) | 8 (1 / 7) |
| RTX | 830 | $25.851B | 8 ($0.38M) | 2 (2 / 0) |
| GD | 969 | $22.991B | 70 ($13.30M) | 7 (5 / 2) |
| BA | 614 | $17.198B | 40 ($9.52M) | 7 (4 / 3) |
| NOC | 570 | $9.270B | 36 ($7.07M) | 1 (1 / 0) |
| HON | 108 | $6.395B | 45 ($6.44M) | 9 (4 / 5) |
Lockheed Martin exemplifies this asymmetry. In 2026, Lockheed Martin recorded 1,127 federal contract actions worth $38.148B and 51 lobbying filings totaling $14.02M—yet lawmakers disclosed only 8 trades in LMT all year, 7 of which were sales against a single purchase. General Dynamics logged 969 contract actions worth $22.991B and 70 lobbying filings totaling $13.30M, alongside just 7 congressional trades (5 buys vs 2 sells) across 4 members. Northrop Grumman generated $9.270B across 570 contract actions and $7.07M across 36 lobbying filings, yet saw only 1 congressional trade in 2026.
Analysts monitoring daily Pentagon contract announcements must also account for statutory reporting lags on defense procurement. Defense contract actions carry a mandatory 90-day publication delay in aggregate federal transaction feeds. Consequently, transaction totals through September 30, 2026 reflect awards obligated prior to the 90-day cutoff, whereas daily Pentagon announcements capture prime awards on the day of public release.
Lobbying Expenditure Velocity and the 45-Day STOCK Act Disclosure Window
Corporate lobbying filings operate on a quarterly statutory cadence under the Lobbying Disclosure Act, creating a distinct timing profile from both daily contract awards and 45-day congressional trade reports. In 2026, 4,066 lobbying filings totaling $536.88M resolved to 1,256 listed tickers—more than triple the 345 tickers that received direct federal contract obligations. That breadth explains why lobbying serves as a universal policy-engagement layer across technology, healthcare, financials, and industrials.
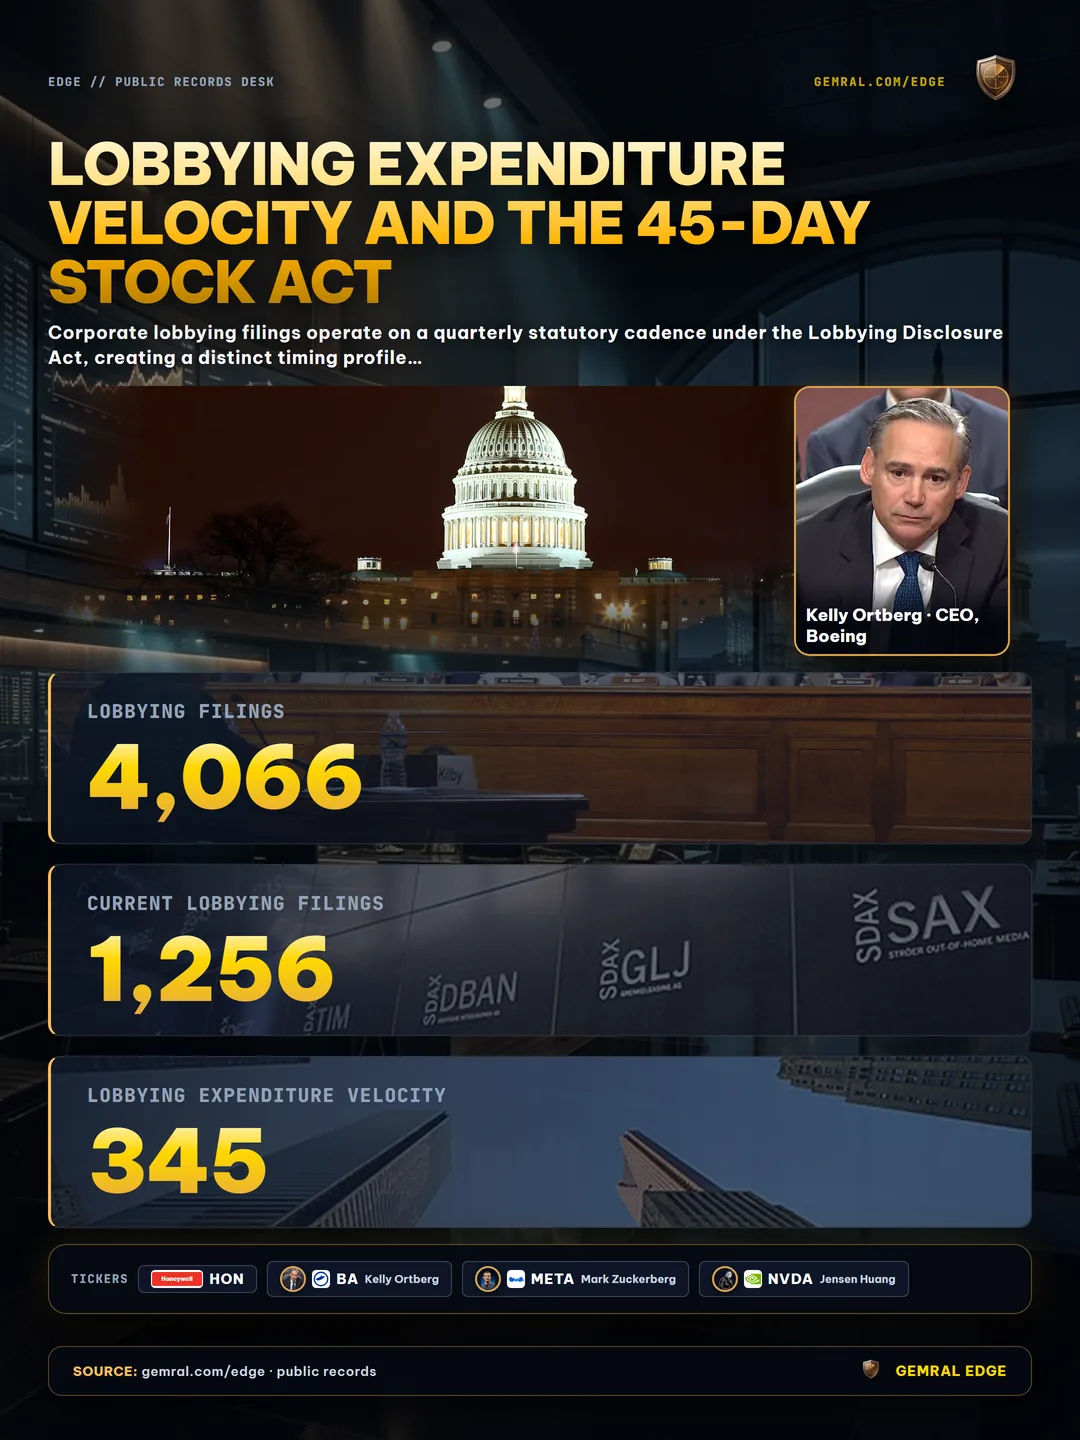
As examined in our corporate lobbying spending analysis, lobbying outlays often spike ahead of major appropriations markups, export-control rulemakings, or antitrust enforcement deadlines. When a company files $10M to $22M in annual lobbying disclosures across dozens of quarterly reports while members of Congress simultaneously trade its shares, the overlap identifies which corporate issuers are actively contesting legislative or regulatory outcomes at the exact moment lawmakers hold or adjust personal exposure.
Can members of Congress still buy and sell individual stocks in 2026? Yes. Despite recurring legislative proposals to mandate blind trusts or ban individual equity ownership, the existing STOCK Act framework permits trading subject to the 30-to-45-day disclosure window. That structural lag means institutional datasets must track two distinct timestamps for every trade: `tx_date` (when the order cleared) and `disclosure_date` (when the Periodic Transaction Report became publicly readable). Mixing those dates creates phantom signals; separating them preserves strict point-in-time integrity.
Notice how different sectors behave under this dual lens. Honeywell (HON) combined 108 federal contract actions ($6.395B) with 45 lobbying filings ($6.44M) and 9 congressional trades (4 buys vs 5 sells across 6 members). Boeing (BA) logged 614 contract actions ($17.198B), 40 lobbying filings ($9.52M), and 7 congressional trades (4 buys vs 3 sells across 4 members). By contrast, Meta Platforms ($22.11M lobbying) and Nvidia ($6.04M lobbying) generated zero direct prime contract awards in the listed-ticker dataset while attracting 40 and 65 congressional trades, respectively. Lobbying captures regulatory friction even when federal procurement dollars are zero.
Point-in-Time Entity Resolution: Separating Subsidiary Awards from Noise
Joining congressional trades, federal contract transactions, and lobbying filings onto a single equity ticker is deceptively difficult because government filings rarely use standardized exchange symbols. A defense contract may name a wholly owned subsidiary, a legacy corporate entity prior to a merger, or a joint venture holding company. Similarly, a Periodic Transaction Report may list a parent company's former name or an ambiguous share-class description, while a lobbying registration names an operating division rather than the publicly traded holding company.
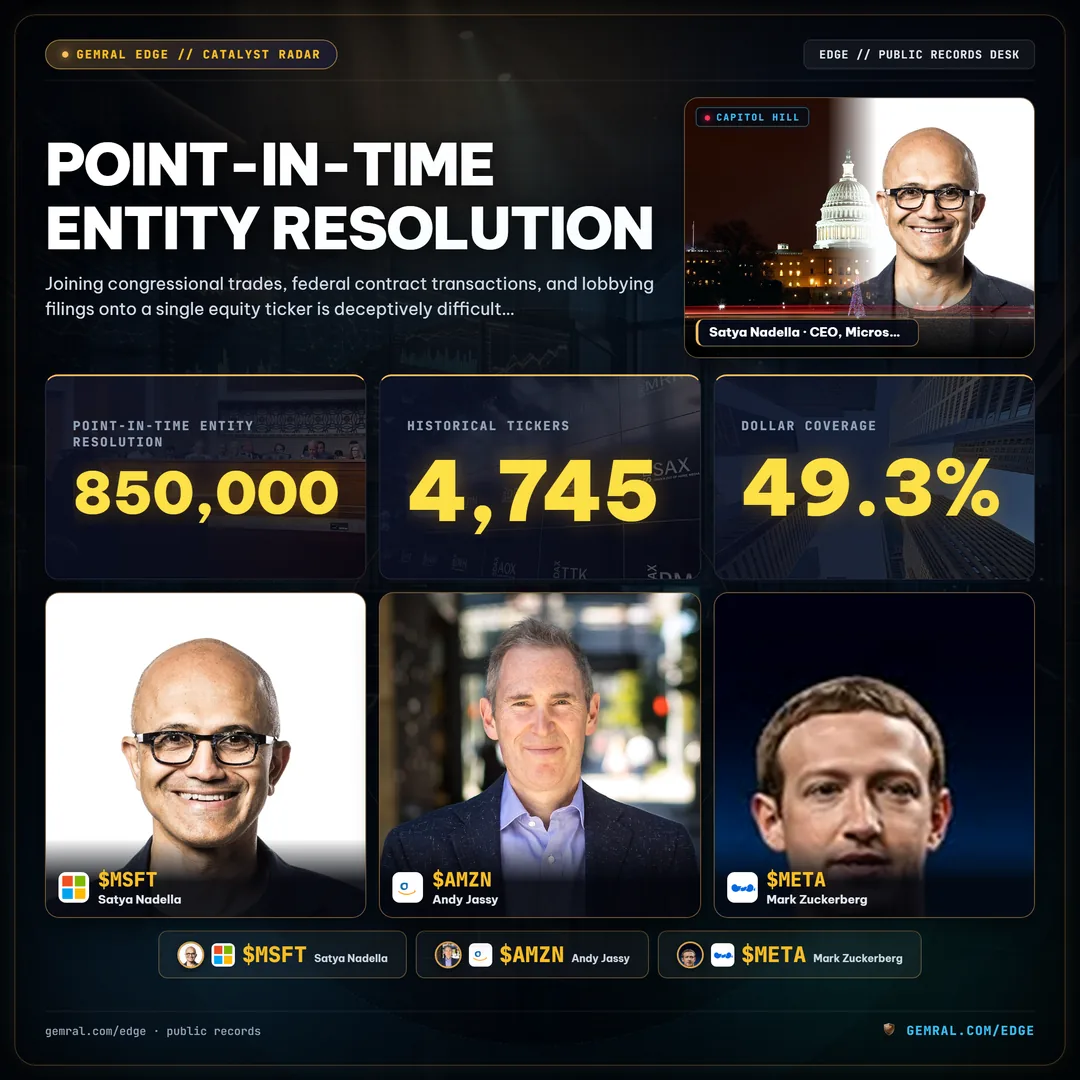
Without effective-dated parent-child corporate hierarchies, naive string matching either drops valid subsidiary records or creates look-ahead contamination by attributing historical contracts to an acquirer years before an acquisition actually closed. As documented in our point-in-time entity resolution guide, every record in an institutional-grade government dataset must resolve to the company and ticker that were valid on the day the record became public.
Across the Feed 1 historical archive—spanning 850,000+ resolved events and 4,745 distinct tickers—delisted, acquired, and renamed companies remain in the history under the ticker they carried at the time. That architecture prevents survivorship bias when evaluating historical congressional trading clusters or multi-year procurement series. When an acquired contractor disappears from public exchanges, its historical contract and lobbying trail stays anchored to its pre-merger ticker on every date prior to the deal close, then transitions to the parent ticker only after the effective acquisition date.
Consider how corporate mergers distort naive government-contract backtests when point-in-time parent links are missing. If a mid-cap defense or aerospace supplier won 15 federal awards between 2019 and 2023 and was subsequently acquired by a large prime contractor in 2024, a static lookup table retroactively assigns all 15 pre-acquisition awards to the acquiring prime's ticker. That retrospective reassignment manufactures artificial contract momentum for the acquirer years before the transaction occurred while erasing the target company's actual pre-merger federal backlog. Effective-dated corporate trees eliminate that distortion by preserving exact legal ownership on each publication date.
Equally important is transparent disclosure of coverage boundaries. In our FY2018+ federal contract transaction dataset, 49.3% of total contract dollars resolve to listed equity tickers (verified at 98.5% precision on sampled records, 193 of 196 checkable). The remaining contract dollars flow to private corporations, non-listed defense suppliers, non-profit research institutes, national laboratories, joint ventures, or unclassified vendors. Knowing that 49.3% boundary prevents analysts from misinterpreting unmapped private-sector awards as missing data.
Institutional Data Engineering: Joining Disclosures Without Look-Ahead Bias
For quantitative researchers and fundamental data sourcing teams, the primary engineering challenge in alternative government data is not ingestion—it is temporal alignment. Each of the three public streams analyzed in this report carries its own publication lag and amendment lifecycle. Congressional trades carry up to a 45-day reporting lag and occasional late amendments. Defense contract transactions carry a 90-day statutory publication lag. Lobbying filings arrive quarterly and are frequently amended in subsequent periods.

A production point-in-time schema enforces three non-negotiable rules across all joined tables:
- Immutable Publication Timestamps: Every record carries both its event date (`tx_date` or `action_date`) and its public availability timestamp (`disclosure_date` or `source_published_at`). Backtests and historical screens filter strictly on public availability so no signal can appear before a market participant could have observed it.
- Append-Only Revision Logging: When a lawmaker files an amended Periodic Transaction Report or a contractor modifies an award amount, the amendment is written to a revision log (the log started in October 2026) rather than silently overwriting the original historical state.
- Sampled Accuracy Gates Before Release: Every record type ships only after passing a minimum 95% sampled accuracy audit against the original public filings. In the October 23, 2026 accuracy gate, 10 of 10 live record types passed that threshold, including insider trades (100%, 200/200), contract awards (98.5%, 193/196), congressional trades (97.7%, 168/172), pre-award notices (97.0%, 192/198), bid protests (97.0%, 194/200), and lobbying filings (96.0%, 192/200).
Institutional data teams evaluating these datasets for systematic or fundamental research can inspect live sample records directly in the data preview portal. Feed 1 datasets are delivered as Parquet files with SHA-256 manifests and data dictionaries, alongside a read-only REST API and MCP server for AI-assisted research workflows.
Why do institutional data buyers pair these three streams instead of consuming congressional trades in isolation? Because single-stream signals suffer from high false-positive rates when detached from legislative and fiscal context. A cluster of 24 lawmakers trading Microsoft or 15 lawmakers trading Amazon carries materially different analytical weight when cross-referenced against $0.376B and $0.589B in federal contract obligations and $10.55M and $16.50M in active lobbying expenditures. Conversely, observing $38.148B in Lockheed Martin contract actions alongside only 1 congressional buy demonstrates that procurement scale alone does not drive personal lawmaker equity accumulation. Measuring all three trails on a unified point-in-time timeline lets research desks test policy hypotheses empirically without guessing.
Cross-Signal Methodology, Known Data Coverage Limits, and Verification
All figures in this report are derived from public US government disclosure records normalized through a point-in-time entity-resolution pipeline as of November 19, 2026 (congressional trades and lobbying filings) and September 30, 2026 (federal contract transactions reflecting the 90-day defense reporting lag). Every count and dollar figure reflects verified database totals rather than estimates or extrapolated projections.
Researchers using cross-signal government datasets should account for four structural limits built into the underlying public records:
- Bracketed Trade Amounts: Congressional Periodic Transaction Reports disclose dollar ranges rather than exact trade sizes, making trade count, buy-vs-sell ratio, and distinct member breadth more reliable cross-sectional metrics than estimated dollar sums.
- Defense Reporting Lag: Aggregate federal contract transaction tables exclude defense actions still inside the statutory 90-day publication delay; recent quarter totals will step up once delayed tranches post.
- Private Vendor Share: Only 49.3% of FY2018+ federal contract transaction dollars map to publicly listed equity tickers; the remainder reflects private contractors, non-profits, and government entities.
- No Performance or Price Claims: Public disclosure overlap measures institutional and legislative attention around a corporate entity; it does not constitute a price forecast, trading recommendation, or guarantee of future equity performance.
Explore the full dataset architecture and live congressional trade tables at gemral.com/edge/congress, or inspect sample records at gemral.com/edge/data-preview.
Public data · not investment advice. Data comes only from public sources and contains no material non-public information.
Frequently asked questions
What stocks is Congress buying most in 2026?
Based on 2026 public Periodic Transaction Reports through November 19, Microsoft leads all equities with 53 disclosed purchases across 24 members of Congress, followed by S&P Global with 32 purchases, Uber with 29 purchases, Amazon with 27 purchases, and Meta Platforms and Home Depot with 26 purchases each.
How long does Congress have to report stock trades?
Under the STOCK Act of 2012, members of Congress must file Periodic Transaction Reports within 30 days of receiving notice of a transaction and no later than 45 days after the trade date itself.
How do federal contracts and lobbying relate to congressional stock trades?
Combining congressional trade disclosures with federal contract obligations ($254.83B across 345 listed tickers in 2026) and corporate lobbying expenditures ($536.88M across 1,256 tickers in 2026) shows which companies sit at the intersection of legislative oversight, federal procurement, and active policy advocacy.
Where can institutional teams verify point-in-time congressional and contract datasets?
Institutional research teams can review dataset coverage, accuracy gates, and schema documentation on Gemral Edge at /edge/data-coverage and inspect sample records at /edge/data-preview.