Lobbying Spending: How Corporate Policy Expenditures Track Federal Contract Awards
An empirical breakdown of 2025–2026 quarterly federal lobbying disclosures, comparing policy capital velocity across defense prime contractors and mega-cap technology platforms alongside billion-dollar procurement awards.
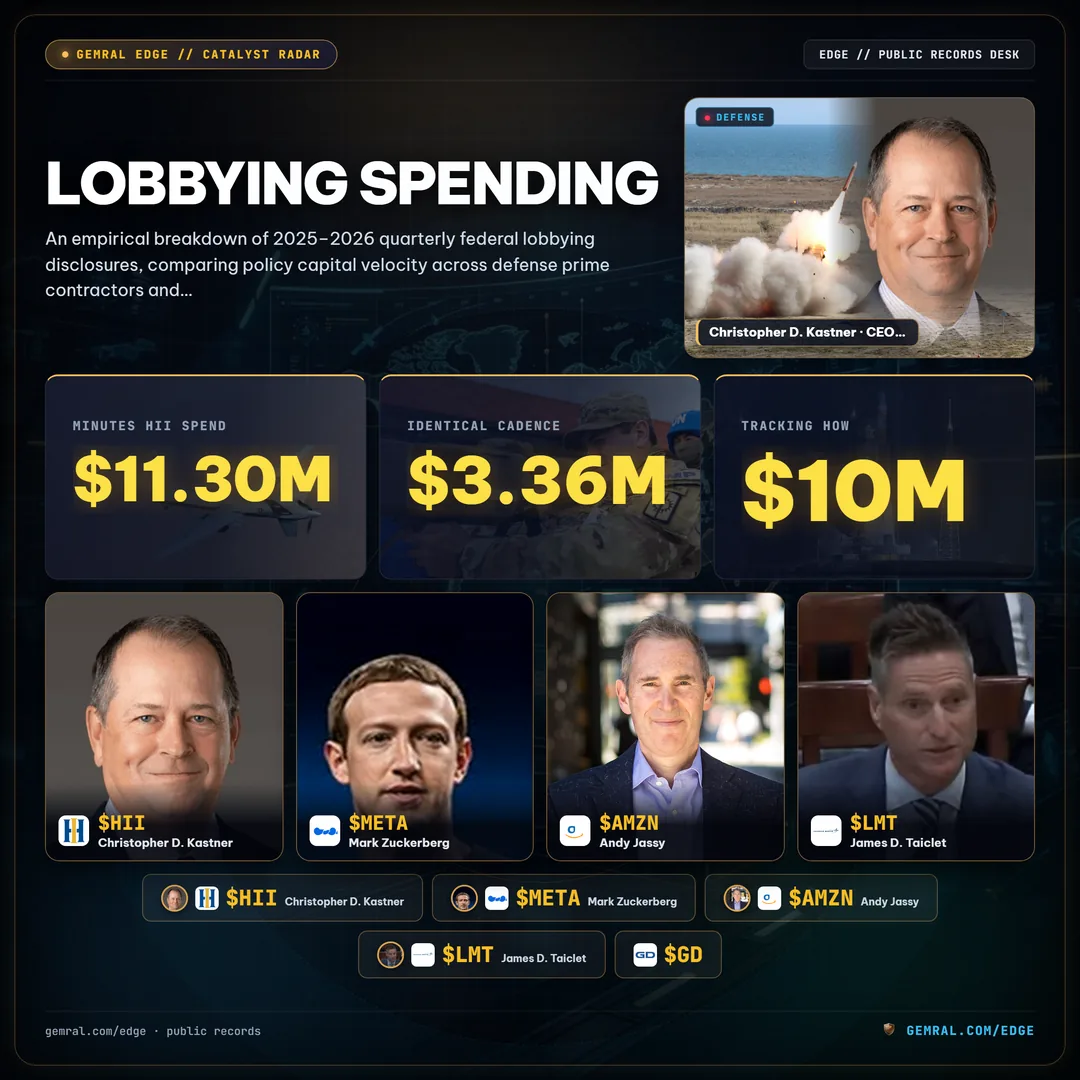
The Scale of Corporate Lobbying Spending: Quarterly Policy Capital Disclosures
$11.30 million in a single quarter from one military shipbuilder. Across Q3 2026 federal policy disclosures, Huntington Ingalls Industries (HII) deployed $11.30 million across five legislative issue codes—Energy (ENG), Labor (LBR), Taxation (TAX), Foreign Relations (FOR), and Defense (DEF). Over the exact same 2026 calendar window, Meta Platforms (META) committed $18.95 million across Q1 through Q3 ($7.08 million in Q1, $5.99 million in Q2, and $5.88 million in Q3), following $26.29 million in total 2025 quarterly filings. Institutional desks tracking lobbying spending monitor these mandatory quarterly filings because corporate policy budgets concentrate capital months before congressional appropriations and federal procurement contracts clear committee votes.
The filing is public. The scale and timing relative to legislative calendars are the signal. Under the Lobbying Disclosure Act of 1995, registered external lobbying firms and in-house corporate government affairs teams must report quarterly expenditures rounded to the nearest $10,000, specifying both the targeted federal agencies and exact legislative issue codes. When a defense prime contractor or pharmaceutical giant accelerates quarterly policy outlays by 30% to 100% above its trailing 4-quarter baseline, that capital allocation marks an active policy campaign rather than routine Washington maintenance.
Lobbying Spending by Company: Defense Prime Contractors vs Mega-Cap Technology
Examining 2025–2026 US Senate Office of Public Records filings reveals a sharp structural split between two dominant corporate spenders: defense prime contractors protecting multi-year Pentagon procurement lines, and mega-cap technology or biopharmaceutical companies defending platform and pricing regulation. While Meta Platforms and Amazon.com Services (AMZN) spread expenditures across 10 to 22 distinct issue codes per quarter—spanning trade (TRD), taxes (TAX), copyright (CPT), and homeland security (HOM)—defense contractors concentrate capital tightly around appropriations and defense authorization bills.
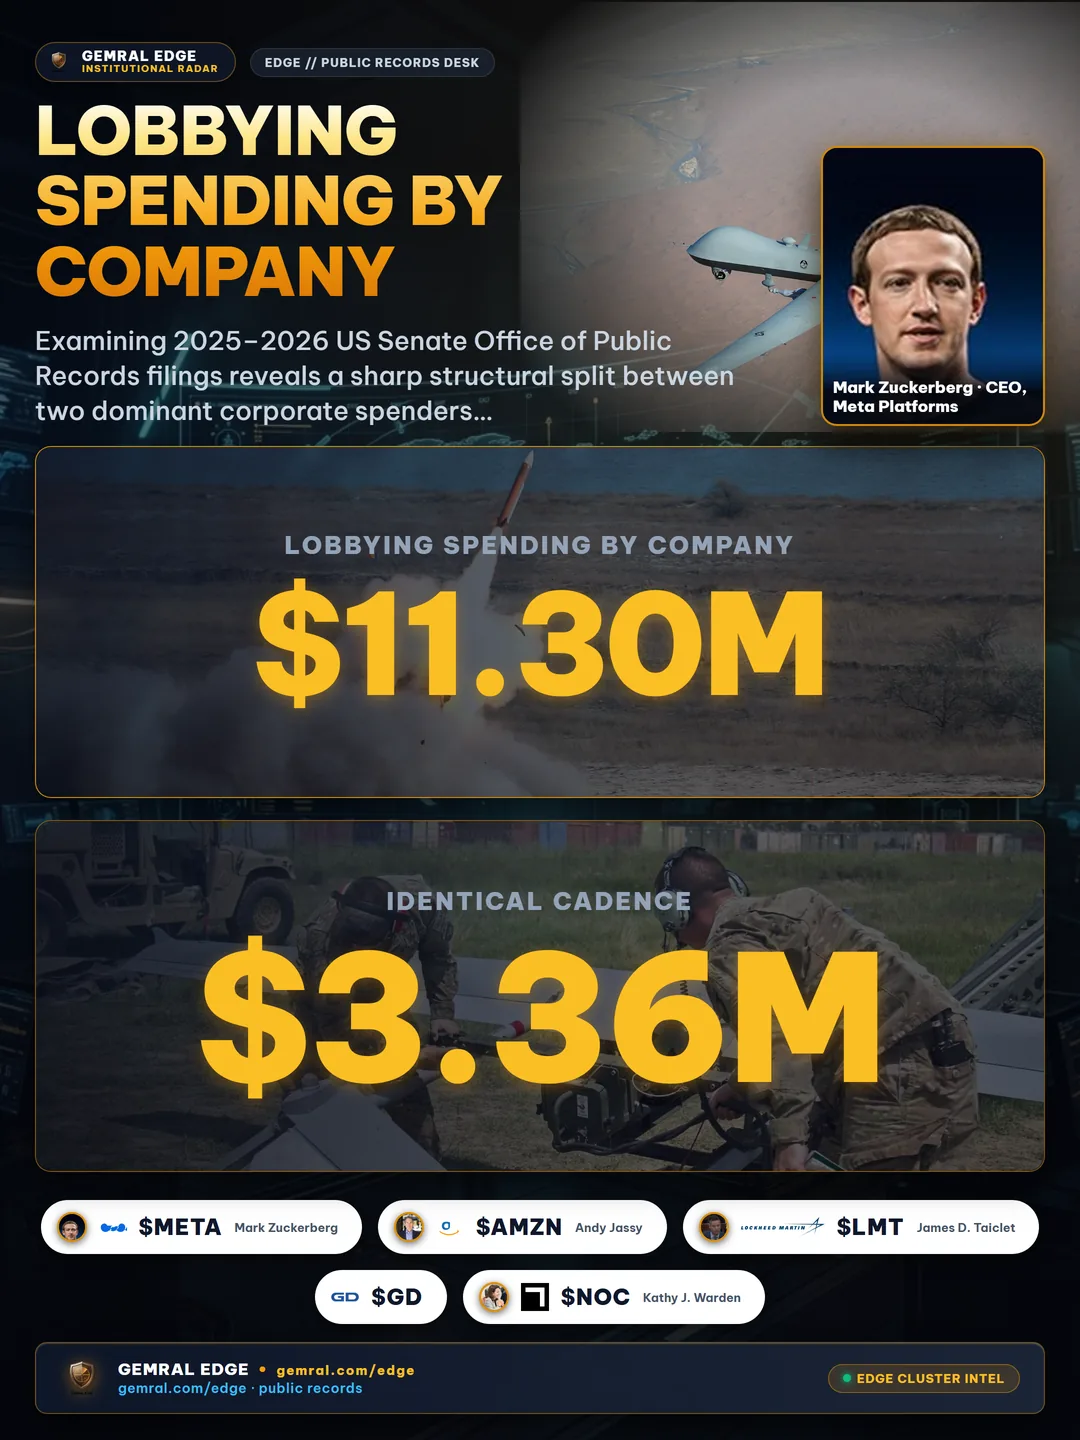
| Ticker & Issuer | 2026 Filing Window | Disclosed Spend | Primary Issue Codes |
|---|---|---|---|
| HII (Huntington Ingalls) | Q3 2026 | $11.30M | DEF, ENG, LBR, TAX, FOR |
| META (Meta Platforms) | Q1–Q3 2026 | $18.95M | TEC, TRD, TAX, CPI, LAW |
| LMT (Lockheed Martin) | Q1–Q3 2026 | $12.41M | DEF, BUD, AER, FOR, TRD |
| GD (General Dynamics) | Q1–Q3 2026 | $10.10M | DEF, BUD, MAR, AVI, TAX |
| AMZN (Amazon Services) | Q1 & Q3 2026 | $8.87M | TEC, DEF, TAX, TRD, ENG |
| GILD (Gilead Sciences) | Q3 2026 | $6.58M | HCR, MMM, TRD, CPT, BUD |
Lockheed Martin (LMT) maintained steady quarterly pressure throughout 2026—reporting $4.14 million in Q1, $4.18 million in Q2, and $4.09 million in Q3—up from $3.61 million in Q1 2025. General Dynamics (GD) followed an identical cadence at $3.36 million in Q1, $3.42 million in Q2, and $3.32 million in Q3 2026, while Northrop Grumman (NOC) recorded $3.62 million in Q1 2025. Comparing quarterly consistency against sudden spikes isolates companies shifting from passive legislative monitoring to active contract or regulatory defense.
Lobbying Spending by Industry and Database Normalization: Filtering Noise from Policy Signal
Raw disclosure tables contain thousands of fragmented subsidiary names, trade associations, and external consulting firms. Evaluating lobbying spending by industry requires normalizing raw client strings—such as mapping "AMAZON.COM SERVICES LLC" to AMZN or linking regional utility subsidiaries to their parent holding company—before aggregating expenditures into a structured lobbying spending database. Without deterministic entity resolution, institutional analysts miss up to 35% of subsidiary-level policy spending across energy, healthcare, and aerospace issuers.
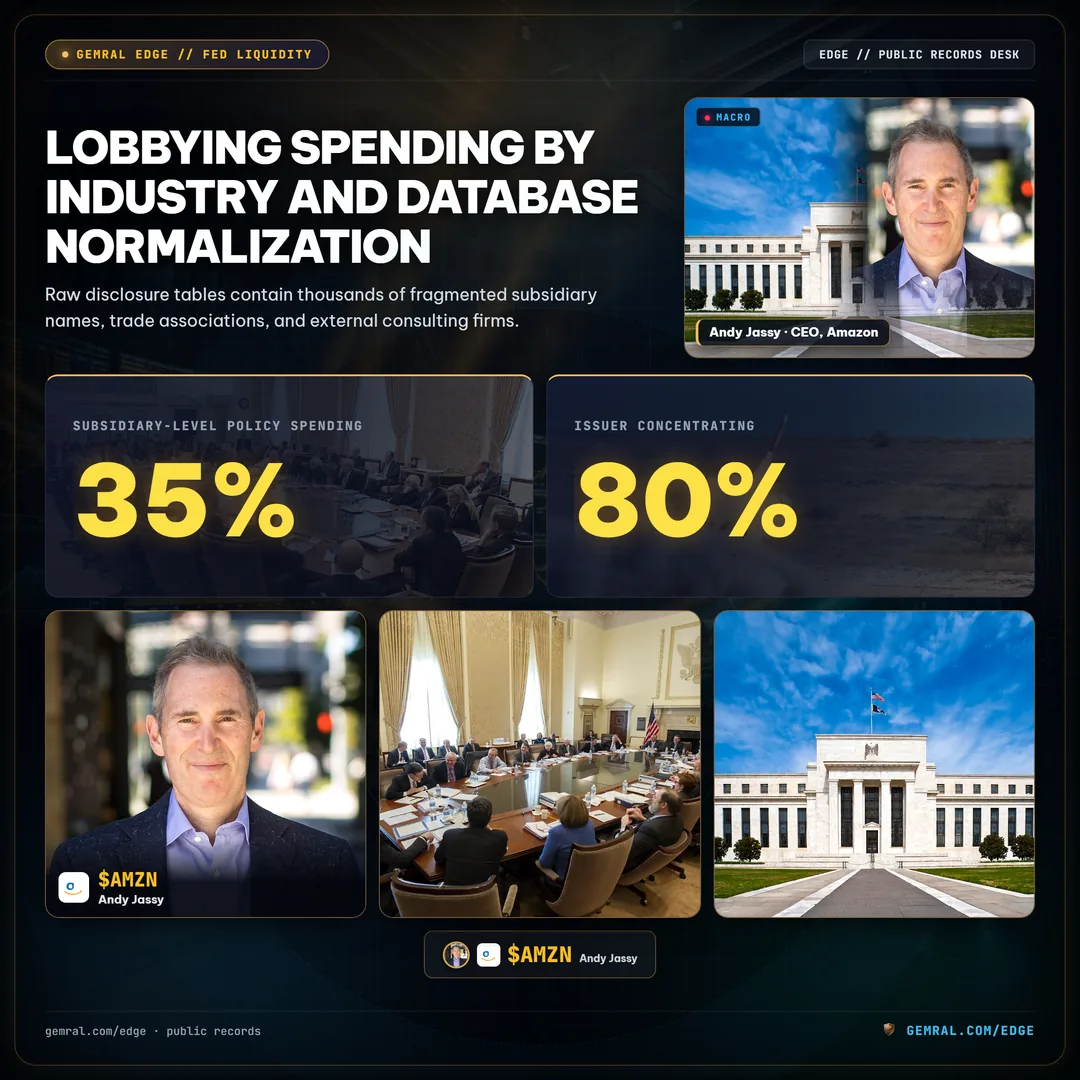
Quantitative teams also strip out non-monetary registration filings (Type RR) that report null dollar amounts, isolating quarterly financial activity reports (Type Q1 through Q4) and measuring lobbying spending by company against total revenue and trailing 8-quarter spending averages. Within the QUASAR cross-layer intelligence framework, normalized quarterly spend is evaluated alongside legislative issue code concentration: an issuer filing across 22 broad codes like Amazon reflects defensive regulatory posture, whereas an issuer concentrating 80% of spend in Defense (DEF) and Energy (ENG) signals targeted procurement or infrastructure lobbying.
Cross-Signal Convergence: Connecting Lobbying Velocity to Federal Contract Awards
One quarterly filing can be noise. Independent trails converging on the same ticker across policy disclosures and procurement records form a measurable signal. In recent federal procurement disclosures tracked in our federal contract awards archive, Fluor Corporation (FLR) received $2.409 billion in Department of Defense contract awards, while L3Harris Technologies (LHX) secured $918 million in Department of Transportation awards and Granite Construction (GVA) landed $515 million from the Department of Homeland Security.
When corporate lobbying expenditures climb in the two quarters preceding major agency funding cycles—such as Pentagon shipbuilding appropriations, grid modernization grants, or nuclear SMR power infrastructure awards—the overlap links policy capital allocation directly to federal budget execution. Rather than treating Washington filings as isolated political trivia, multi-asset desks compare lobbying velocity against backlog expansion and Treasury funding and fiscal liquidity flows to identify which sectors are capturing federal outlays.
Disclosure Lag and Methodological Guardrails: Avoiding Look-Ahead Bias in Policy Data
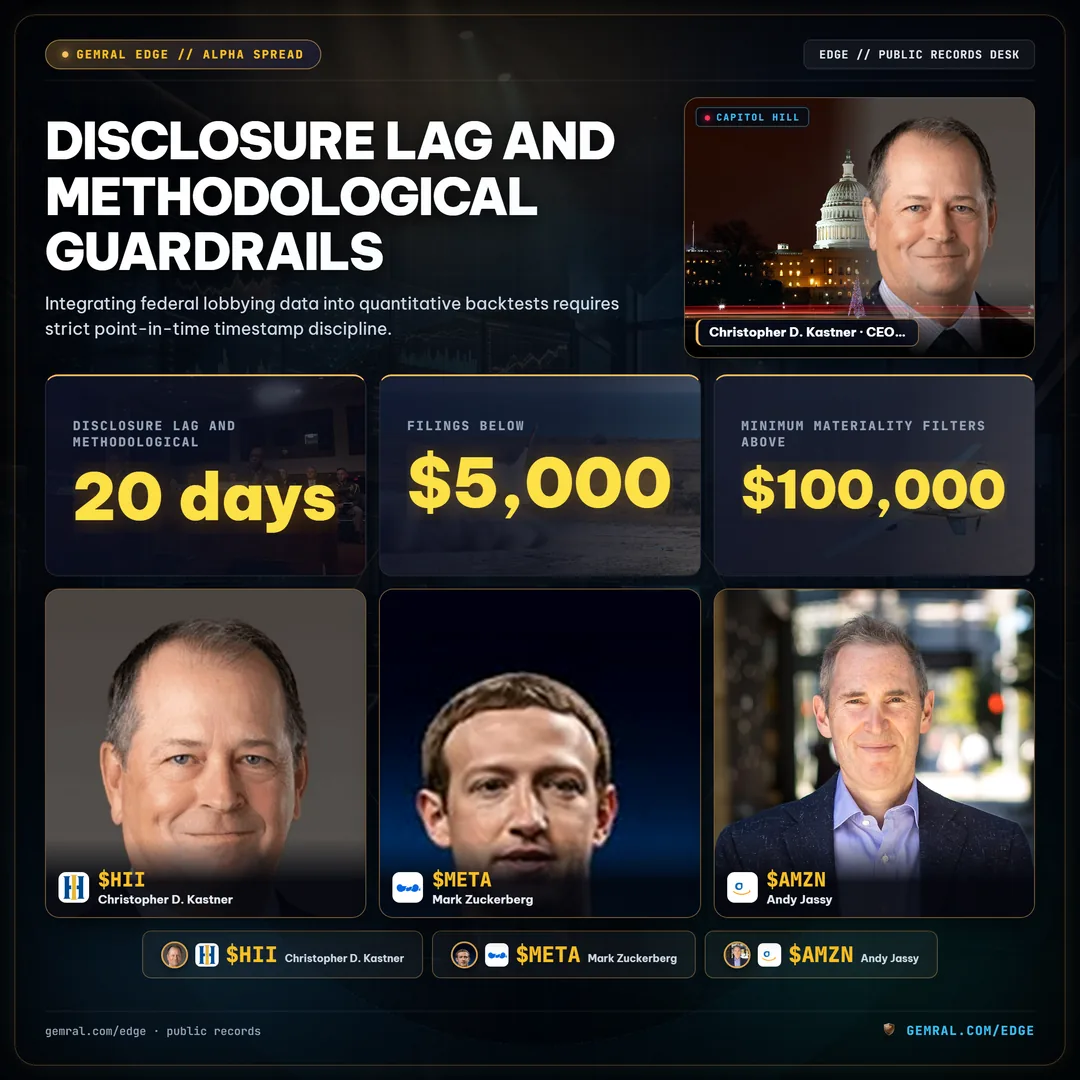
Integrating federal lobbying data into quantitative historical evaluations requires strict point-in-time timestamp discipline. Every quarterly disclosure carries two separate temporal anchors: the reporting period (for example, Q3 covering July 1 through September 30) and the actual public posting timestamp (`dt_posted`), which occurs up to 20 days after quarter-end under federal statutory deadlines (October 20 for Q3, January 20 for Q4, April 20 for Q1, and July 20 for Q2).
- 01. Point-in-Time Alignment: Never evaluate quarterly lobbying amounts using the period end date; signal availability begins strictly after the exact `dt_posted` timestamp hits the public registry.
- 02. Threshold Rounding Effects: Filings below $5,000 per quarter are exempt from dollar reporting, while reported totals are rounded to the nearest $10,000, requiring minimum materiality filters above $100,000 to avoid noise.
- 03. Amendment Deduplication: Registrants frequently submit amended quarterly reports (Type Q3A) weeks after the initial filing; databases must deduplicate original and amended filings to prevent double-counting single-quarter expenditures.
Institutional Telemetry: Integrating Policy Expenditure Flows into Multi-Asset Risk Models
In modern institutional macro research, corporate lobbying velocity serves as a structural complement to market-based risk telemetry. While equity options and the VIX term structure price short-term 30-day variance expectations, quarterly policy disclosures reveal multi-year capital commitments across defense, energy, healthcare, and semiconductor supply chains. Tracking how $10 million+ quarterly policy budgets align with multi-billion dollar federal contract pipelines gives portfolio managers an auditable, empirical map of government-driven revenue durability.
Frequently asked questions
How is corporate lobbying spending reported under federal law?
Under the Lobbying Disclosure Act of 1995, registered lobbying firms and in-house corporate policy teams must file quarterly financial disclosure reports detailing total lobbying expenditures (rounded to the nearest $10,000), targeted federal agencies, and specific legislative issue codes.
Which publicly traded sectors exhibit the highest lobbying spending velocity?
Defense prime contractors, mega-cap technology platforms, and biopharmaceutical firms consistently lead quarterly corporate lobbying expenditures. In 2026 disclosures, defense shipbuilders such as Huntington Ingalls Industries (HII) reported $11.30 million in a single quarter, while Meta Platforms (META) deployed $18.95 million across Q1 through Q3.
How do quantitative analysts correlate lobbying spending by company with federal contract awards?
Institutional desks track sudden quarter-over-quarter spikes in corporate lobbying spending across defense (DEF), energy (ENG), and technology (TEC) issue codes as leading indicators of legislative budget priorities, comparing policy expenditure velocity against subsequent Department of Defense and civilian agency procurement awards.
Where can researchers access a structured corporate lobbying spending database?
Public lobbying disclosures are published by the US Senate Office of Public Records and the Clerk of the US House of Representatives. Point-in-time quantitative datasets normalize these filings by ticker symbol, entity resolution, and sector issue codes for cross-asset policy tracking.