VIX Term Structure: Contango, Backwardation, and Volatility Arbitrage Dynamics
An empirical market report decomposing the CBOE Volatility Index futures curve, persistent roll yield mechanics in contango regimes, backwardation crash signatures, the variance risk premium, and systematic institutional volatility arbitrage architectures.
The Architecture of the VIX Futures Curve: Spot Index vs Forward Volatility Expectations
The Chicago Board Options Exchange (CBOE) Volatility Index, universally designated by the ticker VIX, measures the annualized 30-day expected volatility of the S&P 500 stock index calculated from real-time prices of out-of-the-money SPX call and put options. While the spot VIX index provides a continuous calculation of 30-day market variance, it is fundamentally an uninvestable metric. Institutional market participants cannot buy or sell the spot VIX directly; they must interact with tradable derivative instruments, specifically exchange-traded VIX futures and options. Institutional desks monitoring our vix term structure framework analyze the divergence between spot index readings and forward futures pricing to decipher market risk expectations.
The VIX futures contract, inaugurated in 2004, reflects the market price for forward 30-day implied volatility delivered at the future settlement date. Plotting the consecutive settlement prices across monthly expiries—from the front-month contract (M1) out to the eighth or ninth month (M8 or M9)—produces the VIX term structure. Unlike physical commodities where the forward futures curve reflects physical storage, insurance, and interest rates (the classical cost of carry), the VIX term structure reflects the expected path of future 30-day SPX variance plus a structural risk premium demanded by options underwriters.
A persistent structural feature of this curve is that spot VIX is not tied to futures via spot-futures cash-and-carry arbitrage. If crude oil or gold futures trade higher than spot, an arbitrageur purchases the physical asset, stores it, sells the future, and locks in a riskless return. Because spot volatility cannot be stored in a warehouse or held in a custody account, no direct spot-futures arbitrage exists to pin the front-month contract to the spot index prior to expiration day. Front-month VIX futures settle to spot VIX only at the final Wednesday morning settlement calculation. Throughout its trading lifecycle, a VIX futures contract trades purely on forward probabilistic distributions. In similar fashion, our macro teardown of treasury basis trade hedge funds highlights how cash-futures spreads depend on systemic clearing haircuts and repo funding liquidity.
Thermodynamics of Contango: Measuring the Roll Yield Decay in Constant-Maturity Volatility Products
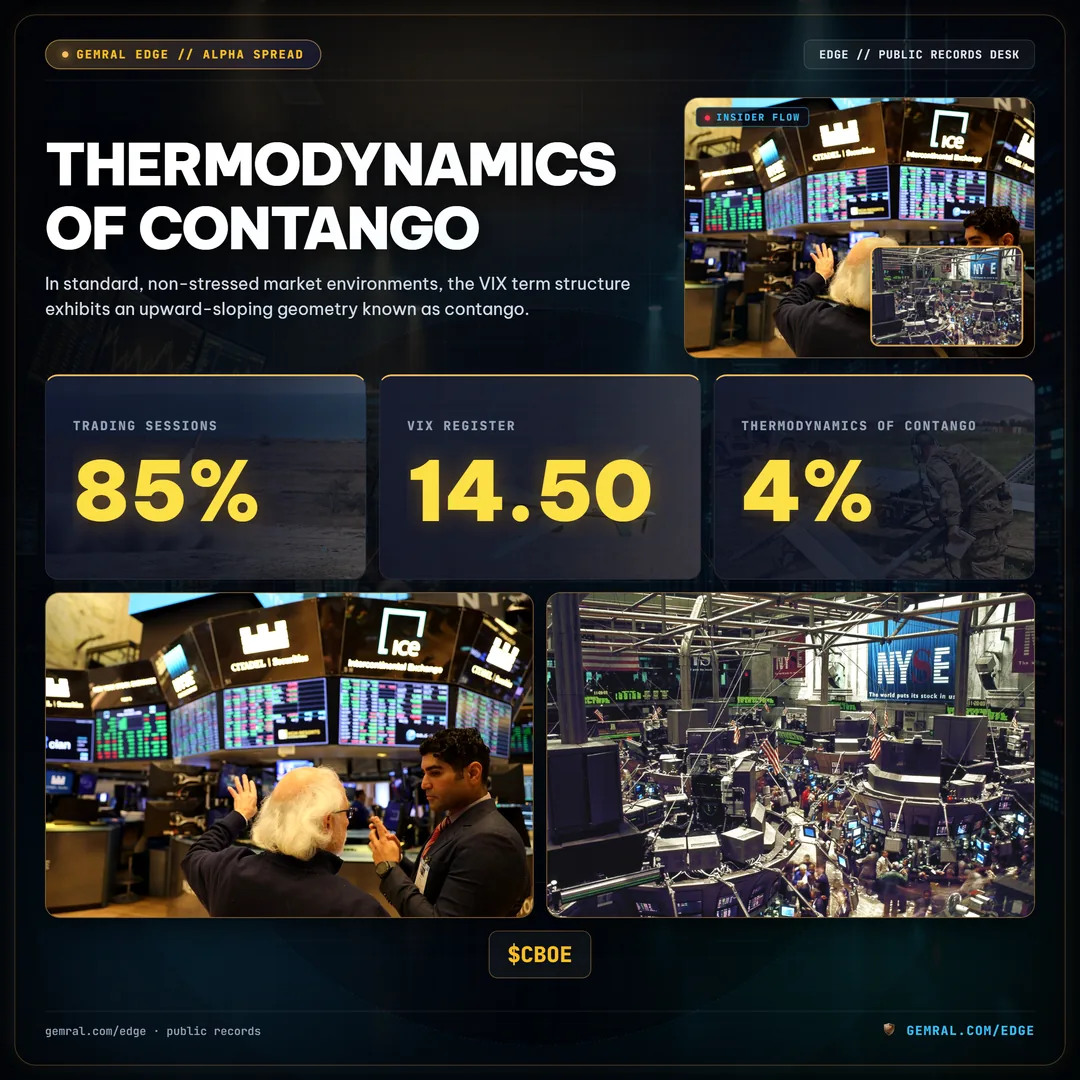
In standard, non-stressed market environments, the VIX term structure exhibits an upward-sloping geometry known as contango. Historically, the curve resides in contango between 80% and 85% of all trading sessions since VIX futures launched in 2004. In a contango state, each successive futures contract trades at a price higher than its preceding month. For example, spot VIX might register 14.50, while the front-month M1 future trades at 15.50, the second-month M2 future trades at 16.50, and the fourth-month M4 future trades at 18.00.
Contango is the natural resting posture of the volatility market due to temporal uncertainty. Market participants assign a higher probability to market shocks occurring over a six-month horizon than over a six-day horizon. Consequently, forward volatility protection commands a risk premium. However, this upward slope imposes severe mechanical drag on long volatility positions:
Negative Roll Yield Mechanics
As expiration approaches, a futures contract trading above spot volatility must inevitably converge down toward the spot index at final settlement.
This steady downward convergence generates negative roll yield, draining between 4% and 8% of portfolio capital per month from funds holding perpetual long front-month futures positions.
Constant-Maturity Rolling Drag
Exchange-traded products maintaining a targeted 30-day maturity profile must systematically sell decaying M1 futures and purchase higher-priced M2 futures every single trading day.
This continuous 'sell-low, buy-high' rebalancing forces long volatility exchange-traded notes into catastrophic long-term capital destruction, frequently losing over 75% of cumulative value per annum.
For quantitative volatility sellers, contango represents an attractive source of systematic cash flow. By selling forward futures at 16.00 and allowing them to decay toward a baseline spot reading of 12.50 to 14.00, systematic short-volatility programs extract structural yield from institutional hedgers willing to overpay for tail risk protection.
The Mechanics of Backwardation: Volatility Inversions, Liquidity Shocks, and Systemic Dislocations
When sudden macroeconomic crises or equity market drops materialize, the VIX term structure undergoes an immediate, violent phase transition termed backwardation. In backwardation, the curve inverts completely: spot VIX surges above front-month futures, and front-month futures (M1) trade significantly above second-month (M2) and longer-dated contracts.

Backwardation occurs because institutional demand for instantaneous downside portfolio protection completely overwhelms the supply of short-term options liquidity. Market makers and institutional desks hedge out immediate gamma exposure by purchasing front-month futures and index puts, driving short-dated volatility to extreme premiums. During acute backwardation events, spot VIX can spike to 40, 50, or above 80, while the six-month futures contract trades at 28.00.
| Term Structure Regime | M1 vs M2 Spread | Roll Yield Impact | Underlying Market Context |
|---|---|---|---|
| Steep Contango | M1 < M2 (-1.5 to -3.0 pts) | Severe Negative Roll Drag (-6% to -10%/mo) | Calm equity bull trends, complacency, central bank easing |
| Mild Contango | M1 < M2 (-0.2 to -1.0 pts) | Moderate Roll Drag (-2% to -5%/mo) | Neutral market conditions, baseline equity consolidation |
| Flat Curve | M1 ≈ M2 (±0.2 pts) | Neutral Roll Yield (~0%) | Emerging macro inflection points, pre-FOMC positioning |
| Acute Backwardation | M1 > M2 (+2.0 to +15.0 pts) | Positive Roll Yield for Longs | Liquidity shocks, systemic bank panics, flash crashes |
Detailed event documentation within our empirical archive on vix volatility arbitrage dynamics underscores that while backwardation regimes persist for less than 15% of historical trading periods, they generate non-linear capital losses for short volatility positions that do not enforce strict structural stop-loss thresholds.
The Variance Risk Premium (VRP): Why Implied Volatility Structurally Exceeds Realized Volatility
At the core of volatility derivative pricing lies an empirical market anomaly: the Variance Risk Premium (VRP). The VRP is defined as the mathematical difference between implied variance (derived from options prices) and subsequent realized variance (the actual historical price movement of the underlying S&P 500 index over the same 30-day window).
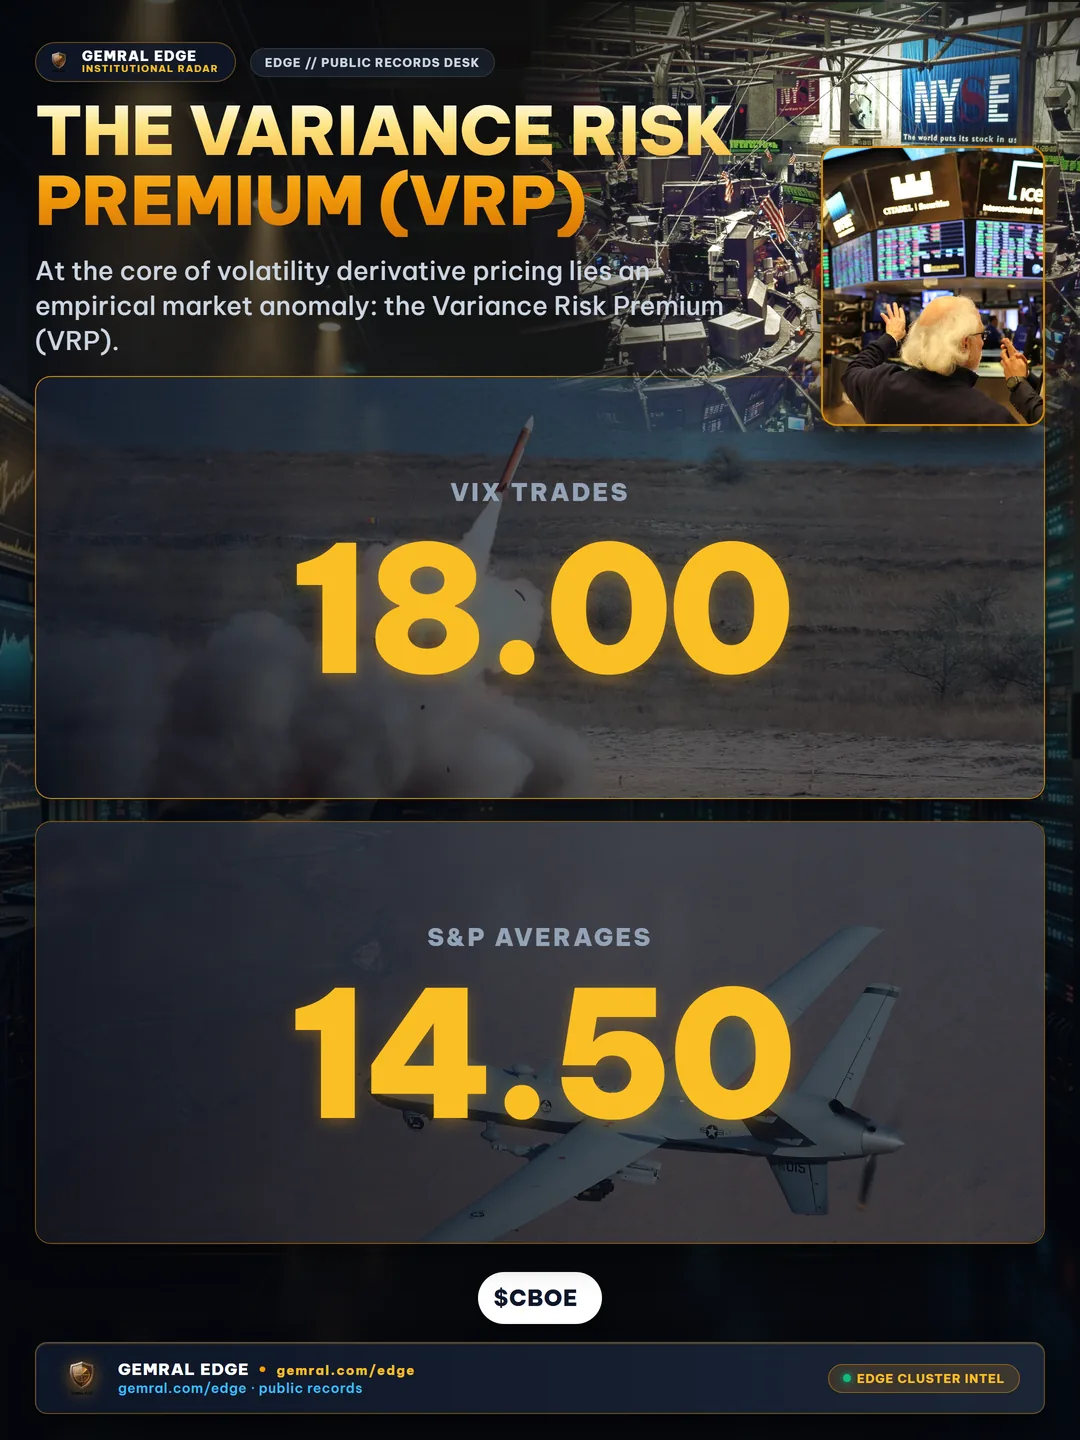
Across multi-decade sample periods spanning 1993 to 2026, the 30-day implied volatility of the S&P 500 has traded at a persistent premium over actual realized volatility. The historical average spread equals between 2 and 4 volatility points. For example, when the VIX trades at 18.00, the trailing 30-day realized volatility of the S&P 500 averages roughly 14.50.
This structural premium exists because large institutional asset owners (such as pension funds, sovereign wealth managers, and mutual funds) manage long-only equity portfolios totaling tens of trillions of dollars. Because these funds face career risk and mandate restrictions against liquidation during downturns, they systematically purchase S&P 500 put options to hedge downside drawdowns. This inelastic hedging demand inflates the implied volatility of index options above actuarially fair levels. Market makers and institutional option sellers demand this premium as compensation for accepting asymmetric, left-tail crash risk.
To quantify the structural magnitude of the Variance Risk Premium across varying market regimes, institutional researchers evaluate historical spread data spanning multiple economic cycles. During the post-2008 quantitative easing era, the annualized implied volatility averaged 17.8%, whereas trailing 30-day realized volatility registered at 14.2%, yielding an average VRP of 3.6 volatility points. Even across periods of prolonged equity consolidation, the variance spread rarely inverts, underscoring that institutional hedging demand operates as a continuous structural sink for market liquidity.
| Historical Regime Cycle | Average 30-Day Implied Vol (VIX) | Average 30-Day Realized Vol (SPX) | Net Variance Risk Premium (VRP) |
|---|---|---|---|
| Pre-GFC Era (2004 - 2007) | 13.5% | 10.8% | +2.7 vol pts |
| Post-Crisis Recovery (2010 - 2017) | 15.2% | 11.7% | +3.5 vol pts |
| Post-Pandemic Regime (2021 - 2024) | 19.4% | 15.8% | +3.6 vol pts |
| Modern Baseline (2025 - 2026) | 16.1% | 12.9% | +3.2 vol pts |
Mathematical Frameworks: Pricing VIX Futures via the SPX Options Implied Volatility Surface
Formally, the VIX index is calculated using a model-independent formula developed by Demeterfi, Derman, Kamal, and Zou (1999) and codified by CBOE. It extracts the risk-neutral expectation of 30-day variance by integrating across an infinite continuum of out-of-the-money put and call options:

// Theoretical VIX Formula
σ² = (2 / T) * ∑ [ ΔK_i / K_i² ] * e^(R * T) * Q(K_i) - (1 / T) * [ (F / K_0) - 1 ]²
// Where T is time to expiration, F is forward index price, K_0 is first strike below F,
// and Q(K_i) is the midpoint bid-ask price of option strike K_i.
When pricing a VIX futures contract expiring at time T_F, derivatives quants must price a forward 30-day variance swap starting at T_F and concluding at T_F + 30 days. Because volatility is mean-reverting and displays negative correlation with equity spot prices (the leverage effect), pricing forward VIX contracts requires calibrating continuous-time stochastic volatility models, such as the Heston model or rough fractional volatility frameworks.
When pricing forward 30-day volatility contracts, the at-the-money straddle pricing relationship dictates that 30-day implied variance reflects approximately 1.25 times the expected absolute daily move, calibrated against 252 annual trading days. Out-of-the-money puts with 25-delta and 10-delta strikes trade at implied volatility premiums between 4.5% and 8.5% above corresponding at-the-money 50-delta options, establishing steep downside skew.
Crucially, because VIX is the square root of integrated variance, Jensen's Inequality dictates that the expected square root of variance is strictly less than the square root of expected variance: E[√V] < √(E[V]). Consequently, forward VIX futures prices must trade at a mathematical discount to the square root of the forward variance swap strike, a nuance that quantitative arbitrage desks exploit when constructing cross-asset volatility trades.
In institutional derivatives trading desks, parameterizing the implied volatility surface across discrete strikes and maturities requires establishing strict non-arbitrage bounds. When solving for forward implied volatility curves, quantitative desks employ Dupire local volatility formulations and Gatheral stochastic volatility inspired (SVI) parameterizations. These mathematical specifications ensure that option prices prevent calendar and butterfly arbitrage violations across the entire strike domain.
Because deep out-of-the-money put options command pronounced volatility skew premiums—reflecting steep downside kurtosis—the VIX calculation captures both the level of forward variance and the asymmetry of return distributions. A steepening put skew directly inflates the front-month VIX futures price, even when at-the-money implied volatility remains subdued. When calibrating term structure pricing models, quants observe that forward skews flatten as time to expiration lengthens from 30 days to 180 days, generating predictable curve curvature dynamics that institutional volatility desks trade systematically.
Delta-Neutral Volatility Arbitrage: Systematic Calendar Spreads and Dispersion Strategies
Institutional quantitative desks exploit the structural shape of the VIX term structure using two primary execution architectures: term structure calendar spreads and equity index dispersion trades.
VIX Futures Calendar Spreads
In steep contango environments, quants sell the front-month M1 future and buy the second-month M2 or third-month M3 contract.
The strategy harvests the faster decay of M1 while maintaining a partial hedge against curve-wide volatility spikes, dynamically rebalancing beta exposure to the underlying S&P 500 index.
Correlation & Dispersion Arbitrage
Index volatility is mathematically bounded by the correlation of its component constituents: σ_index² = ∑ w_i² σ_i² + 2 ∑ w_i w_j σ_i σ_j ρ_ij.
Desks short expensive index implied volatility (via VIX futures or SPX options) and buy cheaper implied volatility on individual equities, capturing implied-versus-realized correlation spreads.
These strategies require active risk monitoring. Similar systematic execution protocols are examined in our research on prediction market arbitrage, where traders continuously calibrate execution latency against clearinghouse margin requirements.
Exchange-Traded Volatility Products (ETPs): Rebalancing Flows and End-of-Day Convexity Traps
The retail and institutional adoption of exchange-traded products (ETPs) linked to VIX futures—such as long volatility products (VXX, UVXY) and inverse volatility vehicles (SVXY, XIV)—fundamentally altered the intraday market microstructure of volatility futures.
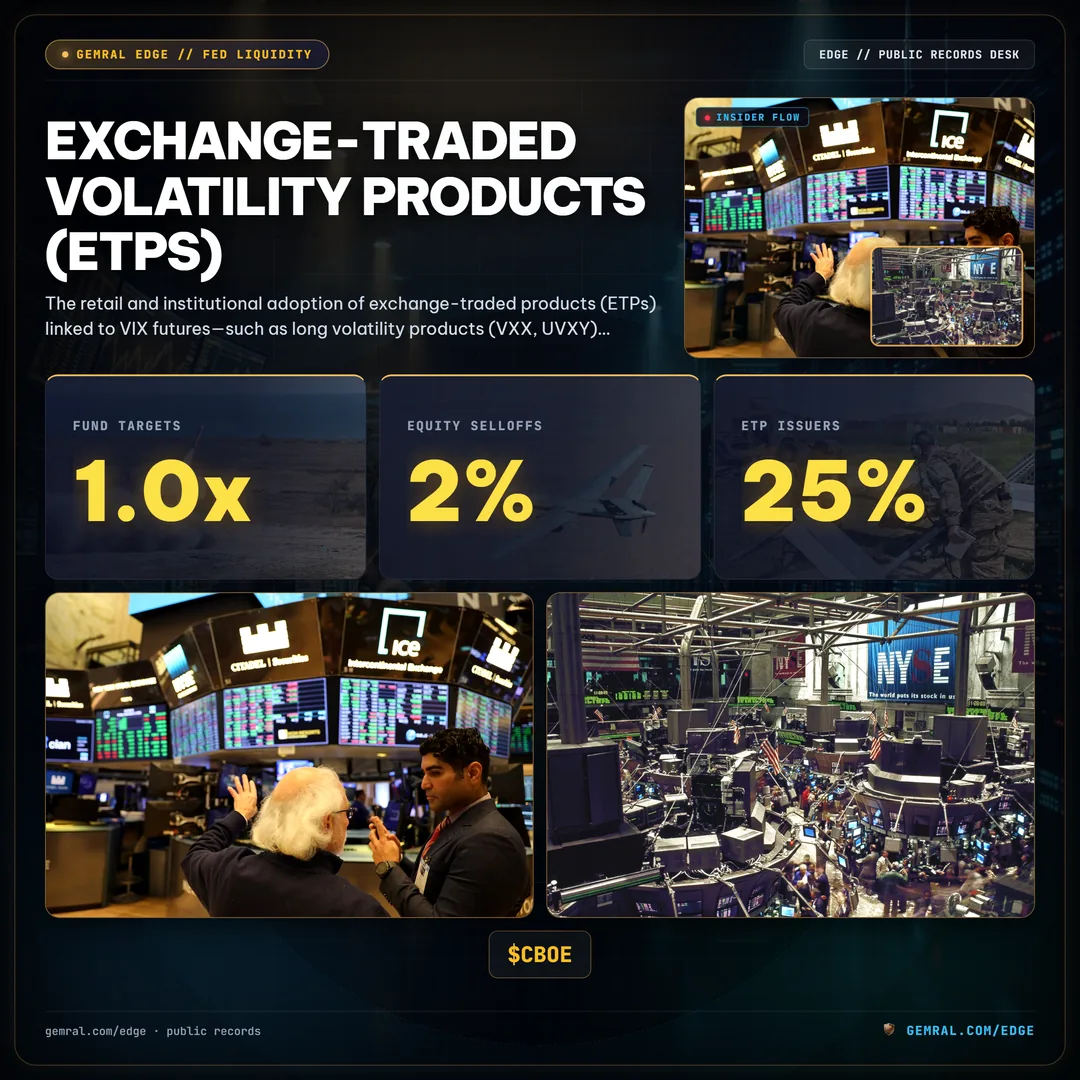
To maintain a target duration (such as a constant 30-day maturity or a -0.5x inverse daily return), volatility ETP issuers must execute mathematical rebalancing formulas at the market close every trading day. This creates severe structural feedback loops:
- Procyclical Rebalancing Flow: An inverse volatility fund that targets a -1.0x daily return must purchase VIX futures when the VIX rises to reduce short exposure, and sell VIX futures when the VIX falls to increase short exposure.
- End-of-Day Liquidity Squeeze: On days characterized by equity selloffs exceeding 2%, the required rebalancing purchase of VIX futures by ETP issuers can exceed 25% to 50% of total daily trading volume across the M1 and M2 contracts.
- Convexity Acceleration: As issuers flood the market with market-on-close orders to cover short positions, their buying pressure forces VIX futures higher, triggering additional margin calls across proprietary trading desks and exacerbating curve backwardation.
Quantitative volatility managers track aggregate ETP shares outstanding, assets under management (AUM), and estimated trade-at-settlement (TAS) order imbalances to forecast closing volatility price jumps.
Historical Regime Teardowns: Comparing the 2018 Volmageddon, 2020 Liquidity Crunch, and August 2024 Unwinds
Empirical teardowns of structural volatility crises reveal the catastrophic mechanics of curve inversions and balance-sheet dislocations:

| Event Date | Peak Spot VIX | Curve Inversion Magnitude | Primary Structural Catalyst |
|---|---|---|---|
| February 5, 2018 (Volmageddon) | 50.30 | M1-M2 inverted by +9.2 points | XIV/SVXY inverse ETP end-of-day rebalancing termination shock |
| March 16, 2020 (Pandemic Crash) | 82.69 | M1-M2 inverted by +14.8 points | Global economic shutdown, Treasury illiquidity, dash for cash |
| August 5, 2024 (Yen Carry Unwind) | 65.73 | M1-M2 inverted by +11.4 points | Bank of Japan rate hike, Nikkei liquidation, US recession fears |
During the February 5, 2018 'Volmageddon' event, the front-month VIX future doubled in value during the final hour of trading, surging from 16 to over 33. The inverse product XIV breached its contractual 80% loss acceleration covenant, triggering complete liquidation and vaporizing over $3B of retail and hedge fund equity overnight.
Similarly, on August 5, 2024, the sudden unwinding of global Japanese Yen carry trades triggered an unprecedented intraday spike in spot VIX to 65.73, causing extreme backwardation before settling lower as institutional liquidity providers stepped in. Analogous energy infrastructure dynamics are analyzed in our operational study on nuclear smr stocks, where public contract execution milestones similarly dictate sudden capital reallocation cycles.
A forensic examination of the March 2020 liquidity dislocation demonstrates the extreme speed with which contango structures disintegrate. On February 19, 2020, spot VIX closed at 14.38 with the M1 future trading at 15.65 (a normal 1.27-point contango). By March 16, 2020, as global financial markets absorbed nationwide lockdown announcements, spot VIX touched an intraday high of 82.69 while M1 spiked to 68.50 and M2 reached 54.00, resulting in a historic 14.50-point backwardation inversion.
During this 18-day collapse, market makers in S&P 500 options experienced severe delta-hedging feedback loops. As the underlying index fell by more than 30%, market makers who were structurally short out-of-the-money puts were forced to aggressively sell S&P 500 futures contracts into falling bids to maintain delta-neutral positions. This mechanical dynamic, coupled with basis trade liquidations and off-the-run Treasury selloffs, drained liquidity across options exchanges and caused bid-ask spreads on front-month VIX futures to widen from 0.05 points to over 2.50 points.
Institutional Risk Architecture: Margin Shocks, Clearinghouse Haircuts, and Value-at-Risk Thresholds
Trading the VIX term structure requires an institutional risk architecture capable of withstanding extreme volatility explosions. When the curve transitions into backwardation, clearinghouses and prime brokers dynamically adjust margin requirements to protect clearing integrity:

- SPAN Margin Escalation: The Options Clearing Corporation (OCC) and CBOE Futures Exchange (CFE) employ Standard Portfolio Analysis of Risk (SPAN) margin systems. Baseline initial margin requirements for a single VIX futures contract, typically set at $6000 to $8000 during calm regimes, can escalate above $25,000 within 24 hours during market crises.
- Intraday Variation Margin Calls: Clearing firms enforce intraday variation margin sweeps. A short volatility fund holding 1000 front-month contracts experiences a cash deduction of $100,000 for every single 0.10 point increase in the VIX futures price.
- Prime Brokerage Haircuts: In periods of backwardation, prime brokers widen repo financing haircuts and reduce leverage multipliers on collateralized volatility portfolios, forcing leveraged funds into forced liquidation at the worst possible market prices.
Institutional quant funds survive volatility spikes by enforcing strict gross notional leverage caps (rarely exceeding 1.5x to 2.0x capital), maintaining dedicated long out-of-the-money VIX call options as catastrophe stop-losses, and stress-testing portfolios against extreme tail events exceeding 10 standard deviations.
Beyond standard exchange margin frameworks, quantitative macro desks implement continuous tail-risk stress testing using Expected Shortfall (CVaR) models parameterized at the 99% confidence level over a 10-day liquidity horizon. Rather than assuming Gaussian return distributions, institutional risk protocols model volatility returns using heavy-tailed Pareto distributions. When portfolio conditional loss estimates exceed predetermined capital thresholds, risk engines trigger automated de-grossing protocols, liquidating short calendar spread legs and executing protective index collar overlays to halt drawdown contagion.
Furthermore, multi-strategy hedge funds subject volatility books to liquidity-adjusted Value-at-Risk (L-VaR) constraints. Under an L-VaR framework, capital allocations must account for the liquidation horizon required to unwind large futures positions without exceeding 15% of average daily trading volume. During calm contango regimes, a desk might safely manage 5000 front-month VIX contracts; however, as market depth contracts ahead of major economic announcements, allowable position sizes automatically scale down to 1500 contracts, preventing balance-sheet lockups during sudden curve inversions.
Alternative Telemetry and Portfolio Construction: Integrating Cross-Asset Volatility Signals
In modern multi-asset quantitative trading, monitoring the VIX term structure extends beyond equity derivatives desks. The slope and curvature of the forward volatility curve serve as a foundational cross-asset liquidity barometer.
Institutional allocators construct holistic risk telemetry by linking VIX futures metrics with broader financial system indicators:
- Credit Spread Divergences: Tracking the spread between high-yield credit default swaps (CDX HY) and VIX curve contango to detect early institutional deleveraging.
- Fixed-Income Volatility Interaction: Comparing the ICE BofA MOVE index (Treasury bond volatility) against the VIX to measure interest rate uncertainty spillover into equity risk premia.
- Commodity & Currency Volatility: Evaluating OVX (crude oil volatility) and FX implied volatilities alongside VIX backwardation to identify structural global macro shocks.
- Point-in-Time Regulatory Filings: When analyzing hedge fund holdings in public filings, quantitative desks separate period_of_report dates from filing_date disclosures to eliminate look-ahead bias and verify true historical positioning.
By integrating point-in-time derivatives telemetry with fundamental balance-sheet analysis, institutional allocators navigate shifting volatility regimes while insulating their portfolios from systemic market dislocations.
Explore Point-in-Time Institutional Derivatives Telemetry
Access point-in-time datasets tracking derivatives term structures, cross-asset volatility spreads, corporate disclosures, and physical macro infrastructure metrics across 57 US-listed entities.
Frequently asked questions
What is the VIX term structure and why does it matter?
The VIX term structure is the curve plotting prices of CBOE VIX futures contracts across consecutive delivery months. It provides critical insight into forward equity market stress, hedging costs, and systemic risk pricing across institutional options markets.
What is the difference between VIX contango and backwardation?
Contango occurs when longer-dated VIX futures trade higher than front-month contracts, reflecting the cost of future uncertainty and generating negative roll yield for long positions. Backwardation occurs during acute market distress when near-term VIX futures spike significantly above longer-dated contracts.
Why does the Variance Risk Premium (VRP) persist over time?
The Variance Risk Premium persists because institutional asset managers are willing to systematically overpay for out-of-the-money index put options as catastrophe insurance, creating an average spread of 2 to 4 volatility points between implied and realized volatility.
How do short-volatility and leveraged ETPs impact market stability?
Daily rebalancing mechanisms in volatility exchange-traded products force issuers to buy VIX futures when volatility rises and sell when it falls. During sharp market drops, this end-of-day rebalancing induces positive feedback loops that can trigger rapid liquidity evaporation, as seen during February 2018.