What Is Dark Pool Volume? 44 Sessions of Daily Short Sale Volume Across 7,052 Stocks
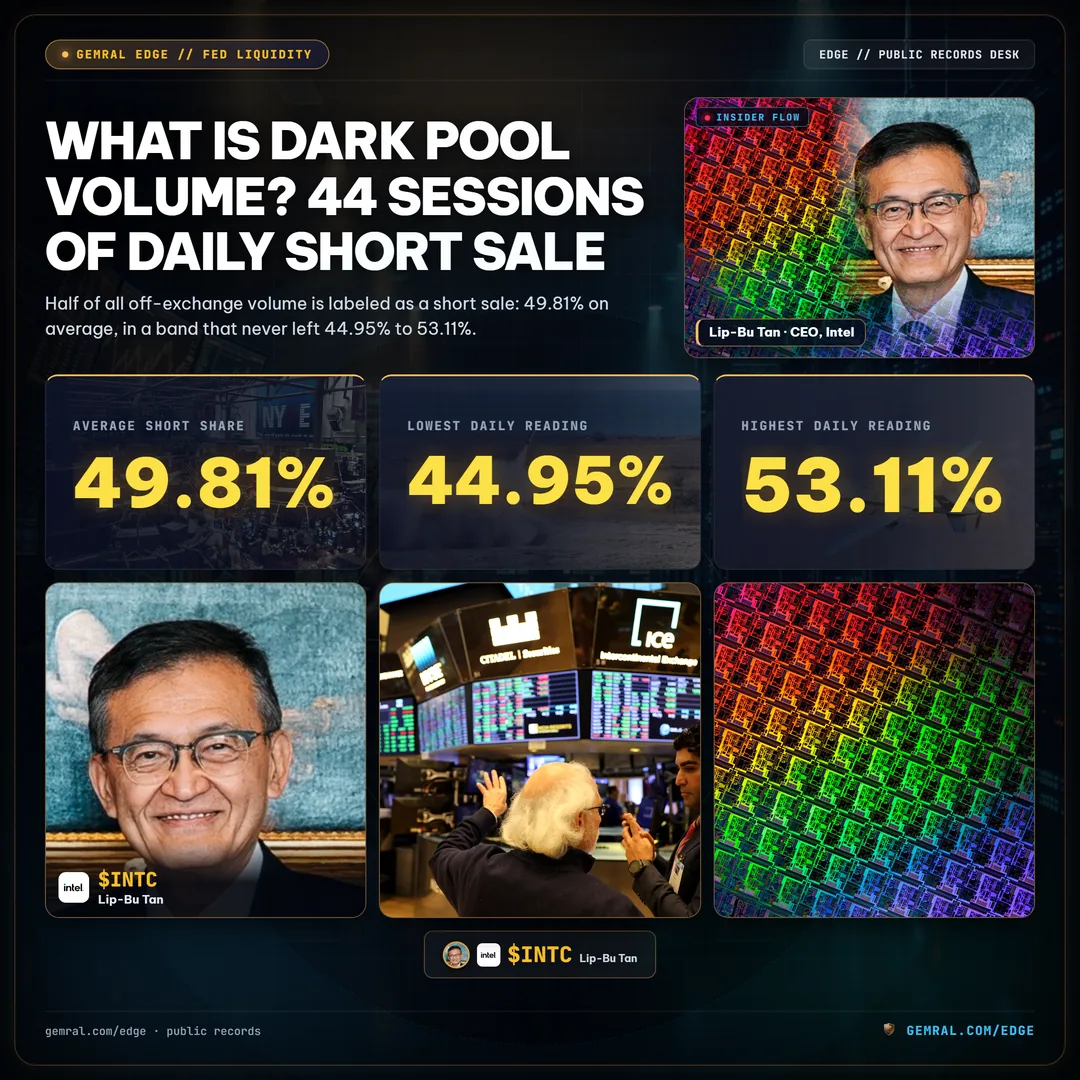
Half of all off-exchange volume is labeled as a short sale: 49.81% on average, in a band that never left 44.95% to 53.11%. One ticker-day in five clears 65%, 814 of them every session, and the stocks that look loudest are the ones that barely trade.
What dark pool volume actually means, and what the daily file contains
Dark pool volume is the number of shares that traded away from the public exchanges, in venues that do not display orders before they execute. The trades are reported afterward, in aggregate, to a regulator-run reporting facility. The daily files built from those reports are the only public view of that activity, and they are far narrower than the phrase suggests. For each stock and each session they carry three numbers: the shares reported off-exchange, the share of those marked as short sales, and the session date.
The first thing to separate is the word short. A sale is marked short when the seller does not own the shares at the moment of the sale. That category includes the obvious bearish bet. It also includes a market maker who sells inventory it is about to replenish, a hedge that offsets a position somewhere else, and an arbitrage leg. The file does not say which one it was. A reading of 50% means half of the reported shares were sold short in the regulatory sense. It does not mean half the market is betting against the stock, and it is not short interest, which counts positions that stay open from one day to the next.
The second thing to separate is the denominator. The ratio in this report is short-marked shares divided by all shares reported through the off-exchange facilities that session. It is not a share of the whole consolidated tape. A stock can trade 40 million shares on the exchanges and report 2 million off-exchange; the ratio describes only those 2 million.
This report measures the file directly. The sample is 283,291 ticker-days across 7,052 symbols and 44 sessions, from September 11 to November 11, 2026, drawn from U.S. market-regulator public trading statistics. The direct answer to the question in the title is below, and the rest of the report tests how much weight a single reading can carry.
Direct answer: dark pool volume is the off-exchange portion of trading, reported after the fact. In the daily regulator file, about half of it, 49.81% on average across these 44 sessions, is labeled as short sales, and that figure says far less about direction than it appears to.
The 49.81% baseline: 44 sessions and 283,291 ticker-days
Across the full sample the volume-weighted short share averaged 49.81% per session. The average of each session's median stock was 49.95%, and the median stock-day across the whole sample was exactly 50.0%. Three different ways of finding the center land within 0.19 percentage points of each other, which means the center of the distribution is not being dragged by a few giant prints.
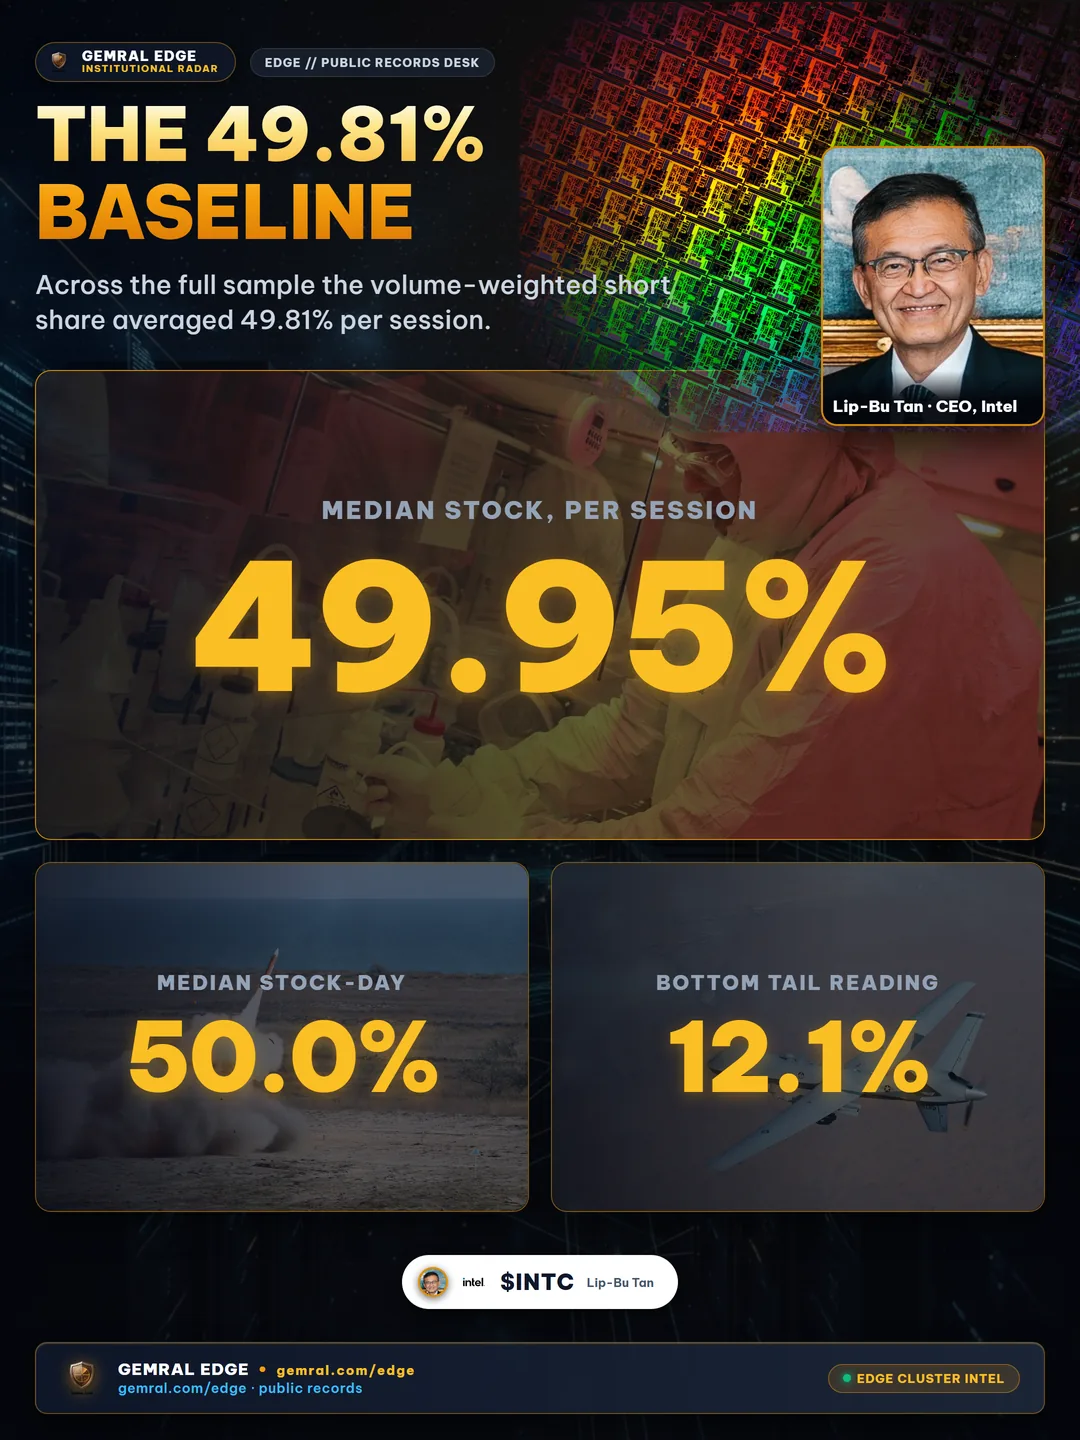
The spread around that center is wide. The 5th percentile of all ticker-days was 12.1%, the 25th was 36.2%, the 75th was 62.2% and the 95th was 80.1%. A stock-day at 36% and one at 62% sit 26 points apart and both land inside the middle half of the sample. Put differently, the interquartile range of a single reading is wider than the whole range of the market-wide aggregate, which never left 44.95% to 53.11%. The aggregate is calm because thousands of noisy readings cancel; the individual readings are not calm at all.
Half of all ticker-days, 50.25%, printed at or above 50%. 17.3% printed below 30%. 20.3% printed at 65% or higher. Those three numbers frame everything that follows. Before treating any stock's ratio as a signal, the first comparison to make is against this distribution, because a reading that feels extreme usually sits inside it.
A band that barely moved: 44.95% to 53.11% in two months
The market-wide short share was low on November 4, 2026 at 44.95% and high on September 18, 2026 at 53.11%. The gap between the two is 8.16 percentage points, and the standard deviation of the 44 daily readings is only 1.97 points. The average absolute change from one session to the next was 1.24 points. The largest single-session move was 3.98 points, from 53.11% on September 18 to 49.13% on September 21.
For a number built from roughly 6,300 stocks and 5.67 billion reported shares per session on average, that stability is the first thing to register. A move of 4 points in the aggregate is the largest the sample contains. A reading that shifts by one point is normal noise, and nothing in this record suggests that a one-point move in the aggregate carries information on its own.
The daily detail for the last twelve sessions shows the range in practice. October 27 printed 48.10%, October 28 printed 49.07%, October 29 printed 47.93%, October 30 printed 46.83%, November 2 printed 46.62%, and November 3 printed 48.35%. Then came the low: November 4 at 44.95%. After it the series recovered to 45.16% on November 5, 46.67% on November 6, 46.53% on November 9, 48.55% on November 10 and 48.04% on November 11. A reader who saw only November 4 would see a two-month low. A reader who saw the 44-session band would see a reading 4.86 points below the average in a series whose standard deviation is 1.97, roughly two and a half deviations, followed by a normal climb back.
One ticker-day in five clears 65%, and 814 do it every session
A common screening rule flags a surge when a stock's short share reaches 65% on at least 50,000 reported shares. The threshold sounds rare. The measured frequency says otherwise. Of 182,498 ticker-days with at least 50,000 reported shares, 35,828 printed at 65% or higher, which is 19.63%. Across 44 sessions that is an average of 814.3 stock-days per session, from 4,071 distinct symbols.

Put another way, a 65% reading is a one-in-five event. On a typical session more than eight hundred stocks clear it, and over two months 4,071 symbols cleared it at least once on meaningful volume. Of the 1,924 stocks that averaged at least 500,000 reported shares per session and appeared on at least 40 sessions, 1,483 printed at least one 65% day. Only 20 of them printed one on 30 or more of the 44 sessions.
That last pair of numbers is the important one. Printing 65% once is close to the default behavior of an active stock: 1,483 of 1,924, or 77%. Printing it on most sessions is rare: 20 of 1,924, or about 1%. The one-day spike is common and carries little information. The persistent reading is uncommon, and it is the only version of the signal that survives a basic frequency check.
A threshold that fires 814 times a day is a filter, not an alarm. Used as an alarm it will ring constantly, and the stocks that cause the ring will be mostly the same ones as the day before, as the persistence section below shows.
Why the loudest readings come from stocks that barely trade
The sample splits cleanly by how many shares were reported. The extremes live at the bottom, where a handful of shares can produce any ratio at all.

| Reported shares per ticker-day | Share of rows | Share of volume | Average ratio | Spread (std dev) | At 65%+ | At 90%+ |
|---|---|---|---|---|---|---|
| Under 10,000 | 18.4% | 0.1% | 44.2% | 29.1 pts | 24.4% | 10.0% |
| 10,000 to 50,000 | 17.2% | 0.5% | 45.5% | 20.6 pts | 18.4% | 1.0% |
| 50,000 to 500,000 | 38.7% | 8.9% | 51.6% | 17.2 pts | 22.8% | 0.3% |
| 500,000 to 5 million | 22.7% | 36.9% | 50.3% | 14.8 pts | 15.8% | 0.1% |
| Over 5 million | 3.0% | 53.6% | 48.3% | 12.6 pts | 7.6% | 0.1% |
Below 10,000 reported shares, 10.0% of ticker-days printed at 90% or higher, and 5.42% printed at exactly 100%, which means every reported share was marked short. In the 10,000 to 50,000 bucket the 90% frequency drops to 1.0%, and above 50,000 it sits at 0.3% or lower. The spread of readings shrinks steadily with size: 29.1 points of standard deviation under 10,000 shares, 12.6 points above 5 million.
The size buckets also differ in how much of the market they represent. The two smallest buckets are 35.6% of all ticker-days and only 0.6% of all reported shares. The largest bucket is 3.0% of ticker-days and 53.6% of reported shares. A screen that ranks stocks by short share without a volume floor will fill its top of page with symbols from the two smallest buckets, because that is where a 100% reading is cheap to produce.
This is why a surge rule like the one above sets a floor of 50,000 shares, and why the floor matters. It does not remove the noise. The 50,000 to 500,000 bucket still printed 65% or higher on 22.8% of its rows, the highest frequency of any bucket outside the smallest. It does remove the exact-100% prints that make a raw ranking look large and mean almost nothing.
Where the volume sits: 3% of the rows carry 53.6% of the shares
Concentration is the second structural feature. Ticker-days with more than 5 million reported shares are 3.0% of the rows and 53.6% of the volume. On the most recent session in the sample, November 11, 2026, the ten busiest stocks accounted for 19.8% of all reported shares, and the top 100 accounted for 47.4%.

Those busiest names did not carry a different ratio from everyone else. On November 11 the 100 busiest stocks printed a combined 47.81% and the rest of the market printed 48.25%, a gap of 0.44 points. Averaged over all 44 sessions the same comparison is nearly identical to the second decimal: 49.81% for the 100 busiest stocks each day and 49.82% for the rest. The hundred names that dominate the volume and the six thousand that split the remainder behave the same in aggregate.
That has a practical consequence for anyone reading the market-wide number. The market-wide short share is, to a close approximation, the short share of the 100 busiest names. It does not summarize the many small names separately, and it should not be read as a sentiment gauge for the broad universe. It is a volume-weighted average dominated by a short list.
The top of the list is lumpy. On November 11 the single busiest symbol reported 434.3 million shares, far ahead of the second at 160.1 million, and its short share that day was 43.6%. That one symbol was 7.2% of the session's reported shares on its own. Any report that quotes the aggregate should say which session and which names drove it.
The ratio that sticks: 0.58 correlation and 41.3% top-decile memory
If the daily reading were pure noise, a stock's ratio today would say nothing about its ratio tomorrow. It does say something. Taking the 1,924 stocks that averaged at least 500,000 reported shares per session and appeared on at least 40 sessions, the correlation between a stock's average ratio over the first 22 sessions and its average over the last 22 was 0.58.
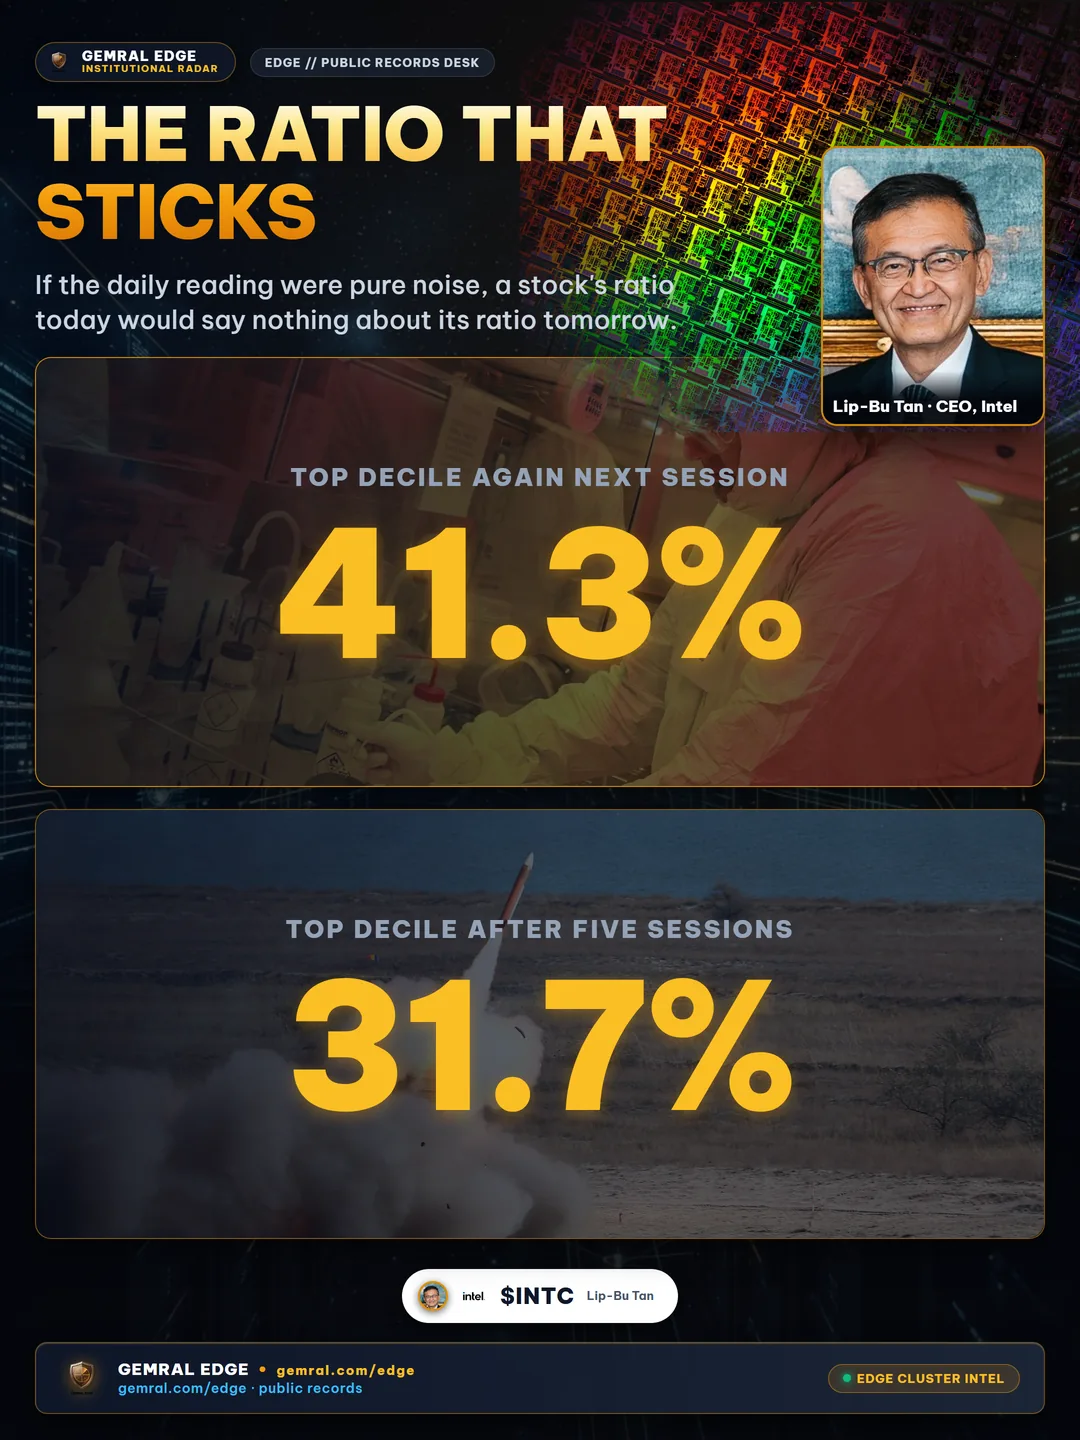
Day to day the memory is also visible. Among stocks with at least 50,000 reported shares, the rank correlation between one session's ratios and the next session's averaged 0.60. A stock in the top decile of ratios on one session was still in the top decile on the following session 41.3% of the time, against the 10% that chance would predict. Five sessions later it was still there 31.7% of the time, three times the chance rate.
The persistence points to structure, not to a daily decision. Some stocks are traded through off-exchange venues in ways that mark more of the volume as short, for reasons tied to who makes the market in them and how that market is hedged. The file does not tell you which reason applies. It tells you that the number is partly a property of the stock, and that part is stable.
Across the 1,924 liquid stocks, the 44-session ratio ranged from 18.7% to 74.7%, with a standard deviation of 8.8 points. 243 stocks sat at 60% or higher, and 249 sat at 40% or lower. The two groups are about the same size and sit 20 points or more apart on a measure that, across the whole market, averages 49.81%.
The consequence for interpretation is direct. A stock that prints 65% every session is not announcing anything new when it prints 65% today. The informative question is whether a stock moved away from its own baseline, which this sample only supports at a coarse level, not whether it crossed a fixed line.
Reading a single ticker: NVDA at 38.7% and SPY at 55.1%
Four large symbols show how different the baselines are. Over the 44 sessions, the simple average of the daily short share was 38.7% for NVDA, 51.5% for TSLA, 51.5% for AAPL and 55.1% for SPY. The ranges were wide as well: NVDA ran from 22.9% to 57.4%, TSLA from 39.5% to 62.6%, AAPL from 40.1% to 62.7%, and SPY from 41.9% to 76.2%.

On November 11 NVDA reported 114.4 million shares at 34.1%, and Intel reported 59.5 million at 33.7%. The same session's aggregate was 48.04%. A reading of 34% on NVDA is therefore 4.6 points below its own 44-session average and is also 14 points below the market. The first comparison is the useful one. The second would be a comparison between two different baselines.
SPY is the cautionary case. An exchange-traded fund can have creation and redemption activity and market-making hedges that do not exist in an operating company's stock, and its readings reach 76.2% in the sample. Without knowing which mechanism produced a given print, calling that number bearish is a guess. The same print on a company with no such hedging machinery would mean something else.
The practical habit is simple: before reading any single ticker's number, retrieve that ticker's own 44-session range. A reading inside the range is routine. A reading outside it is the first one worth a second look, and even then the file cannot say whether the seller was a hedger or a bear.
The calendar and the tide: Friday at 50.48%, Thursday at 49.13%, and a 46.86% November
The weekday pattern is small. Across the 44 sessions, Monday averaged 49.53% (9 sessions), Tuesday 49.71% (9), Wednesday 50.15% (9), Thursday 49.13% (8) and Friday 50.48% (9). The spread between the lowest day and the highest is 1.35 points, which is less than the 1.97-point standard deviation of the series itself. With 8 or 9 sessions per weekday, that difference is not strong evidence of a calendar effect.
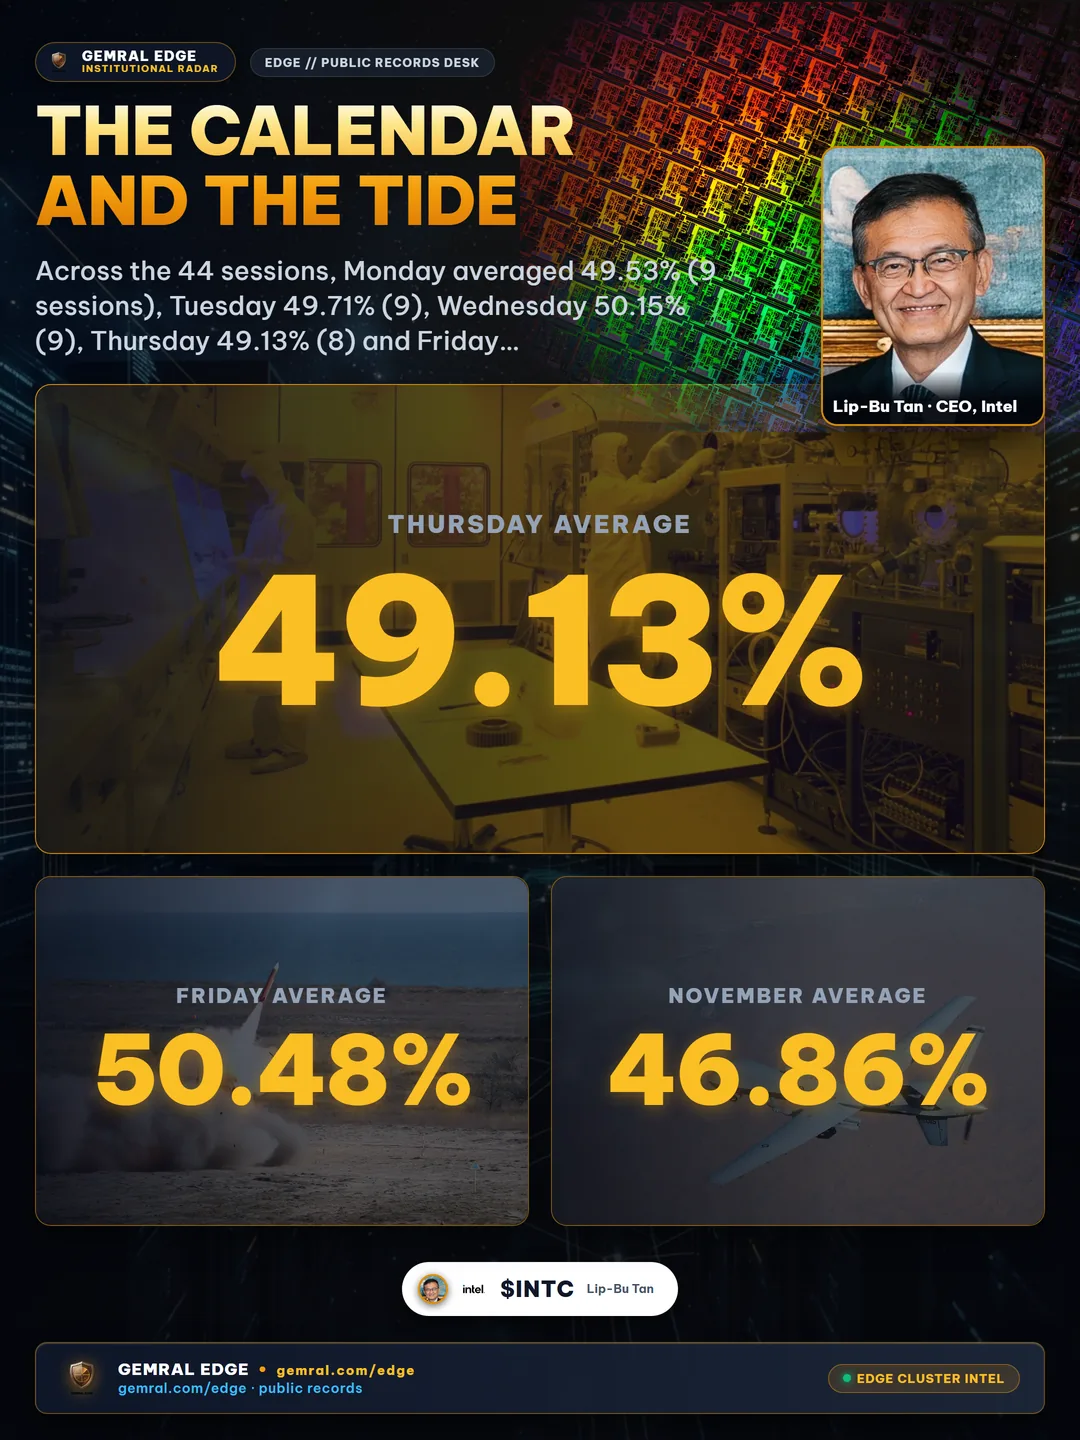
The month-by-month drift is larger. September, with 14 sessions in the sample, averaged 50.93%. October, with 22 sessions, averaged 50.18%. November, with 8 sessions through the 11th, averaged 46.86%. The average of the first ten sessions was 50.9% and the average of the last ten was 46.96%, a drop of 3.94 points inside a series that otherwise rarely moves more than 1 point from one day to the next.
The drop lines up with volume. Reported off-exchange shares averaged 5.67 billion per session. The busiest session was November 5, 2026 at 8.19 billion, and the ratio that day was 45.16%, the second lowest reading in the sample. The quietest session was October 12, 2026 at 4.41 billion, and the ratio was 51.05%. Across all 44 sessions, the correlation between a session's total reported shares and its short share was -0.56.
A correlation of -0.56 on 44 points is a moderate relationship, not a law. It does say that heavy-volume sessions in this window tended to carry a lower short share, which fits a picture in which additional volume came disproportionately from sources that mark fewer sales as short. The file does not identify those sources, and two months is a short sample. The more cautious reading is that the aggregate ratio moves with the volume regime, so a low reading on a high-volume day is not the same event as a low reading on a quiet day.
When the data becomes available: the point-in-time question
Anyone using these figures in a research process has to keep two dates apart. The trade date is the session the volume happened on. The publication date is when the regulator posts the file, which is after the close, not during the session. A model that reads the November 11 ratio at the November 11 open is using information that did not exist until that evening.
The record behind this report stamps each row with its trade date and with the time it was ingested. In this sample the November 11 rows were ingested at 22:18 UTC on November 11, which is 5:18 in the afternoon in New York. A researcher reconstructing what was knowable at a given moment can reject any row whose ingest time falls after that moment.
There is a second boundary. The sample starts on September 11, 2026, so every statement here covers 44 sessions, not a decade. A ticker's 44-session baseline is measured inside one market regime and may not hold in a different one. The persistence figures in particular describe this window and should be re-measured on a longer record before anyone leans on them.
A third caution concerns what a stock-level reading is allowed to imply. The ratio is observed after the fact and is stable at the stock level, which makes it a descriptive feature of how a stock trades. It is not, in this report, tested against any later price move, and nothing here should be read as saying it predicts one.
What the record cannot tell you
The file cannot identify who sold. It cannot separate a market maker's inventory sale from a directional short, and it cannot separate a hedge from an outright bet. The share marked short is a regulatory label on a transaction, not a measure of conviction.
It also cannot see trades on the exchanges. The denominator is off-exchange volume only, so a stock whose volume is mostly on the exchanges is represented by a thin slice of its trading, and a ratio built on a thin slice is noisy for the reasons shown in the size table above. The 35.6% of ticker-days under 50,000 reported shares are the clearest case.
The sample covers 44 sessions. The weekday pattern rests on 8 or 9 observations per weekday. The persistence and baseline figures rest on one window. The correlation with volume rests on 44 points. Each of these is a descriptive finding that would need a longer sample before it could be treated as a stable property of the market.
The file does not measure short interest, borrow cost, or days to cover. A stock can show a 70% daily ratio and have almost no open short position, and the reverse is just as possible. Anyone who needs the open position has to look at a different dataset, published on a different schedule.
Finally, none of the 44 sessions is evidence about what a stock did afterward. This report measures the shape of the signal, including how often it fires and how much it varies, so that a reader can judge how much weight a single number can carry. On that question the measured answer is: very little for a single day, and more for a stock's own sustained baseline.
How the numbers were built
Source: U.S. market-regulator public trading statistics, daily short sale volume files, covering 7,052 symbols and 44 trading sessions from September 11, 2026 to November 11, 2026, 283,291 ticker-days with nonzero reported volume. Ratio = shares marked short divided by total shares reported off-exchange, computed per ticker-day and, for the aggregate, as the sum of short shares divided by the sum of reported shares across all symbols in that session.
The volume-weighted aggregate is the 49.81% figure. The average of the 44 session medians is 49.95%. Size buckets use the ticker-day's total reported shares. The surge count uses ticker-days with at least 50,000 reported shares and a ratio of 65% or higher. Persistence compares each stock with at least 50,000 reported shares in the 90th percentile of its session with the same stock's status on the next session and five sessions later, requiring the stock to appear on both days. The half-sample correlation uses the 1,924 symbols with at least 40 sessions and an average of at least 500,000 reported shares per session, comparing the volume-weighted ratio over sessions 1 to 22 with sessions 23 to 44.
Weekday and month averages are simple means of the 44 daily aggregate readings. Every statistic was computed from the stored daily rows as of November 12, 2026. No reading was estimated, smoothed or filled, and symbols without nonzero reported volume on a session were excluded from that session.
Where to look next
For a stock-level view of off-exchange and options positioning, the options and dark pool screener lists each ticker's own recent readings, so a number can be compared with its baseline instead of with a fixed line. For the dealer-hedging side of the same market structure, read dealer gamma exposure and market maker hedging. For the timing discipline behind the point-in-time section, read look-ahead bias and point-in-time data. Funds that need the underlying rows with ingest timestamps can request the institutional data preview.
Public data · not investment advice. Gemral Edge story: gemral.com/edge/s/what-is-dark-pool-volume.
Frequently asked questions
Is dark pool short volume the same as short interest?
No. Short sale volume counts shares marked short in one day's off-exchange trades, including market-maker inventory sales and hedges. Short interest counts positions that stay open from one day to the next. A stock can print a 70% daily short share with almost no open short position.
What does a high dark pool short volume ratio mean?
Less than it appears to. Across 44 sessions one ticker-day in five, 20.3%, printed at 65% or higher, and 814 stocks per session cleared that level on at least 50,000 shares. The ratio is also sticky: a stock in the top decile one session stayed there the next session 41.3% of the time, so a high reading is often just that stock's normal level.
Which stocks show the most extreme dark pool ratios?
The smallest prints. Below 10,000 reported shares, 10.0% of ticker-days printed at 90% or higher and 5.42% printed at exactly 100%. Above 5 million reported shares, only 0.1% printed at 90% or higher. Extreme readings come mostly from stocks that barely trade.