Yield Curve Inversion: What the 10-Year Minus 2-Year Spread Has Signaled Before Past Recessions
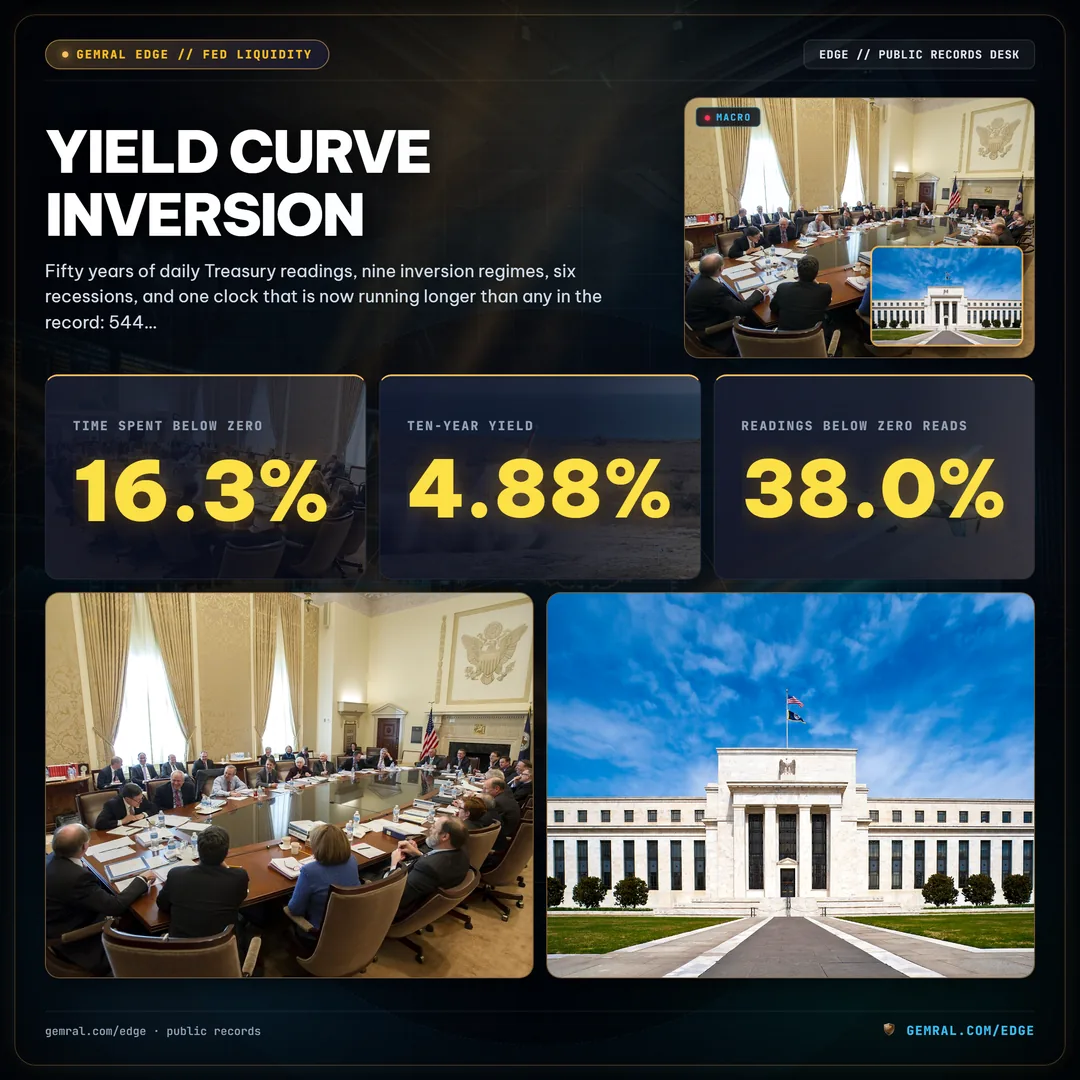
Fifty years of daily Treasury readings, nine inversion regimes, six recessions, and one clock that is now running longer than any in the record: 544 straight sessions with the curve positive and no recession flag.
What the 10-year minus 2-year spread actually measures
The U.S. Treasury sells debt at every maturity from one month to thirty years. Each maturity carries its own yield, and the yield curve is the line that connects them. The 10-year minus 2-year spread takes two points on that line and subtracts: the yield on the 10-year note minus the yield on the 2-year note, quoted in percentage points.
In a normal market the number is positive. Lenders who commit money for ten years ask for more than lenders who commit for two. Inversion is the reverse: the 2-year yield sits above the 10-year yield, and the spread prints below zero. The bond market is saying that short-term money costs more than long-term money, which only happens when investors expect short-term rates to fall later.
The series has one property that makes it useful for a long record. The Federal Reserve publishes it daily on a constant-maturity basis, which means the 10-year and 2-year yields are interpolated to fixed maturities rather than tied to whichever bond was issued last. The daily reading goes back to June 1, 1976, and the last reading used in this report is November 10, 2026. That is 12,608 daily observations across fifty years and five months.
Everything below comes from that one series, the recession indicator that the Federal Reserve Bank of St. Louis publishes from the National Bureau of Economic Research business cycle dates, and the 10-year minus 3-month spread for comparison. Nothing is modeled. Every count is a count of daily readings.
12,608 readings, 2,049 below zero
Start with the base rate, because every inversion headline hides it. Across the 12,608 daily readings between June 1976 and November 2026, the spread printed below zero on 2,049 days. That is 16.3% of the record. For roughly one trading day in six, the curve between two and ten years has been upside down.

The reading is not evenly distributed. It arrives in blocks. The 2,049 inverted days sit inside nine distinct regimes, and the longest of those blocks ran 541 days. That is why counting headlines about "the curve inverting" tells you almost nothing about how long or how deep the condition lasted.
Restrict the window to 1982 onward, where both the 10-year minus 2-year and the 10-year minus 3-month series are available, and the comparison tightens. The 10-year minus 2-year spread was below zero on 1,344 of 11,217 readings, or 12.0%. The 10-year minus 3-month spread was below zero on 1,229 of the same 11,217 readings, or 11.0%. Two curves, one shape, and a gap of roughly one percentage point in how often each one inverts.
Nine inversion regimes since 1976
Here is every regime in the record. A regime is a run of negative daily readings, with runs separated by sixty days or fewer merged into one. "Months to recession" counts from the first inverted reading to the first month the St. Louis Fed recession indicator flagged a recession that had not yet started when the curve first inverted.
| Regime | First inverted | Last inverted | Inverted days | Trough (pp) | First recession month | Months from first inversion |
|---|---|---|---|---|---|---|
| 1978–80 | Aug 18, 1978 | May 1, 1980 | 423 | −2.41 | Feb 1980 | 17.5 |
| 1980–82 | Sep 12, 1980 | Jul 16, 1982 | 400 | −1.70 | Aug 1981 | 10.6 |
| 1988–89 | Dec 13, 1988 | Nov 6, 1989 | 174 | −0.45 | Aug 1990 | 19.6 |
| Mar 1990 | Mar 8, 1990 | Mar 29, 1990 | 16 | −0.14 | Aug 1990 | 4.8 |
| 1998 | May 26, 1998 | Jul 27, 1998 | 27 | −0.07 | Apr 2001 | 34.2 |
| 2000 | Feb 2, 2000 | Dec 28, 2000 | 227 | −0.52 | Apr 2001 | 13.9 |
| 2005–07 | Dec 27, 2005 | Jun 5, 2007 | 238 | −0.19 | Jan 2008 | 24.1 |
| 2019 | Aug 27, 2019 | Aug 29, 2019 | 3 | −0.04 | Mar 2020 | 6.1 |
| 2022–24 | Apr 1, 2022 | Sep 5, 2024 | 541 | −1.08 | None flagged | — |
Add the inverted-days column and it returns 2,049, the same total as the base rate. The table is the whole record, not a selection from it.
Two rows deserve a second look. The March 1990 dip and the 1988–89 regime belong to the same cycle, so they count once when measuring how long the signal took. The 1998 row is the false start: 27 inverted days, a trough of only −0.07 percentage points, and a recession that did not arrive for another 34.2 months. The 2000 regime, which did lead into the 2001 recession, started 13.9 months before it.
The longest inversion in the record: 541 days
The 2022–24 regime holds one record outright. It ran 541 inverted days, between April 1, 2022 and September 5, 2024. The longest regime before it, 1978–80, lasted 423 inverted days. The latest one ran 118 days longer, which is 28% more time upside down than the previous longest on record.

It was not the deepest. That distinction belongs to March 20, 1980, when the spread hit −2.41 percentage points. The 2022–24 trough was −1.08 percentage points on July 3, 2023, which is 45% of the depth of the 1980 low.
The two records point in opposite directions. The 2022–24 episode was the longest in the record and only the third deepest, behind 1978–80 and 1980–82 (−1.70). A modern curve that stays inverted for 541 days, with a shallow bottom, is a different instrument from the 1980 curve that fell 2.41 points and recovered inside two years.
How long the signal took: 6.1 to 24.1 months
The question traders ask is when. The record gives a range, not a date. Take the first inverted reading of each cycle that was followed by a recession: August 1978, September 1980, December 1988, February 2000, December 2005, and August 2019. The time from the first inversion to the first flagged recession month was 17.5, 10.6, 19.6, 13.9, 24.1, and 6.1 months.

The median of those six is 15.7 months. The range is 18.0 months wide: the shortest lead, 6.1 months in 2019, and the longest, 24.1 months in 2005–07, are separated by a factor of about 4. Anyone who treats 12 months as the countdown is using a number that only two of the six cycles matched within a month or two.
The six recession starts in the record are February 1980, August 1981, August 1990, April 2001, January 2008, and March 2020. Every one of them was preceded by an inversion within the prior 24.1 months. That is a perfect record for recessions found after inversions. It is not a perfect record for inversions that found recessions, because the 1998 regime (34.2 months before a recession) and the 2022–24 regime (no recession flagged) are both in the table.
The re-steepening trap: recessions began 3.1 to 8.8 months after the curve normalized
Inversion is not the end of the sequence. In four of the cycles above, the curve turned positive again before the recession was flagged, and then the recession arrived. Measure from the last inverted reading to the first recession month and the interval is much shorter than the lead from the first inversion.
In 1989 the curve last printed below zero on November 6; the recession was flagged in August 1990, 8.8 months later. In 2000 the last inverted day was December 28 and the flag came in April 2001, 3.1 months later. In 2007 the last inverted day was June 5 and the flag was January 2008, 6.9 months later. In 2019 the last inverted day was August 29 and the flag was March 2020, 6.1 months later.
Four intervals: 8.8, 3.1, 6.9, 6.1 months. The longest is 8.8 months. None reached nine. In every one of the four cycles where the curve un-inverted before the downturn, the downturn showed up inside a window of less than nine months. That pattern is why the re-steepening phase, not the inversion itself, is the one that analysts of the series watch most closely.
544 sessions positive: the clock that broke the pattern
Apply that same measurement to the current cycle. The last inverted reading in the 2022–24 regime was September 5, 2024. Since then the series has printed 544 daily readings, every one of them at or above zero. The most recent reading, November 10, 2026, is 26.1 months after that last inversion.
The longest interval in the four earlier cycles was 8.8 months. The current gap is 26.1 months, which is 3.0 times the longest on record. As of the last data point the St. Louis Fed recession indicator reads zero for September and October 2026. No recession has been flagged.
That leaves the record with two readings, and the data cannot pick between them. In one, the signal is late: the 2022–24 inversion was the longest ever, so the lag between normalization and a downturn could also run longer than any earlier cycle. In the other, the signal missed this time, and the 1998 episode, 27 inverted days followed by 34.2 months of nothing and then a recession, was an earlier version of the same thing. Nine regimes cannot settle which story applies. They can only fix the size of the gap that the second story has to explain.
The other curve: 10-year minus 3-month stayed inverted 13 months longer
The 10-year minus 2-year spread gets the headlines, but the 10-year minus 3-month spread tells a longer version of the same story. In the 2022–24 episode it first inverted on October 18, 2022 and last printed below zero on October 16, 2025: 621 inverted days between those dates, against 541 for the 2-year version.
The 3-month version went deeper. Its trough was −1.89 percentage points on May 4, 2023, against −1.08 for the 2-year spread, a gap of 0.81 points. It also stayed inverted for 13 months and 11 days after the 2-year spread turned positive, from September 5, 2024 to October 16, 2025.
Timing is mixed. The 3-month spread first went below zero on March 27, 1989, April 7, 2000, January 17, 2006, and March 22, 2019. The 2-year spread had already inverted on December 13, 1988, February 2, 2000, and December 27, 2005, so the 3-month version lagged in those three cycles. In 2019 it led, by five months, ahead of the August 2019 inversion in the 2-year spread. One lead and three lags is a short sample.
Today the 3-month version reads +0.68 percentage points on November 10, 2026, against +0.25 for the 2-year version. The two curves are positive and the gap between them is 0.43 points.
Where the curve sits on November 10, 2026: +0.25 and narrowing
The latest readings: the 10-year Treasury yield was 4.88% and the 2-year was 4.56% on November 9, 2026, a spread of +0.32 percentage points. On November 10 the spread was +0.25. The 10-year minus 3-month spread was +0.68.
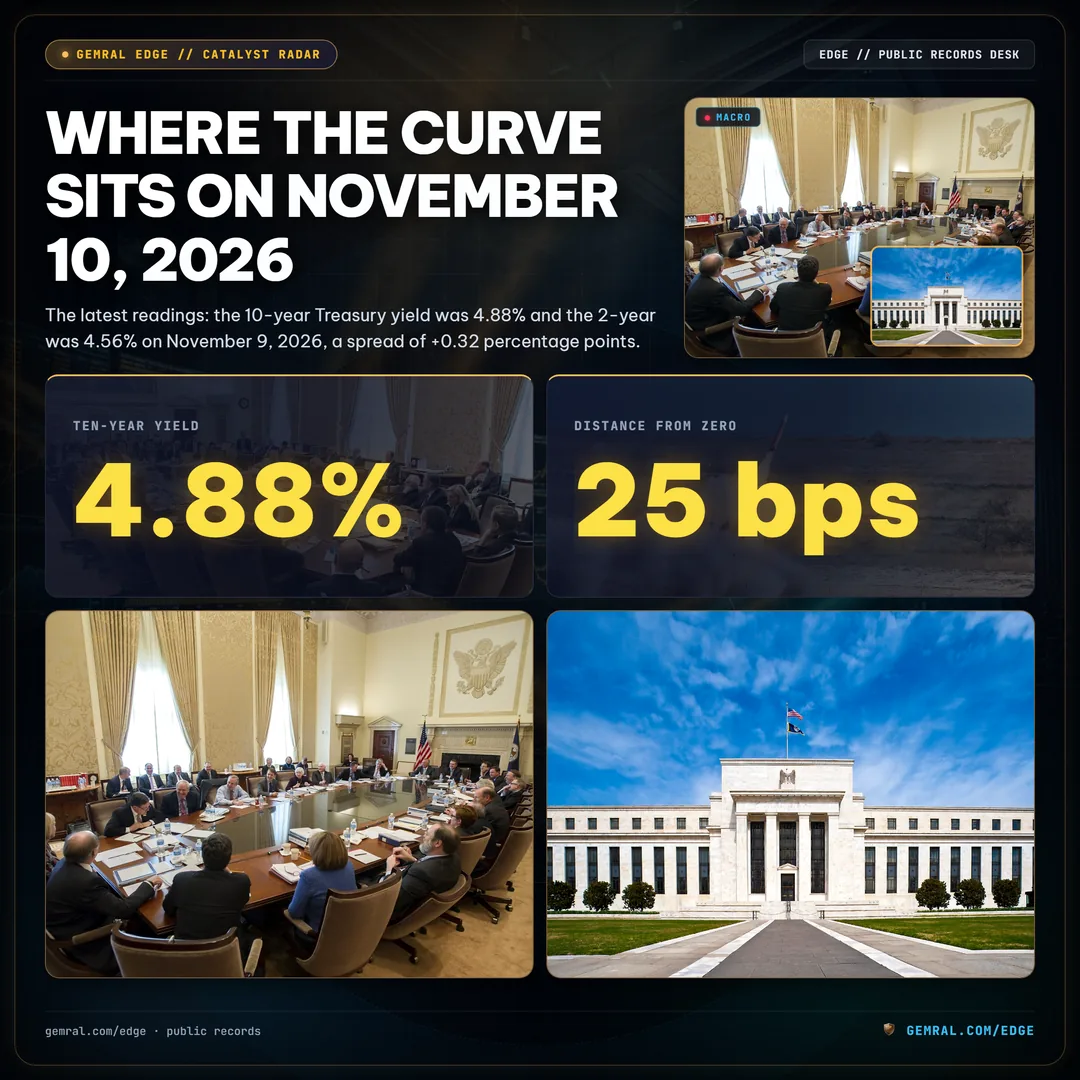
The direction matters as much as the level. The spread peaked at +0.74 on January 30, 2026, the highest reading since the 2024 un-inversion. From that peak to November 10 it has narrowed by 0.49 percentage points, a two-thirds reduction from the high (to 34% of its peak value) over nine months and ten days. A year ago, on November 10, 2025, it read +0.55. On May 11, 2026 it read +0.47, on October 9 it read +0.44, and on November 10 it read +0.25. Between October 9 and November 10, a span of 32 days, it lost 0.19 points, which is 39% of the whole decline from the January peak in one month.
The curve has not inverted again. It has gone from 0.74 to 0.25 and it is still positive. The distance from zero is 25 basis points. A spread of +0.25 does not predict an inversion. It marks how little room is left before one.
The live tracker for this signal sits on the yield curve disinversion and recession signal tracker. For the plumbing behind short-term yields, see the guides on Fed net liquidity and the repo market.
Inversions cluster by era, and the 2010s were almost empty
The 16.3% base rate hides how unevenly the 2,049 inverted days landed. Split the record by decade and the share of readings below zero reads 38.0% in 1976–79 (339 of 892), 26.4% in the 1980s (658 of 2,495), 1.7% in the 1990s (43 of 2,503), 18.6% in the 2000s (465 of 2,501), 0.1% in the 2010s (3 of 2,501), and 31.5% in 2020–26 (541 of 1,716).

The 2010s are the outlier. Three inverted readings in 2,501 sessions. The longest unbroken run of non-inverted readings in the entire record, 3,059 sessions, ran from June 6, 2007 to August 26, 2019. That is 12 years of a positive curve, ending with the three-day August 2019 inversion that preceded the March 2020 recession by 6.1 months.
Two readings follow. A trader whose experience began after 2009 saw an inverted curve on 0.1% of days in the first decade and 31.5% in the second. A trader who started in 1976 saw 38.0% in the first four years. Neither sample is the base rate. Both are the same series, and the 541-day regime of 2022–24 is the reason the current era sits at nearly one-third.
Where the spread stood on the day each recession began
Inversion is a condition. The day a recession is flagged is a different measurement, and the two do not match. On the first trading day of each of the six recession months in the record, the 10-year minus 2-year spread read −0.75 in February 1980, −1.21 in August 1981, +0.44 in August 1990, +0.76 in April 2001, +1.03 in January 2008, and +0.26 in March 2020.

Split them in two. In the two recessions of 1980 and 1981 the curve was still inverted when the downturn was flagged, by 0.75 and 1.21 percentage points. In the four since 1990 the curve was already positive, between +0.26 and +1.03. The latest reading, +0.25 on November 10, 2026, sits just under the bottom of that second range. A positive curve was the starting condition for the last four recessions, not an all-clear.
The 12 months before each start tell the same story from a different angle. In the year before the 2008 recession the spread averaged +0.27 and ranged from −0.15 to +1.04. In the year before the 2001 recession it averaged −0.10 with a range of −0.52 to +0.75. In the year before the 2020 recession it averaged +0.18, ranging from −0.04 to +0.34. Those are shallow numbers. None of the three looked like the 1980 curve, which averaged −0.67 in the 12 months before the downturn and touched −1.69.
Now put the current curve on the same scale. The record average is +0.84 percentage points, and the peak is +2.91 on February 4, 2011. Since the September 5, 2024 un-inversion, the 544 readings average +0.43, which is 51% of the record average. The latest reading is 8.6% of the record peak. A curve that spends 26 months at half of its historical average is not steep, and it is not inverted. It is flat, and the record contains very few flat stretches that lasted this long.
What the record cannot tell you
The sample holds 6 recessions and 9 inversion regimes, which is a small sample. Nine regimes, only six of which preceded a recession, is a smaller one. Every statistic in this report, including the 15.7-month median lead and the 8.8-month maximum re-steepening interval, rests on six or four data points. A fifth interval of 26.1 months, if it ends in a recession, would move the maximum threefold. If it ends without one, the four-cycle pattern will have a counterexample in its own sample.

Three more limits apply. First, the recession flag is assigned retroactively. The National Bureau of Economic Research dating committee announces peaks months after they happen, and the St. Louis Fed series updates when they do. A zero for September and October 2026 means no recession has been dated yet, which is a weaker claim than "none occurred." Second, the series measures a spread, not a cause. A positive reading does not mean growth is intact and a negative reading does not mean it is breaking. Third, the 2022–24 episode took place under a policy rate path and a balance sheet that the earlier regimes never saw, so nine independent observations is generous. Several of these are not independent of each other.
The four re-steepening intervals average 6.2 months; the current gap of 26.1 months is 4.2 times that average. What the record does support is narrower. The curve inverted before every recession flagged since 1976. The lead ranged from 6.1 to 24.1 months. When the curve normalized first, the downturn followed within 8.8 months, four times out of four. And the current clock, at 26.1 months, is outside every interval the record contains.
How the numbers were built
Daily 10-year minus 2-year constant-maturity spread, June 1, 1976 to November 10, 2026, 12,608 readings. Daily 10-year minus 3-month spread, January 4, 1982 to November 10, 2026. Yields for the November 9, 2026 snapshot: 10-year 4.88%, 2-year 4.56%. Recession months from the monthly indicator published by the Federal Reserve Bank of St. Louis, based on National Bureau of Economic Research peak and trough dates; the first flagged month of each recession is used as its start. A regime is a run of negative readings with gaps of 60 days or fewer merged. Lead times are measured in calendar days divided by 30.44. Every statistic above was computed from the daily files, and no reading was estimated, smoothed, or filled.
Public data · not investment advice. Gemral Edge tracks these Treasury curve readings at gemral.com/edge/events/yield-curve-disinversion-recession-signal-2026.
Frequently asked questions
What does it mean when the yield curve inverts?
It means the 2-year Treasury yield is higher than the 10-year yield, so the 10-year minus 2-year spread is below zero. Since 1976 that has happened on 2,049 of 12,608 daily readings, or 16.3% of the time, in nine separate regimes.
How long after an inversion does a recession start?
In the six cycles where a recession followed, the first recession month came 6.1 to 24.1 months after the first inverted reading, with a median of 15.7 months. Measured from the last inverted day, the four cycles where the curve normalized first saw recessions within 3.1 to 8.8 months.
Is the yield curve inverted right now?
No. On November 10, 2026 the 10-year minus 2-year spread was +0.25 percentage points and the 10-year minus 3-month spread was +0.68. The 10-year minus 2-year curve last inverted on September 5, 2024.
Has an inversion ever not been followed by a recession?
Twice in this record. The 1998 regime lasted 27 inverted days and a recession followed 34.2 months later. The 2022-24 regime, the longest at 541 inverted days, has no recession flagged as of the latest data.