Owners Equivalent Rent CPI: How Shelter Lag Shapes Core Inflation
An empirical macroeconomic investigation into the Bureau of Labor Statistics shelter imputation architecture, quantifying survey panel mechanics, private market rent transmission lags, real interest rate sensitivity, and institutional multi-asset capital allocation ahead of the November 2026 inflation release.
In systematic global macro investing, evaluating headline consumer price indicators without understanding the statistical construction of owners equivalent rent cpi is akin to trading corporate earnings without reconciling cash flow from operations. Within the United States Consumer Price Index compiled by the Bureau of Labor Statistics (BLS), the single largest expenditure component is not energy commodities, medical care services, or semiconductor electronics. It is an imputed, non-transactional calculation designed to capture the implicit consumption value of residential shelter enjoyed by owner-occupied households.
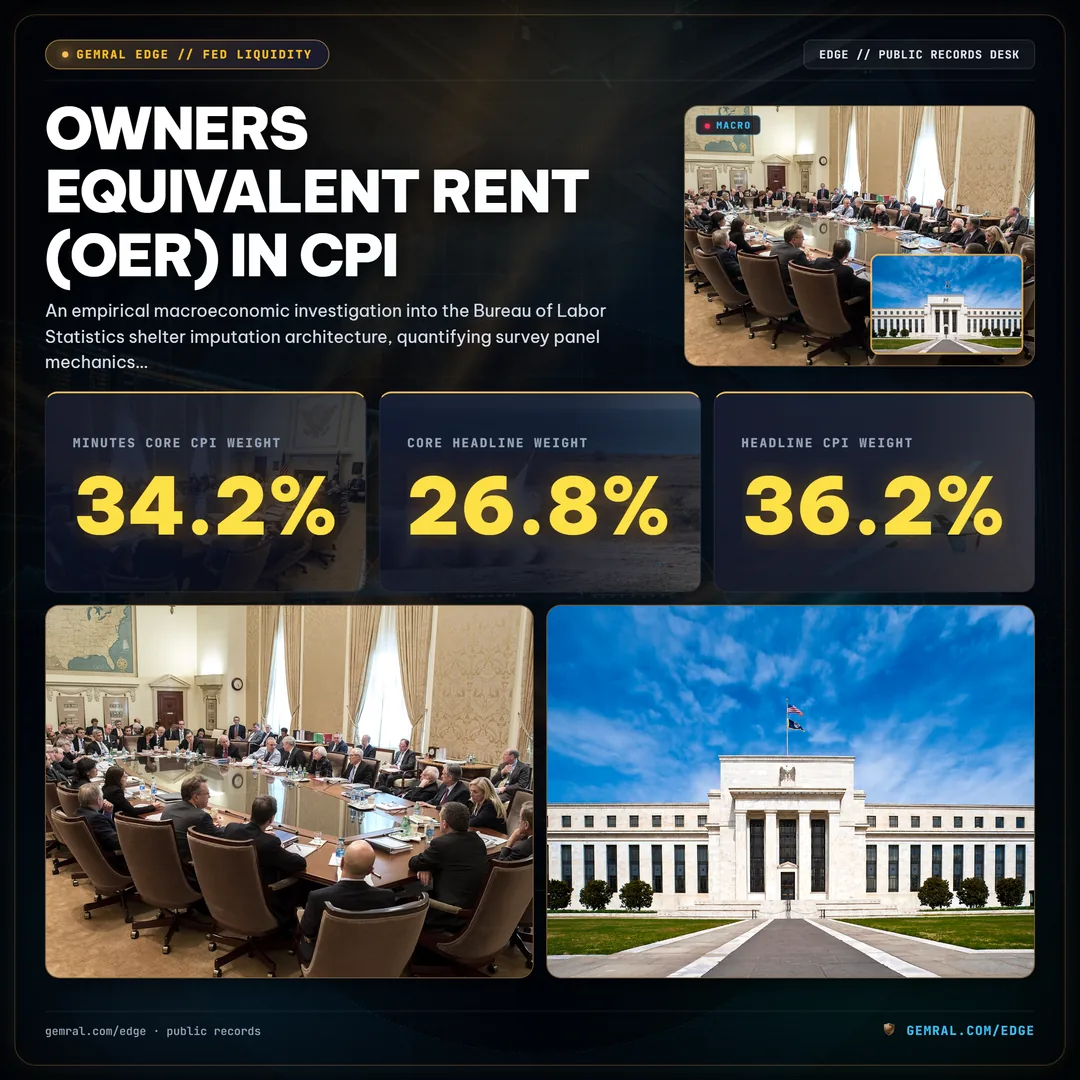
Representing approximately 26.8% of the Headline Consumer Price Index basket and 34.2% of Core CPI (which strips out volatile food and energy readings), Owners' Equivalent Rent of Residences (OER) exercises overwhelming mathematical leverage over the month-over-month trajectory of benchmark inflation. For institutional portfolio managers navigating terminal Federal Reserve policy rates, sovereign bond term premia, and currency cross-rates, understanding the mechanical structure of OER is paramount. Market participants who track real-time macro telemetry through our U.S. CPI Inflation November 2026 event tracker recognize that headline macroeconomic prints frequently lag real-economy price inflection points by three to four full quarters.
How Owners Equivalent Rent (OER) Dictates Core Consumer Price Index Weighting
To evaluate why shelter inflation dominates macroeconomic models, analysts must examine the expenditure weights established by the BLS Consumer Expenditure Survey. The Consumer Price Index is structured around an exhaustive basket of goods and services partitioned into eight major expenditure groups: Food and Beverages, Housing, Apparel, Transportation, Medical Care, Recreation, Education and Communication, and Other Goods and Services. Housing constitutes the absolute heavyweight of this aggregate structure, commanding roughly 36.2% of the total Headline CPI weight.
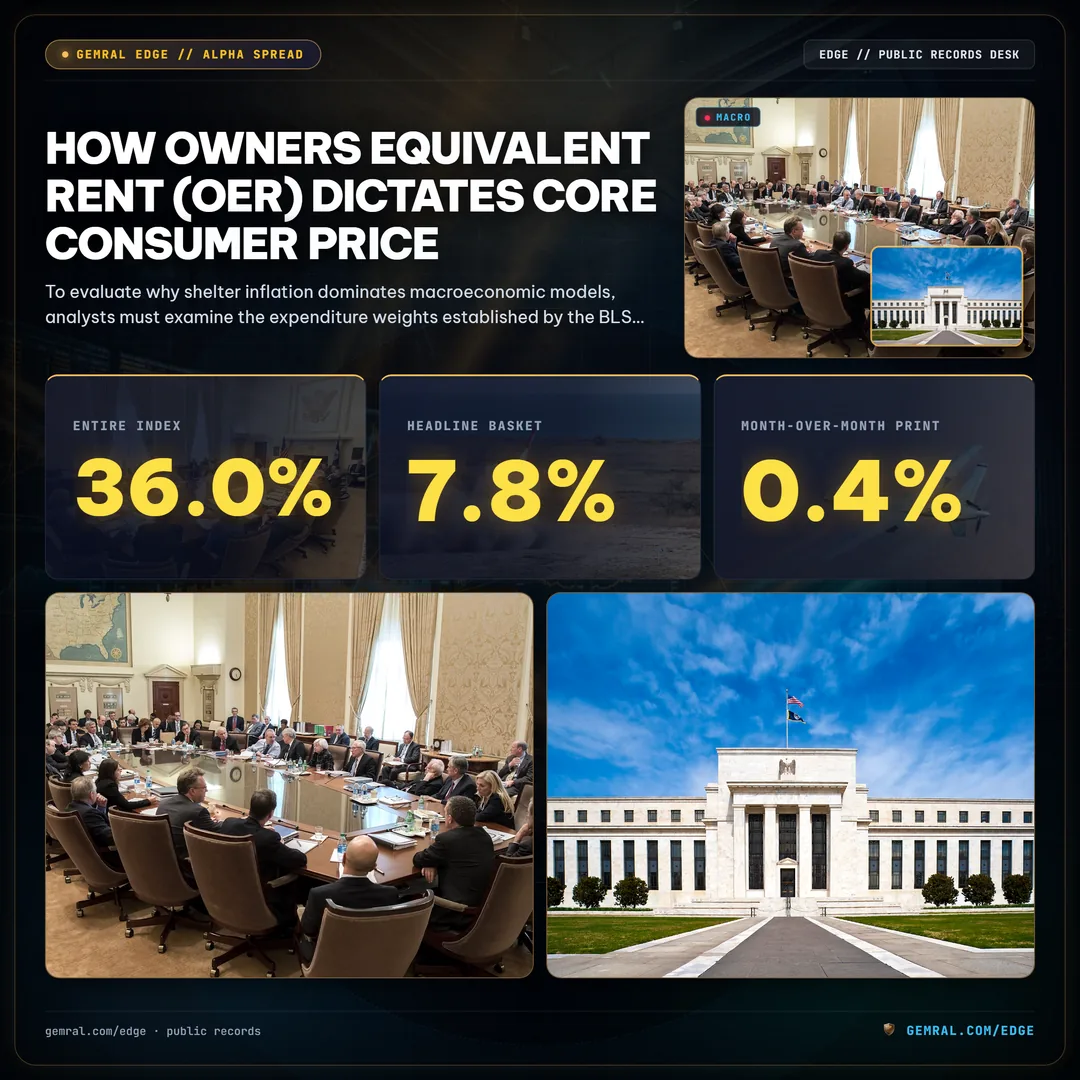
Within the broader Housing classification, shelter services represent the dominant component, absorbing approximately 36.0% of the entire index. The shelter category is split into two primary operational sub-components: Primary Tenant Rent (representing approximately 7.8% of the Headline basket) and Owners' Equivalent Rent (commanding approximately 26.8% of Headline CPI and over 34.2% of Core CPI). Lodging away from home and tenants' insurance make up the remaining nominal fractions.
- Structural Dominance in Core CPI: Because the Federal Open Market Committee (FOMC) focuses primarily on Core inflation measures to assess underlying secular price pressures, the 34.2% weight of OER gives it unmatched influence over central bank policy decisions. A 0.4% month-over-month print in OER contributes nearly 14 basis points directly to the Core CPI monthly annualized run-rate.
- Separation of Asset Investment from Consumption: The BLS treats residential real estate purchases as capital investments rather than consumer expenditures. If the BLS tracked home sales prices, mortgage interest rates, or down payments directly, the index would conflate capital accumulation with the cost of daily living. OER was adopted to isolate the pure service flow of residential housing shelter.
- Asymmetry Between Homeowners and Renters: While tenant rent measures actual monetary cash transfers between landlords and tenants, OER measures a counterfactual economic concept: the hypothetical rental income a homeowner foregoes by living in their home rather than leasing it to an external tenant.
When evaluating broader macroeconomic transmission mechanisms, desks tracking monetary aggregates frequently cross-reference our empirical analysis on repo market dynamics and institutional liquidity, as systemic banking reserves and collateral velocity directly modulate commercial real estate financing channels.
The Bureau of Labor Statistics Imputation Methodology: Surveying Rental Equivalents for Owner-Occupied Homes
The mathematical calculation of OER by the Bureau of Labor Statistics relies on an intricate sampling and imputation framework known as the Rental Equivalence Approach. Rather than asking millions of homeowners what they believe their homes could rent for—a subjective survey method abandoned in the early 1980s due to pervasive homeowner estimation bias—the BLS derives OER from a sampled universe of market-leased tenant units.
The BLS Housing Survey tracks a longitudinal panel of approximately 50,000 rental housing units located across 75 core Primary Sampling Units (PSUs) throughout the United States. To allocate representative rental values to owner-occupied residences, the BLS employs an advanced spatial and physical weighting algorithm:
- Six Rotating Survey Panels: The sampled housing units are partitioned into six distinct panels. Each panel is interviewed once every six months on a staggered rotation. Panel 1 is surveyed in January and July; Panel 2 is surveyed in February and August; Panel 3 in March and September; Panel 4 in April and October; Panel 5 in May and November; and Panel 6 in June and December.
- Biannual Semiannual Price Relatives: Because each specific physical address is surveyed only twice per calendar year, the monthly change in the index is derived from the semiannual change observed in the active panel, scaled down to an annualized monthly rate through continuous sixth-root geometric linking.
- Spatial and Structural Stratification: In each geographic sampling area, tenant housing units are stratified into demographic, geographic, and structural cells based on property size, construction vintage, and detached single-family versus multi-family architecture.
- Owner Weighting Reweight Adjustment: The BLS applies specialized Census-derived owner weights to rental units situated in neighborhoods with high homeownership rates. This ensures that detached suburban single-family rental structures are weighted heavily when calculating OER, whereas multi-family high-rise rental buildings receive greater weighting in the Tenant Rent index.
| Methodological Dimension | Owners' Equivalent Rent (OER) | Primary Tenant Rent |
|---|---|---|
| Headline CPI Expenditure Weight | 26.8% | 7.8% |
| Core CPI Expenditure Weight | 34.2% | 9.9% |
| Primary Structural Composition | Single-family detached suburban homes (over 70% weighted) | Multi-family apartment complexes and urban residential units |
| Transaction Base | Imputed service flow using matched neighborhood rental rates | Actual monthly contractual lease cash flows paid by tenants |
| Utility Adjustment Mechanics | Utilities excluded; implicit rent assumes tenant covers utilities | Explicit adjustment applied if landlord includes heating/water |
The 12-to-18 Month Shelter Lag: Transmission Dynamics from Private Market Rents to Official BLS Prints
The most critical structural feature of OER for quantitative macro strategists is its profound temporal lag relative to real-time market clearing conditions. Empirical economic research conducted by the Federal Reserve Bank of San Francisco, the Federal Reserve Bank of Cleveland, and academic institutions indicates that changes in spot residential lease rates require between 12 and 18 months to transmit fully into the published BLS Shelter and OER indices.

This prolonged structural transmission delay is not an accidental survey flaw, but an unavoidable mathematical consequence of how the BLS measures consumer shelter costs:
- In-Place Leases vs. Marginal Spot Leases: In any given month, only approximately 8% to 10% of residential leases in the United States are renegotiated or executed for new tenants. The remaining 90% to 92% of households occupy homes under existing 12-month or multi-year leases with fixed nominal payments. Private market indices (such as Zillow Observed Rent Index or Apartment List) measure the marginal rate on new leases, whereas the BLS Housing Survey measures the average rent paid across all active units, including in-place legacy contracts.
- Semiannual Staggered Sampling Latency: Because any specific housing unit is revisited only once every six months, a sharp pivot in local rent growth that occurs in January will only be partially detected in Panels 1 through 6 as they cycle through their biannual reporting schedule over the subsequent 180 days.
- Smoothing Through Exponential Moving Averages: The combination of staggered panel sampling and sixth-root geometric averaging causes the BLS Shelter index to behave mathematically like a 12-month trailing moving average of spot lease transactions. As a result, when private market rents decelerate rapidly, official OER prints continue to rise as existing below-market leases reset higher upon renewal.
During the inflationary surge of 2021–2022, private market spot rent growth peaked at over 15.0% year-over-year in late 2021 according to private market telemetry. However, official BLS OER inflation did not reach its cyclical peak until early 2023—nearly 16 months later—when it crossed 8.1% year-over-year. Similarly, as private market rent inflation collapsed back toward 1.5% to 2.5% across 2024 and 2025, official OER remained stubbornly elevated between 4.8% and 5.4%, creating persistent distortion across headline macroeconomic data.
Alternative Telemetry vs. Lagged Metrics: Cross-Referencing Zillow ZORI, Apartment List, and Census Bureau Housing Surveys
To eliminate the blind spots created by official government reporting delays, systematic macro hedge funds and institutional research desks construct high-frequency alternative inflation trackers. By monitoring granular private market transaction datasets, quantitative analysts can accurately nowcast official OER inflections two to three quarters before they appear in the BLS release schedule.

The primary alternative datasets utilized across systematic trading operations include:
- Zillow Observed Rent Index (ZORI): ZORI tracks repeat-rent transactions across millions of listed rental properties, utilizing a hedonic pricing model to control for structural property quality, bedroom count, and geographic location. Because ZORI measures marginal asking rents for newly available inventory, its year-over-year growth rate leads the BLS OER index by an average of 12 months with a statistically robust correlation coefficient of r = 0.82.
- Apartment List National Rent Index: Utilizing an extensive database of institutional multi-family lease executions, Apartment List calculates median rent shifts across metropolitan areas. Unlike asking-price portals, this series captures landlord concessions, free-rent lease incentives, and net effective rental rates, leading BLS Tenant Rent by approximately 10 to 14 months.
- U.S. Census Bureau New Residential Construction & Absorption: Measuring the completion and leasing velocity of new privately owned housing structures, Census data provides vital leading supply indicators. A heavy influx of completed multi-family units in sunbelt markets directly depresses spot asking rents, setting in motion downstream deceleration across future BLS survey panels.
- Federal Reserve Bank of Cleveland New Tenant Rent Index (NTR): Developed specifically to replicate BLS sampling methods while isolating newly signed leases from continuing leases, the NTR index serves as an empirical bridge between private portals and official methodology. Historically, turning points in the Cleveland Fed NTR precede turning points in published OER by roughly 12 months.
| Dataset Provider | Measurement Focus | Sampling Frequency | Empirical Lead Over BLS OER |
|---|---|---|---|
| Zillow (ZORI) | Asking rents for new leases; single & multi-family hedonic repeat-rent | Monthly (T+15 days) | 12 to 14 Months |
| Apartment List | Effective executed new leases with concession adjustments | Monthly (T+1 day) | 10 to 12 Months |
| Cleveland Fed NTR | BLS survey subset tracking newly signed tenant agreements | Quarterly (T+45 days) | 12 to 15 Months |
| BLS OER (Official) | Average rent paid across all existing and new leases with owner weights | Monthly (T+12 days) | Lagging Indicator (Baseline) |
Mathematical Sensitivity: Why a 10-Basis-Point Shift in OER Swings Core CPI Trajectories
The mathematical leverage exerted by OER on aggregate inflation requires quantitative desks to model fractional basis-point variations with extreme precision. Because OER represents 34.2% of the Core CPI basket, small unexpected deviations in its monthly print cascade directly into benchmark core annualized metrics.

Consider the mathematical mechanics of Core CPI aggregation. Let Core CPI month-over-month inflation be defined as:
Substituting the baseline structural weights:
- Weight of OER in Core CPI: w_OER ≈ 0.342
- Weight of Primary Rent in Core CPI: w_Rent ≈ 0.099
- Combined Shelter Weight in Core CPI: w_Shelter ≈ 0.441 (44.1%)
If OER prints at 0.35% month-over-month instead of a consensus forecast of 0.25%—a variance of exactly 10 basis points (0.10%)—the direct mathematical contribution to Core CPI is:
In an environment where non-shelter Core CPI (core goods and non-housing core services) is compounding at approximately 0.15% month-over-month (consistent with a 1.8% annualized rate), this single 10-basis-point upside surprise in OER lifts overall Core CPI from 0.20% to nearly 0.24% on an unrounded basis. On an annualized basis (compounded over 12 months), that 3.42-basis-point monthly shift increases the annualized Core CPI run-rate by more than 41 basis points:
This extreme mathematical sensitivity explains why algorithmic headline-scanning trading systems react violently to shelter prints within milliseconds of the 8:30 AM Eastern release time. An unrounded difference of a few hundredths of a percent in OER can alter whether consensus Core CPI rounds up or down to the nearest tenth of a percent, triggering multi-billion-dollar reallocations across global rates and equity futures.
Desks evaluating the broader transmission of consumer price prints into corporate profit margins and index volatility can examine our empirical study on how CPI releases affect equity valuations across macroeconomic regimes.
Federal Reserve Policy Transmission: Real Interest Rates, Treasury Yield Curves, and the Supercore Inflation Dilemma
Federal Reserve policymakers have long recognized the distortionary nature of shelter lags. In response to persistent shelter stickiness, Federal Reserve Chair Jerome Powell and FOMC economists frequently emphasize an alternative metric known colloquially as "Supercore Inflation": Core Services Excluding Housing (Core PCE/CPI Services minus Shelter). In late 2026, navigating this statistical wedge remains central to setting benchmark interest rates:

The Supercore metric attempts to measure labor-intensive domestic service inflation—including healthcare, professional services, hospitality, transportation, and recreation—where wage growth and domestic demand pressures are thought to translate most directly into price discovery. When Supercore decelerates toward a 2.1% annualized pace while OER remains anchored at 4.2% annualized, overall Core CPI prints artificially near 3.1%, creating profound policy divergence.
- The Taylor Rule and Neutral Policy Rates: Standard monetary policy reaction functions, such as the Taylor Rule or inertial policy models, rely on reported Core inflation prints to establish the benchmark policy rate. When lagged OER keeps reported Core CPI elevated above 3.0%, standard policy rules generate recommendations for higher terminal policy rates (such as a 4.75% to 5.00% Fed Funds target), even when real-time spot rents are completely flat at 0.0% to 1.0% annualized growth.
- Transmission to Real Yields: Real policy rates (defined as the nominal Fed Funds rate minus forward inflation expectations) become artificially elevated when central banks maintain high nominal rates against lagged shelter prints. If headline inflation is mechanically pulled downward as past shelter lags expire, real ex-post interest rates spike by 50 to 75 basis points, creating an unintended tightening impulse across commercial banking channels and corporate debt refinancing windows.
- Treasury Yield Curve Dynamics: The 2-year U.S. Treasury yield is acutely sensitive to the path of OER. When monthly OER prints exceed 0.35%, market-implied probabilities for a 25-basis-point rate cut plummet by over 40%, pushing 2-year yields higher by 12 to 18 basis points and flattening or inverting the 2-year/10-year Treasury yield curve. Conversely, when OER reliably downshifts below 0.28%, traders price in aggressive 75-to-100-basis-point rate cutting cycles, steepening term premia across the curve.
For quantitative macro trading desks, this dynamic creates exploitable cross-asset mispricings. Because market participants often treat official Core CPI as truth rather than an artifact of an 18-month moving average, bond markets systematically overprice future inflation risks during periods when spot market rents are falling but official OER has not yet inflected downward.
Empirical Case Studies: Institutional Fixed Income Allocation and Treasury Volatility Across Inflation Surprises
To examine how institutional desks navigate OER releases, historical empirical case studies provide valuable quantitative roadmaps across different macroeconomic regimes.

Case Study 1: The January 2024 OER Decoupling Shock
In January 2024, the BLS released CPI data showing that while Primary Tenant Rent decelerated to 0.36% month-over-month, Owners' Equivalent Rent unexpectedly accelerated to 0.56% month-over-month—a wide divergence between two series that historically track with a correlation above 0.95. This divergence occurred because the BLS updated its geographic sampling weights, increasing the proportion of single-family detached homes within the OER calculation.
Systematic desks that had monitored private single-family rental indices (such as Invitation Homes and American Homes 4 Rent operational disclosures) had anticipated structural stickiness in suburban detached rents, successfully positioning short duration in front-end SOFR futures prior to the release.
Case Study 2: The Mid-2024 Multi-Family Supply Wave Resolution
By mid-2024, an unprecedented wave of multi-family completions across the Sunbelt (over 450,000 apartment units completed within 12 months) forced private landlords to offer up to 8 weeks of free rent concessions. As these concessions permeated existing lease renewal negotiations, the BLS Tenant Rent and OER indices resumed their structural downward glide, printing consecutive 0.28% to 0.32% monthly prints.
Institutional portfolios that systematically integrated high-frequency construction telemetry captured the duration rally by extending maturity allocations in investment-grade corporate credit and municipal bond portfolios.
Institutional Data Infrastructure: Tracking Macroeconomic Telemetry and Inflation Shocks Through Gemral Edge
The structural complexities of Owners' Equivalent Rent highlight why top-tier institutional funds, systematic trading desks, and quantitative asset managers rely on multi-stream alternative data feeds rather than stale consensus expectations. When economic models depend on statistical metrics constructed with 18-month transmission delays, market participants possessing point-in-time telemetry maintain a decisive analytical edge.

Traditional macroeconomic forecasts rely heavily on unadjusted autoregressive models that fail during structural regime shifts. In contrast, systematic macro strategies integrate Point-in-Time (PIT) alternative data feeds to eliminate look-ahead bias and capture real-time economic turning points:
- Strict Point-in-Time Data Architecture: Backtesting macro strategies requires freezing exactly what was known at the timestamp of market execution. Because historical BLS seasonal adjustment factors undergo retrospective revisions every February (revising up to five prior years of data), naive models generate spurious alpha. The platform archives immutable historical snapshots, ensuring that factor backtests reflect true point-in-time informational states.
- High-Frequency Rental Telemetry Ingestion: By tracking real-time rental listings across major geographic Metropolitan Statistical Areas (MSAs), quantitative algorithms evaluate regional dispersion across single-family versus multi-family asset classes, anticipating official BLS panel rotations weeks before government enumerators compile final indices.
- Cross-Signal Macro Attribution: Combining physical infrastructure data—such as power grid telemetry and equipment shipment volumes—with monetary liquidity indicators provides institutional portfolio managers with a multidimensional surveillance architecture, linking micro-level supply constraints directly to macro-level inflation dynamics.
The Gemral Edge platform delivers point-in-time macroeconomic telemetry, regulatory event tracking, and alternative supply chain signals across three professional institutional subscription tiers:
Pro Tier
Designed for individual equity research analysts and macro traders tracking high-frequency inflation calendars, custom hardware supply chains, and event-driven market releases.
B2B Intelligence
Comprehensive access for institutional macro research desks, fixed income strategy teams, and corporate treasury offices modeling physical data center deployments and economic nowcasts.
Institutional API
Low-latency programmatic API access providing direct automated feeds of point-in-time customs imports, physical facility utility telemetry, and normalized corporate capex records for systematic quantitative strategies.
Investment teams executing historical backtests can explore our institutional data preview or integrate comprehensive alternative data packages directly into systematic macro factor models.
Frequently asked questions
What is Owners Equivalent Rent (OER) in the CPI?
Owners Equivalent Rent (OER) is the implicit rent that owner-occupants would have to pay if they were renting their homes unfurnished in the current market. Because home purchases are treated as capital investments rather than consumer goods, the BLS uses OER to measure the continuous consumption value of shelter services without incorporating asset price inflation or interest rates.
How much does Owners Equivalent Rent weigh in Headline and Core CPI?
As of late 2026, Owners Equivalent Rent carries an expenditure weight of approximately 26.8% in the Headline CPI basket and over 34.2% in the Core CPI basket (which excludes volatile food and energy components), making it the single largest component of consumer price inflation.
Why does shelter inflation lag private rental market indices by 12 to 18 months?
The BLS surveys a continuous longitudinal panel of approximately 50,000 rental housing units divided into six rotating panels visited once every six months. Because official surveys capture existing leases alongside new leases, price adjustments reflect gradual annual contract renewals rather than high-frequency spot lease prices tracked by private indices like Zillow ZORI or Apartment List.
How does OER influence Federal Reserve monetary policy and Treasury yields?
Because OER dominates Core CPI, persistent shelter inflation creates stickiness in core readings, complicating central bank rate reductions. Fixed income and macroeconomic trading desks monitor high-frequency alternative rent metrics to front-run turning points in official OER prints before they shift 2-year and 10-year Treasury yield curves.