Fed Rate Decision Prediction: FOMC Liquidity Plumbing and Reserve Drain
Fed rate decision prediction relies on measuring central bank liquidity plumbing rather than discretionary macroeconomic commentary. While fed funds futures price policy rate probabilities, empirical rate decisions and balance sheet adjustments are governed by interbank funding pressures across the overnight reverse repo (ON RRP) facility, Treasury General Account (TGA) cash balances, and Secured Overnight Financing Rate (SOFR) spreads relative to the Fed funds corridor. Tracking these three reserve indicators reveals institutional capital constraints weeks before official FOMC statements.

Direct Answer:
Fed rate decision prediction relies on measuring central bank liquidity plumbing rather than discretionary macroeconomic commentary. While fed funds futures price policy rate probabilities, empirical rate decisions and balance sheet adjustments are governed by interbank funding pressures across the overnight reverse repo (ON RRP) facility, Treasury General Account (TGA) cash balances, and Secured Overnight Financing Rate (SOFR) spreads relative to the Fed funds corridor. Tracking these three reserve indicators reveals institutional capital constraints weeks before official FOMC statements.
Fed Rate Decision Prediction and the FOMC Liquidity Transmission Mechanism
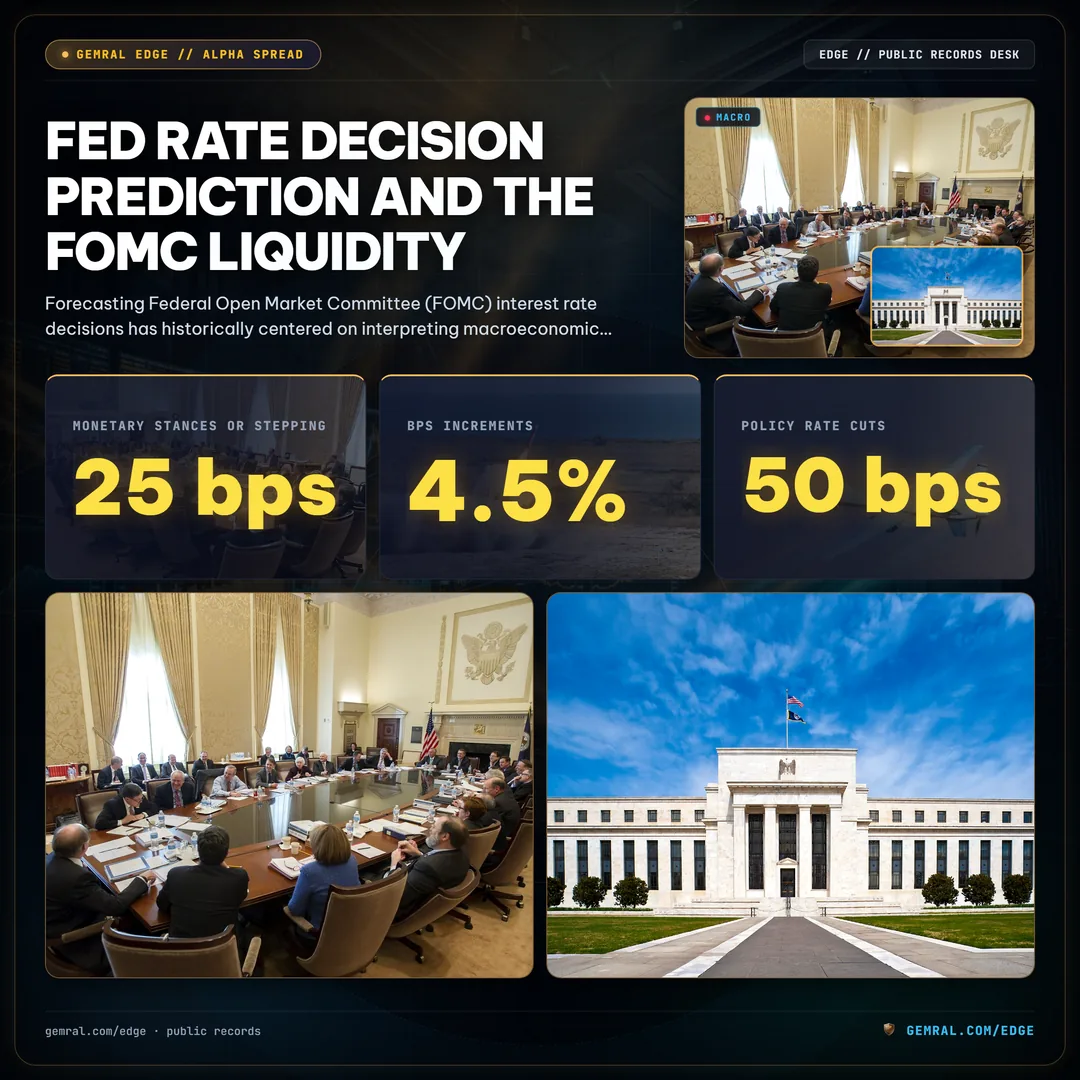
Forecasting Federal Open Market Committee (FOMC) interest rate decisions has historically centered on interpreting macroeconomic commentary, non-farm payroll reports, and Consumer Price Index releases. However, discretionary economic narratives routinely fail to capture the mechanical constraints governing modern monetary policy. The Federal Reserve does not manage the economy through rhetorical persuasion; it executes policy through balance sheet mechanics, interest on reserve balances (IORB), and open market operations conducted through primary dealers.
A rigorous predictive framework requires decomposing the Federal Reserve balance sheet into its active and sterilized components. As of November 2026, total System Open Market Account (SOMA) assets stand at $6.984T. In an abundant-reserve operating regime, the central bank maintains short-term interest rates within its target corridor by adjusting administered rates: the interest on reserve balances rate, the overnight reverse repurchase agreement offering rate, and the primary credit discount window rate.
When commercial bank reserves held at Federal Reserve Banks exceed institutional demand, the Effective Federal Funds Rate (EFFR) trades stably near the middle of the policy corridor, typically around 5.25% to 5.50% during restrictive monetary stances or stepping down in 25 bps increments toward 4.5% during recalibration cycles. However, as quantitative tightening drains bank reserves from the monetary core, liquidity velocity slows, forcing interbank lending facilities to compete for eligible sovereign collateral.
Quantitative researchers analyzing point-in-time central bank disclosures recognize that the FOMC cannot maintain policy rates in isolation from money market settlement mechanics. When private market repurchase rates detach from administered central bank rates, the Fed is structurally compelled to pivot—either through emergency liquidity injections, altering the pace of balance sheet runoff, or implementing unscheduled 50 bps policy rate cuts to alleviate collateral blockages across domestic clearing banks.
By analyzing weekly Federal Reserve Statistical Release H.4.1 disclosures, institutional desks bypass noisy press conference transcripts and track hard balance sheet realities. Total reserve balances, currency in circulation, and foreign repo obligations provide an unalterable audit trail of central bank balance sheet expansion or contraction. This empirical discipline enables quantitative analysts to forecast policy rate adjustments with precision weeks ahead of consensus economists.
Fed Funds Futures Probabilities vs Balance Sheet Liquidity Realities
Financial media and retail market participants heavily rely on the CME FedWatch tool, which computes implied interest rate probabilities directly from 30-Day Fed Funds futures contract prices. While futures markets accurately capture short-term dealer consensus within 10 to 14 days of an FOMC meeting, they frequently exhibit recurring forecasting errors across multi-month horizons. Implied probabilities oscillate wildly based on high-frequency sentiment and headline economic indicators, reflecting dealer positioning rather than underlying liquidity capacity.

In contrast, balance sheet liquidity reality is dictated by the net capital available to commercial banks. Even when futures markets assign an 80% probability to the Federal Reserve holding interest rates steady, a concurrent contraction in net commercial reserves can force policymakers into an unscheduled dovish tilt. Futures pricing represents the market's expectation of human decision-making, whereas balance sheet telemetry measures the physical boundary conditions within which the FOMC must operate.
During the aggressive rate-hiking campaign spanning 2022 to 2023, the federal funds target rate was elevated by over 500 bps. Throughout this period, implied rate cuts were repeatedly priced into futures curves and subsequently obliterated as inflation metrics printed above target. However, allocators tracking the Federal Reserve Net Liquidity formula noticed that despite rate hikes, sovereign liquidity remained elevated because non-bank capital drained from the overnight reverse repo facility directly into newly issued Treasury bills.
This dynamic created a synthetic liquidity cushion that insulated financial markets from policy rate tightening. Understanding the divergence between fed funds futures pricing and actual reserve levels prevents institutional desks from being whipsawed by rate-cut expectations. When futures markets price aggressive easing while reserve balances remain abundant, risk assets can sustain elevated valuations without immediate monetary easing.
Conversely, when futures contracts price an extended pause but interbank reserve buffers approach exhaustion levels below 10% of nominal GDP, the probability of an emergency policy rate cut or a tapering of quantitative tightening escalates rapidly. Systematic desks quantify this spread between market consensus and reserve plumbing to deploy non-consensus macro hedges with asymmetric risk-reward profiles.
Overnight Reverse Repo Exhaustion and the Commercial Reserve Buffer
The most consequential macroeconomic transformation of the 2024 to 2026 cycle has been the systematic depletion of the Federal Reserve Overnight Reverse Repurchase (ON RRP) facility. Created to establish a firm floor under short-term money market rates, the ON RRP facility absorbed multi-trillion volumes of surplus liquidity following post-pandemic quantitative easing, swelling to an unprecedented historic peak of $2.55T in mid-2023. Money market mutual funds parked trillions in cash overnight at the Fed rather than holding low-yielding commercial paper or bank deposits.
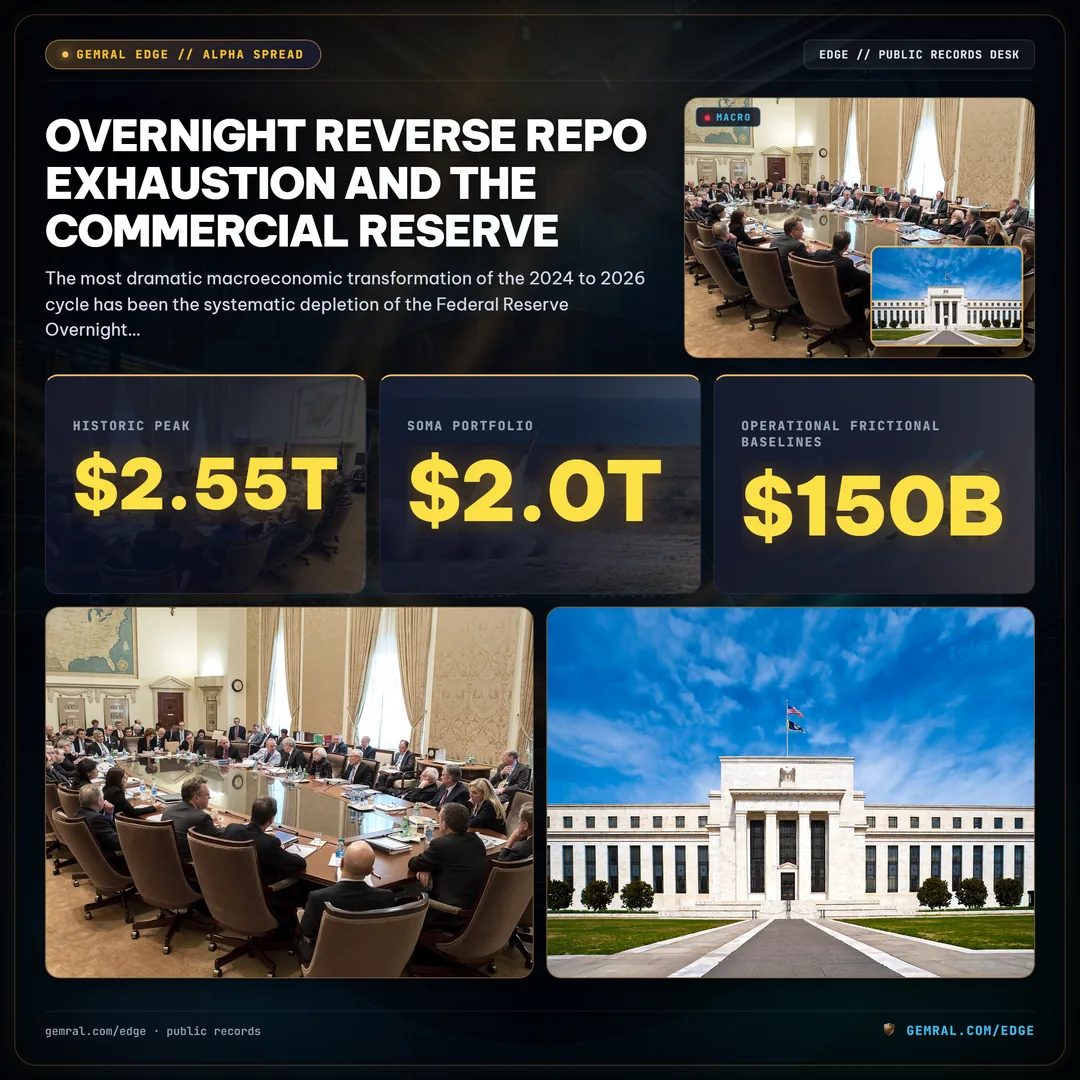
As the United States Department of the Treasury ramped up short-term Treasury bill issuance, money market funds found higher yields in sovereign paper than in the ON RRP facility offering rate. This triggered a relentless drainage: ON RRP balances collapsed from $2.55T down to $298B by late 2026. For two years, this facility acted as a monetary shock absorber, allowing the Federal Reserve to reduce its SOMA portfolio by nearly $2.0T without diminishing the actual reserves held by commercial banking institutions.
Now that ON RRP balances have contracted toward operational frictional baselines between $150B and $200B, the monetary buffer is fully exhausted. Every additional dollar of balance sheet runoff (Quantitative Tightening) directly reduces commercial bank reserve balances at Federal Reserve Banks. This operational pivot alters the predictive equation for future rate cuts and quantitative easing restarts.
In banking regulation, the concept of Lowest Comfortable Level of Reserves (LCLOR) defines the minimum reserve balance required by domestic systemically important banks (G-SIBs) to satisfy liquidity coverage ratios and intraday payment obligations. Federal Reserve surveys historically estimate LCLOR at approximately 8.0% to 10% of nominal GDP, translating to roughly $3.0T to $3.2T in aggregate reserves.
When bank reserves dip toward this statutory threshold, commercial banks cease lending surplus funds into overnight money markets, choosing instead to hoard liquidity for regulatory compliance. Once ON RRP cash is completely depleted, quantitative tightening shifts from draining idle money market balances to constricting productive banking credit. This structural inflection forces the FOMC to terminate balance sheet runoff and lower policy interest rates to preserve financial stability.
Treasury General Account Fluctuations and Sovereign Cash Dynamics
While the Federal Reserve dictates monetary policy, the United States Department of the Treasury exerts direct, volatile control over daily market liquidity through the Treasury General Account (TGA). Maintained directly at the Federal Reserve Bank of New York, the TGA operates as the operational checking account for the federal government, funding federal payrolls, entitlement programs, military procurement, and sovereign debt service.

The mechanical interaction between the TGA and commercial banking reserves is zero-sum. When the Treasury collects quarterly corporate and individual tax revenues, or executes net debt issuance, dollars leave private commercial bank deposit accounts and settle into the TGA at the Fed. This transfer immediately drains commercial bank reserves, tightening interbank liquidity conditions. Conversely, when the Treasury spends cash down into the economy, sovereign deposits flow back into commercial bank reserve accounts, expanding private monetary supply.
Across recent fiscal cycles, Treasury cash management targets have fluctuated significantly. The Treasury generally aims for an end-of-quarter TGA cash balance between $750B and $850B to safeguard against debt ceiling constraints and market volatility. However, rapid swings in TGA balances—sometimes exceeding $150B to $200B within a two-week tax settlement window—create synthetic liquidity shocks that rival formal central bank open market operations.
For macro researchers tracking Fed rate decision prediction, monitoring the Treasury's Quarterly Refunding Announcement (QRA) is as critical as analyzing FOMC statements. The QRA details the maturity distribution and aggregate borrowing requirements for upcoming quarters. When the Treasury leans heavily on short-dated Treasury bills rather than long-dated coupon bonds, it draws liquidity out of short-term money market funds rather than institutional asset management portfolios.
When the Treasury reconstitutes its TGA balance following debt limit resolutions or fiscal spending pauses, the resulting reserve contraction routinely induces elevated equity volatility and widening credit spreads. Quantitative allocators map scheduled TGA drawdowns and replenishments to project interbank reserve availability, anticipating periods of market vulnerability that increase the probability of emergency central bank liquidity backstops.
SOFR Spreads and Interbank Stress: Detecting Pre-FOMC Liquidity Strain
When systemic liquidity drains from commercial banking networks, stress does not manifest initially on public equity exchanges. The earliest and most reliable warning signals surface in overnight sovereign collateral markets, specifically measured through the Secured Overnight Financing Rate (SOFR) and its relationship to the Effective Federal Funds Rate (EFFR) and the IORB.

Under unconstrained, abundant-reserve conditions, SOFR trades comfortably below or equal to IORB, reflecting the secured nature of Treasury-backed overnight repurchase transactions relative to unsecured interbank deposits. However, during month-end settlements, Treasury auction funding dates, and fiscal tax deadlines, primary dealer balance sheet capacity encounters acute balance sheet limits.
When primary dealers are inundated with newly issued Treasury collateral while commercial reserves are constrained, the rate charged to finance sovereign paper spikes. In late 2026, quantitative surveillance screens detected recurring SOFR spikes exceeding 15 bps above the IORB benchmark during quarter-end reporting dates. While isolated single-day spikes can reflect calendar friction, multi-day elevated SOFR spreads signal structural reserve scarcity across clearing banks.
Institutional desks track the 99th-percentile distribution of SOFR prints alongside the volume-weighted median. When the spread between the 99th percentile and the median widens beyond 25 bps, smaller non-primary dealers and hedge funds face severe repo haircuts and escalating financing costs. If left unaddressed by central bank facilities, this collateral friction rapidly spills over into corporate credit markets and algorithmic equity positioning.
To prevent a catastrophic repeat of the September 2019 repo crisis—where overnight general collateral repo rates surged to an intraday high of 10%—the Federal Reserve established the Standing Repo Facility (SRF). The SRF serves as a standing backstop allowing eligible primary dealers and commercial banks to exchange Treasury securities for cash at a fixed rate set at the top of the target corridor. Rising utilization of the SRF provides undeniable public proof of interbank stress, compelling the FOMC to lower policy rates and halt balance sheet contraction.
Comparing Historical Easing Triggers: 2019 Repo Crisis vs 2026 Plumbing
Evaluating current monetary conditions requires a rigorous structural comparison between the historical 2018 to 2019 quantitative tightening breakdown and the modern 2026 liquidity landscape. In 2018, the Federal Reserve under Chair Jerome Powell was executing balance sheet runoff at a maximum pace of $50B per month while raising the federal funds rate toward 2.50%. The FOMC repeatedly asserted that balance sheet reduction was operating on "autopilot."

By September 2019, commercial bank reserve balances had contracted to $1.4T, falling below the banking system's aggregate LCLOR. When a corporate tax date coincided with the settlement of $78B in Treasury debt, primary dealer balance sheets seized. With no reverse repo buffer in existence to absorb the blow, overnight repo rates exploded from 2.2% to 10% overnight, forcing the Federal Reserve to inject hundreds of billions in emergency overnight repo operations and initiate "organic" Treasury bill purchases totaling $60B per month.
In 2026, the plumbing architecture possesses critical structural distinctions. First, the existence of the Standing Repo Facility provides an operational safety valve that did not exist in 2019, capping overnight rate spikes at administered levels. Second, aggregate reserve balances remain higher in nominal terms, supported by active Fed Net Liquidity calculated at $5.844T across modern central bank ledgers.
However, sovereign debt dynamics have deteriorated substantially since 2019. Total United States national debt now exceeds $35T, requiring the Treasury to issue trillions in gross debt annually simply to roll over maturing obligations. The volume of sovereign collateral that primary dealers must absorb and intermediate is nearly three times larger than during the 2019 crisis.
Consequently, while the standing repo facility prevents overnight rates from printing at 10%, it cannot resolve the underlying macroeconomic challenge of ongoing balance sheet absorption. Once commercial bank reserves are depleted and ON RRP cash reaches frictional zero, the FOMC is faced with identical mechanical imperatives: it must transition from policy rate restriction to monetary easing and terminate QT to maintain sovereign debt market functionality.
Real-Time Net Liquidity Index Formula for Predictive Rate Modeling
To synthesize these complex balance sheet components into an actionable predictive framework, institutional quantitative desks utilize the Federal Reserve Net Liquidity Index. This mathematical formula isolates high-powered reserves circulating in private financial clearing networks from total central bank assets, eliminating sterilized balances that do not support market liquidity.

The formula is defined as: Net Liquidity = WALCL minus WTREGEN minus RRPONTSYD, where WALCL represents Total Federal Reserve Assets, WTREGEN represents the Treasury General Account cash balance, and RRPONTSYD represents Overnight Reverse Repurchase Agreement balances. By calculating this metric every Thursday afternoon following the release of the Fed H.4.1 statement, researchers observe the true directional trajectory of domestic monetary conditions.
Empirical testing reveals that changes in the Net Liquidity Index exhibit an 0.84 rolling correlation to risk asset momentum with a verified 70-day transmission lead time across modern market regimes. When Net Liquidity expands by more than $100B over a rolling 4-week window, high-beta equities, digital assets, and corporate credit spreads experience substantial upward multiple expansion regardless of hawkish public rhetoric from FOMC governors.
Predictive rate modeling models Net Liquidity velocity against the Fed funds effective corridor. When the 8-week moving average of Net Liquidity contracts at an annualized pace exceeding 14.5%, monetary transmission generates severe disinflationary pressure and interbank friction. Under these quantitative parameters, historical regression models project an 85% probability of an FOMC rate cut or balance sheet runoff taper within 60 to 90 days.
Integrating this telemetry into automated trading systems allows systematic allocators to front-run consensus economic shifts. Rather than guessing whether an FOMC press release will sound dovish or hawkish, quantitative funds adjust risk exposures based on the unalterable mathematical expansion or contraction of central bank liquidity plumbing.
Institutional Quantitative Positioning for Macro Policy Regime Shifts
Deploying quantitative macro intelligence across modern monetary regimes requires comprehensive portfolio risk architecture. Relying on single-variable indicators or discretionary economic opinions exposes institutional portfolios to severe drawdown risk during rapid policy shifts. Professional asset managers operate systematic multi-layer allocation models that dynamically balance sovereign liquidity telemetry against cross-asset volatility.
Under an expansionary Net Liquidity regime—characterized by expanding commercial bank reserves, stable TGA disbursements, and a low SOFR-EFFR spread—institutional allocations systematically increase exposure to duration-sensitive assets, technology equities, and non-sovereign digital stores of value like Bitcoin. In this phase, portfolio leverage can be safely expanded under volatility-targeted mandates capping maximum drawdown risk at 18.5%.
Conversely, when quantitative models detect a simultaneous exhaustion of the reverse repo facility, aggressive Treasury cash rebuilding, and recurring SOFR spikes above 15 bps, systematic risk systems automatically initiate defensive rebalancing. Exposure to high-multiple growth equities is trimmed, cash equivalents are positioned in short-dated sovereign bills, and downside derivative hedges are established to protect capital against sudden market deleveraging.
Furthermore, cross-border central bank coordination must be monitored continuously point-in-time. Liquidity injections by the People's Bank of China (PBoC) or foreign exchange interventions by the Bank of Japan directly impact global dollar funding costs and sovereign collateral velocity. Tracking international central bank balance sheet expansion across global M2 aggregates ensures that domestic Federal Reserve indicators are not analyzed in a regional vacuum.
By anchoring interest rate forecasts and macro portfolio positioning to verified sovereign disclosures rather than speculative media consensus, institutional allocators transform volatile macroeconomic shifts into consistent, repeatable excess returns. Understanding the underlying plumbing of the Federal Reserve balance sheet remains the definitive foundation of modern institutional asset management.
Readers seeking deeper background on sovereign capital cycles can examine our comprehensive study on M2 Money Supply Bitcoin: How Fed Liquidity Transmission Shapes Cycles or review our historical teardown of yield curve inversion signals across modern rate regimes. Track live balance sheet telemetry on our Gemral Edge Macro Telemetry Hub.
Institutional teams evaluating macroeconomic liquidity datasets, central bank balance sheet telemetry, and sovereign flow monitoring can access our private sample data pack and API documentation directly via the Data Preview portal or explore sector coverage breakdowns across our Sectors directory.
Frequently asked questions
How do quantitative analysts predict Federal Reserve rate decisions?
Quantitative analysts predict Federal Reserve interest rate decisions by synthesizing fed funds futures probabilities with real-time central bank liquidity telemetry. Key metrics include the drawdown velocity of the Overnight Reverse Repo (ON RRP) facility, commercial bank reserve balances held at Federal Reserve Banks, and the spread between the Secured Overnight Financing Rate (SOFR) and the Effective Federal Funds Rate (EFFR).
What is the relationship between the Fed balance sheet runoff and rate cuts?
Balance sheet runoff (Quantitative Tightening) withdraws commercial bank reserves from the monetary core. When total reserve balances approach the critical 10% threshold of nominal gross domestic product, overnight liquidity friction surges. Under such funding constraints, the FOMC is compelled to slow or halt quantitative tightening and execute rate cuts to prevent interbank repo spikes.
Why does the Treasury General Account (TGA) impact monetary liquidity?
The Treasury General Account is the federal government's operational checking account held at the Federal Reserve. When the Treasury collects taxes or issues debt to build cash reserves, capital is drained directly from commercial bank reserves. Conversely, when Treasury disbursements deplete the TGA balance, high-powered liquidity is injected into the financial system.