Politician Stock Tracker: Tracking Real-Time Capitol Hill Trades, STOCK Act Filing Delays, and Committee Portfolios
When lawmakers on Capitol Hill oversee trillions in federal spending while actively trading equities in the exact sectors they regulate, tracking their portfolio transactions becomes a critical discipline for institutional and retail investors. A modern politician stock tracker decodes public Periodic Transaction Reports to reveal trading patterns, disclosure latencies, and committee overlaps before policy shifts reshape broader capital markets.
How a Politician Stock Tracker Uncovers Capitol Hill Trading Patterns and STOCK Act Filings
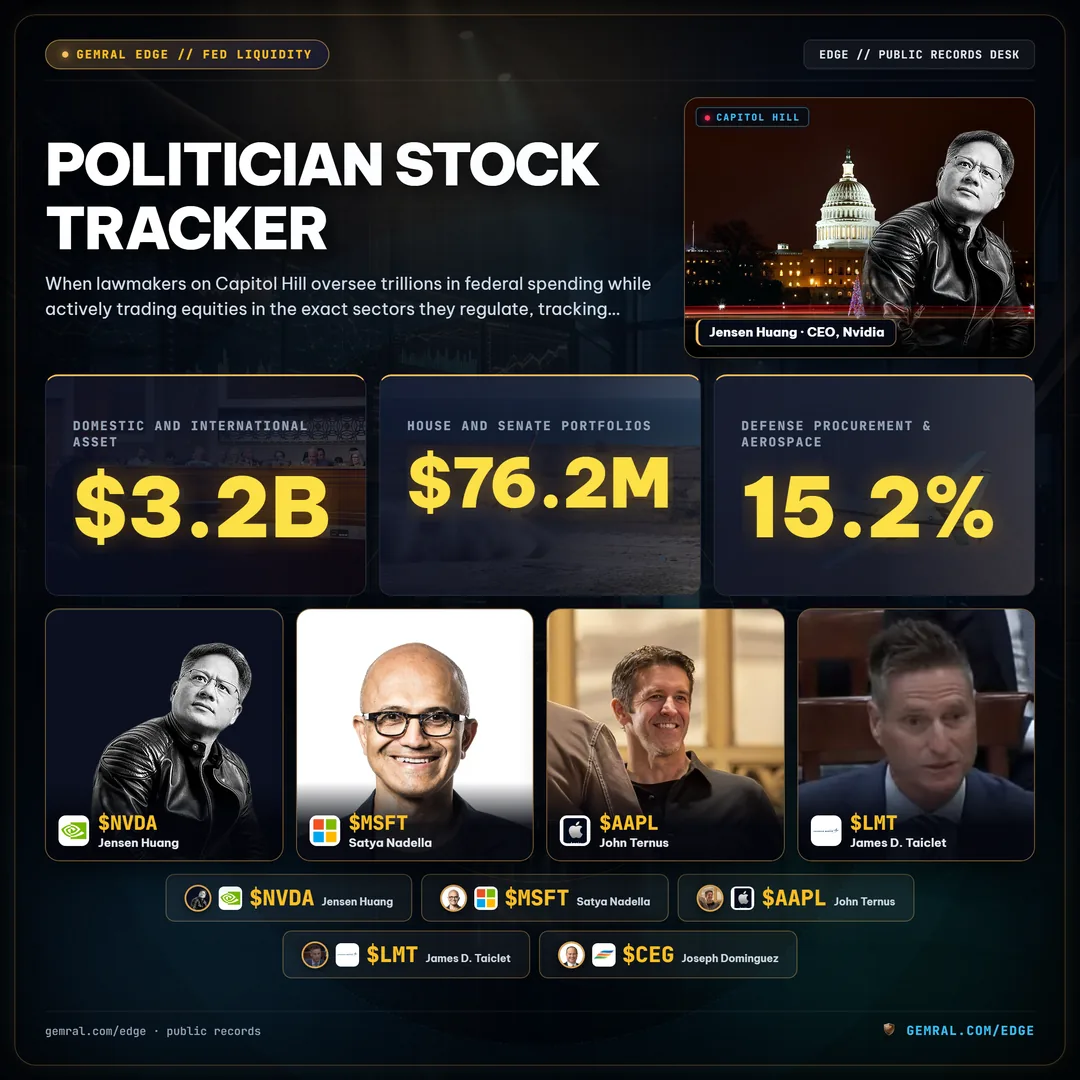
Public oversight of congressional financial activities entered a modern regulatory phase with the enactment of the Stop Trading on Congressional Knowledge Act of 2012, commonly known as the STOCK Act. Under this federal statute, all 535 voting members of Congress—comprising 435 Representatives in the House and 100 Senators—are legally bound to report any personal purchase, sale, or exchange of individual securities exceeding a $1,000 threshold. In an active calendar year, congressional disclosures capture approximately 11,240 individual transactions, representing an aggregate annual transaction volume exceeding $3.2 billion across domestic and international asset classes.
Despite statutory mandates designed to establish ethical parity with corporate insiders, accessing and analyzing these public filings remains historically fragmented. Lawmakers submit Periodic Transaction Reports (PTR) in unstructured PDF formats through the Office of the Clerk of the U.S. House of Representatives and the United States Senate Office of Public Records. A systematic politician stock tracker converts these disparate public filings into structured quantitative feeds, indexing transaction dates, reported value ranges ($1,001 to $15,000; $15,001 to $50,000; and upward of $5,000,000), and ownership structures including personal, spousal, and joint accounts. Investors seeking granular transaction histories by specific company can leverage the congressional ticker lookup tool to inspect trade cadence and committee exposure in real time. As detailed in our breakdown of congress stock tracker disclosures, retail copy-trading volumes often surge following high-profile committee hearings.
By categorizing trades into standardized transaction taxonomies, an algorithmic politician stock tracker enables analysts to differentiate between routine asset rebalancing and concentrated capital deployment. For instance, when multiple members across both chambers initiate coordinated accumulation in high-beta technology equities like NVIDIA (NVDA) or Microsoft (MSFT) ahead of major legislative appropriations, structured data tracking provides the earliest observable confirmation of legislative sentiment.
Measuring the Disclosure Gap: STOCK Act 45-Day Latency vs Real-Time Market Moves
The primary operational challenge facing retail copy-traders and quantitative market participants is the statutory disclosure lag inherent in the current regulatory framework. Under the 2012 STOCK Act, lawmakers must submit a completed PTR within 30 days of receiving notice of an executed transaction, subject to an ultimate statutory ceiling of 45 days from the actual trade execution date.

Empirical tracking across federal disclosure archives reveals that lawmakers rarely disclose transactions instantaneously. Across the entire congressional body, the median filing latency stands at 28 days, with the arithmetic average extending to 34 days between order execution on public exchanges and public ledger posting. Furthermore, historical compliance auditing shows a delinquent filing rate of 14.2%, where disclosures cross the statutory 45-day threshold without advance extension approval, incurring a nominal statutory late filing penalty of $200 that is frequently waived by ethics committees.
This substantial time buffer creates a distinct information asymmetry. By the time a member reports a $500,000 equity purchase in an advanced semiconductor designer or clean power utility, the underlying asset has often digested earnings releases, contract announcements, or subsidy appropriations. To overcome this friction, advanced tracking architectures employ disclosure latency scoring, calculating the historical filing speed of individual politicians. By weighting signals from lawmakers who consistently report within 5 to 7 days against those who exhaust the full 45-day window, algorithmic systems can extract actionable intelligence from newly published PTR filings without falling victim to stale pricing.
Committee Jurisdiction Overlaps: High-Volume Trading Sectors and Lawmaker Portfolios
The most consequential insight generated by a politician stock tracker is the mapping of individual lawmaker transactions against their legislative committee assignments. Members of Congress wield direct authority over federal appropriations, industrial subsidies, antitrust oversight, and military procurement contracts. When investment decisions align directly with committee jurisdiction, public transaction disclosures take on profound analytical significance.
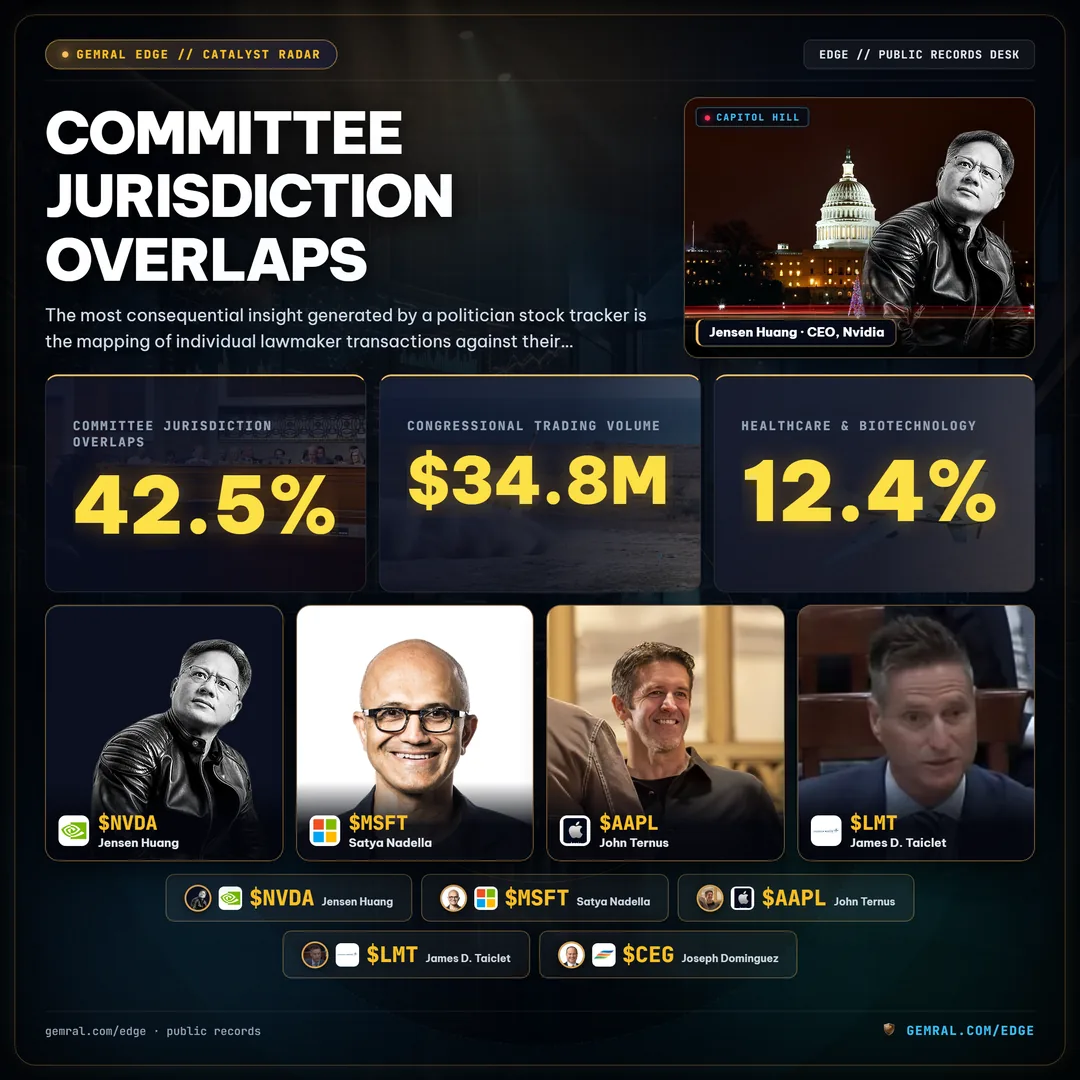
Sectoral concentration data indicates that congressional stock trading is heavily skewed toward specific industries:
- Information Technology & Semiconductors (42.5% of total volume): Dominated by liquid mega-cap equities including NVIDIA (NVDA) with $142.5 million in annual congressional trading volume, Microsoft (MSFT) commanding $98.4 million, and Apple (AAPL) generating $76.2 million across House and Senate portfolios. Members sitting on technology, commerce, and science subcommittees frequently maintain active exposure to artificial intelligence infrastructure and compute providers.
- Defense Procurement & Aerospace (15.2% of total volume): Key defense prime contractors such as Lockheed Martin (LMT) capture $34.8 million in congressional trading volume, alongside RTX Corporation and General Dynamics. Lawmakers assigned to the House Armed Services Committee and Senate Defense Appropriations Subcommittees routinely trade aerospace equities subject to multi-billion-dollar National Defense Authorization Act (NDAA) procurement packages.
- Energy Infrastructure & Nuclear Baseload (10.3% of total volume): As artificial intelligence data centers drive unprecedented electricity demand, public disclosures reveal surging congressional interest in clean energy and nuclear power providers like Constellation Energy (CEG), accounting for $29.5 million in disclosed trades, as energy committees advance nuclear regulatory modernization bills.
- Healthcare & Biotechnology (12.4% of total volume): Covering pharmaceutical developers and specialized medical technology firms undergoing Food and Drug Administration (FDA) clinical review cycles and Medicare price negotiation frameworks.
- Financial Services & Banking (19.6% of total volume): Encompassing regional banking institutions, payment network operators, and digital asset custodian platforms subject to Federal Reserve and SEC regulatory enforcement actions.
Cross-sectional studies demonstrate that approximately 31.8% of all congressional trades feature direct committee jurisdiction overlaps. In our multi-trail convergence audit comparing Congress trades with executive Form 4 filings, we observed that cluster buying by lawmakers often precedes corporate insider filings by several fiscal weeks. Tracking these occurrences allows market participants to identify regulatory inflection points well before formal legislative hearings or floor votes occur.
Algorithmic Politician Stock Tracker Systems and Quantitative Copy-Trading Strategies
The democratization of public financial disclosures has catalyzed the rise of automated copy-trading strategies built upon Capitol Hill filings. Rather than manually parsing the House Clerk’s document portal, modern quantitative traders deploy systematic data ingestion engines to construct dynamic politician sentiment indices.

A high-fidelity politician stock tracker processes public disclosures through a multi-stage data normalization pipeline:
- Document Ingestion & Parsing: Optical character recognition (OCR) and PDF parsing routines extract raw trade notifications, validating ticker symbols against public exchange registries and disambiguating common corporate parent entities.
- Latency & Volume Weighting: Each transaction is adjusted for disclosure lag (penalizing transactions disclosed past the 30-day mark) and transaction size (weighting $100,000 to $250,000 institutional-scale commitments significantly higher than entry-level $1,000 retail clips).
- Committee & Seniority Enrichment: Transactions are matched with congressional seniority, committee leadership roles (chair vs. ranking member), and active legislative dockets to calculate a composite conviction score.
- Portfolio Backtesting & Synthesis: Portfolios are modeled across equal-weighted and market-cap-weighted congressional baskets, benchmarking performance against the S&P 500 and sector-specific exchange-traded funds (ETFs).
Quantitative traders increasingly benchmark these signals against past transaction cohorts, such as our analysis of what Congress bought across periodic transaction disclosures, to separate persistent capital flows from transitory rebalancing trades. While historical copy-trading strategies have demonstrated notable outperformance in specialized sectors like artificial intelligence and national defense, systematic investors emphasize the importance of rigorous risk controls. Regulatory reform proposals—including potential statutory prohibitions on congressional trading—remain under active debate, making continuous monitoring of legislative disclosure mechanisms essential for maintaining a durable information edge.
By integrating statutory transparency records with automated data normalization, a politician stock tracker transforms disparate bureaucratic filings into a transparent window on political capital allocation, empowering investors to navigate modern markets with empirical clarity. Verified transaction archives and signals are available on gemral.com/edge/s/capitol-trades for ongoing public audit.
Frequently asked questions
What is a politician stock tracker and how does it work?
A politician stock tracker is a financial intelligence system that ingests public Periodic Transaction Reports (PTR) filed by members of Congress under the STOCK Act of 2012. It automatically extracts trade dates, asset descriptions, transaction types (purchases, sales, or exchanges), and estimated dollar brackets, allowing investors to evaluate lawmakers' trading behavior and portfolio performance across sectors.
Are members of the U.S. Congress legally allowed to trade individual stocks?
Yes. Under current federal law, members of Congress are permitted to buy, sell, and hold individual stocks, options, and corporate debt. However, under the 2012 STOCK Act, lawmakers and senior congressional staff are explicitly prohibited from trading on material non-public information derived from their legislative duties and must publicly report transactions within statutory disclosure deadlines.
What is the statutory filing deadline for congressional stock trades under the STOCK Act?
Under the STOCK Act of 2012 (Public Law 112-105), lawmakers must file a Periodic Transaction Report within 30 days of receiving notification of a completed transaction, and no later than 45 days after the trade execution date. In practice, the median disclosure latency across Capitol Hill is approximately 28 days.
How can retail investors use a politician stock tracker to monitor committee conflicts?
A politician stock tracker cross-references lawmaker stock purchases and sales with their specific committee assignments—such as the House Armed Services Committee, Senate Finance Committee, or House Energy and Commerce Committee. By observing when lawmakers purchase equities within industries directly regulated or funded by their committees, analysts can evaluate potential information asymmetries before major legislative or budgetary milestones occur.