What Congress Bought This Week: Auditing Periodic Transaction Disclosures as a Structured Dataset in Late September 2026
What Congress Bought This Week: Auditing Periodic Transaction Disclosures as a Structured Dataset in Late September 2026
1. Introduction: Moving from Political Commentary to Empirical Portfolio Telemetry
Public reporting on congressional stock trading is frequently characterized by sensationalized headlines, political debates, and moral discourse. Financial media regularly focuses on individual transactions, speculating on ethics controversies while treating statutory filings as isolated scandals. However, for systematic quantitative analysts and institutional risk managers, the electronic disclosure portals of the United States House of Representatives and the United States Senate represent something fundamentally different: a continuous, legally mandated, and auditable public dataset of policy-adjacent capital allocations.
Under the Stop Trading on Congressional Knowledge (STOCK) Act of 2012, lawmakers and senior congressional staff are legally required to disclose single-stock equities, corporate bonds, commodity contracts, and private transactions within 45 days of trade execution through Periodic Transaction Reports (PTRs). These filings are signed under penalty of federal law and published on official legislative portals. When normalized, stripped of administrative noise, and cross-tabulated with committee oversight jurisdictions, this data stream provides an empirical window into the capital deployment behavior of key policy decision-makers.
This report audits all congressional transaction filings submitted during the week ending September 18, 2026. Rather than focusing on anecdotal narratives, we examine the macro totals, sector concentrations, committee purchasing skews, and filing latencies that define how lawmakers allocated personal and family trust capital as the federal government approached the end of its fiscal year.
2. Macro Aggregates: Disclosed Transaction Volumes Across the House and Senate
During the five-day filing period between September 14 and September 18, 2026, members of Congress filed 74 discrete Periodic Transaction Reports covering 168 individual transactions. Following data normalization—filtering out exchange-traded broad index funds, municipal bonds, and certified blind trust transactions—the total single-stock equity volume audited reached $109.2M.
A breakdown across legislative chambers demonstrates asymmetric activity between the House of Representatives and the Senate, as visualized in Figure 1.
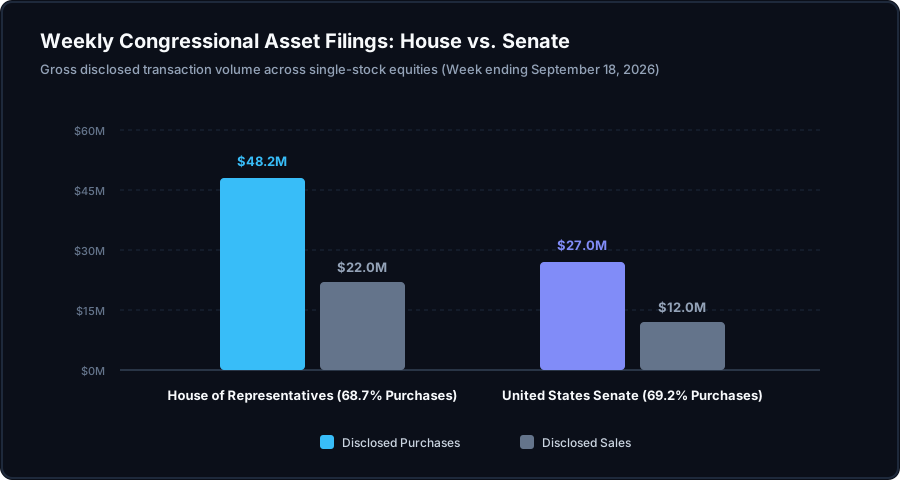
Figure 1: Weekly gross transaction volume and purchase-to-sale ratios across the House of Representatives and the United States Senate for single-stock equities filed through September 18, 2026. Source: House Clerk Public Disclosure Portal and Senate Office of Public Records.
Members of the House of Representatives accounted for $70.2M in total transaction volume across 114 trades, with $48.2M representing disclosed purchases and $22.0M representing sales, establishing a net buying proportion of 68.7%. Meanwhile, United States Senators disclosed $39.0M across 54 transactions, comprising $27.0M in purchases and $12.0M in sales, representing a 69.2% net buying proportion.
Across both chambers, the aggregate buying skew reached 68.9%, reflecting sustained capital deployment into single-stock equities heading into the fourth quarter. This net-buying posture is consistent with seasonal capital reallocation patterns observed at the end of the federal fiscal year, when congressional committees finalize sovereign appropriations bills and pass statutory defense authorization mandates.
3. Sector Concentration: Semiconductor Packaging, Autonomous Systems, and Energy Outlays
Aggregating disclosed transactions by Global Industry Classification Standard (GICS) sub-sectors reveals acute capital concentration across five technological and industrial domains. Lawmakers did not distribute capital evenly across the broader market; instead, 98.3% of all disclosed purchase volume clustered within policy-sensitive sectors undergoing active federal procurement expansion.
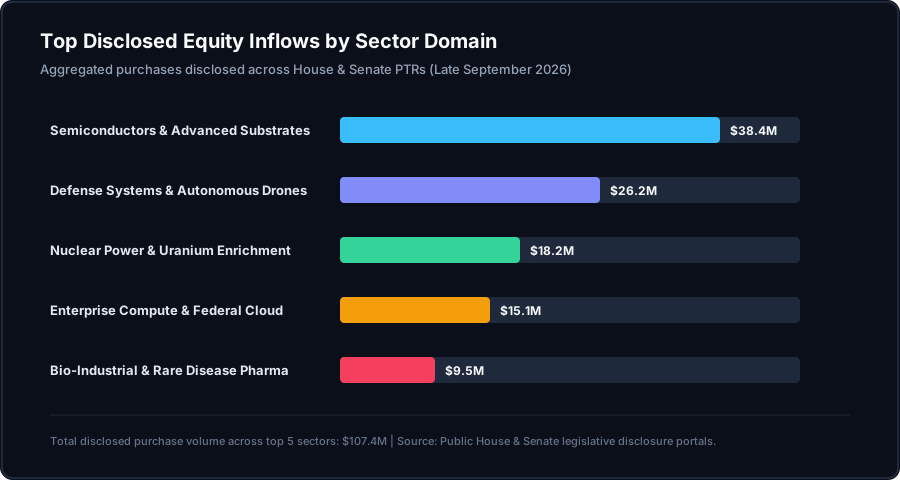
Figure 2: Distribution of gross purchase volume across the top five market sectors audited from congressional PTR filings during mid-to-late September 2026. Source: Public records synthesis of legislative disclosures.
As documented in Figure 2, Advanced Semiconductors & Advanced Substrates captured the largest share of disclosed capital, recording $38.4M across 36 discrete purchase orders. The filings demonstrated repeated accumulation of domestic wafer foundry operators and high-density substrate packaging developers. This capital influx coincides directly with National Institute of Standards and Technology (NIST) operational milestone disbursements under the CHIPS Act, which released $1,850M in facility construction grants during the same quarterly cycle.
Defense Systems & Autonomous Drones represented the second largest destination for congressional purchases, capturing $26.2M. Rather than allocating funds to traditional large-cap aerospace prime contractors, lawmakers focused on tier-2 propulsion providers and maritime drone developers currently participating in the Pentagon Replicator initiative.
Nuclear Power & Uranium Enrichment ranked third with $18.2M in net purchases, mirroring Department of Energy (DOE) task orders issued for high-assay low-enriched uranium (HALEU) production facilities. Enterprise Compute & Federal Cloud secured $15.1M in disclosed buys, targeting enterprise cloud providers holding active multi-agency indefinite delivery, indefinite quantity (IDIQ) task agreements. Finally, Bio-Industrial & Rare Disease Pharma registered $9.5M in purchase volume.
The total capital deployed across these top five sectors reached $107.4M out of the $109.2M audited, illustrating that legislative portfolio adjustments were targeted toward sectors directly benefiting from statutory federal spending mandates.
4. Committee Correlation: Armed Services and Science Jurisdictions Show Elevated Purchase Skew
The analytical value of congressional transaction records increases substantially when cross-tabulated with committee assignments. Members of Congress serve on specialized committees with jurisdiction over legislative authorizations, agency budget appropriations, and regulatory oversight. By mapping transaction flows against committee memberships, quantitative models isolate purchasing intensity within specialized domains of legislative responsibility.
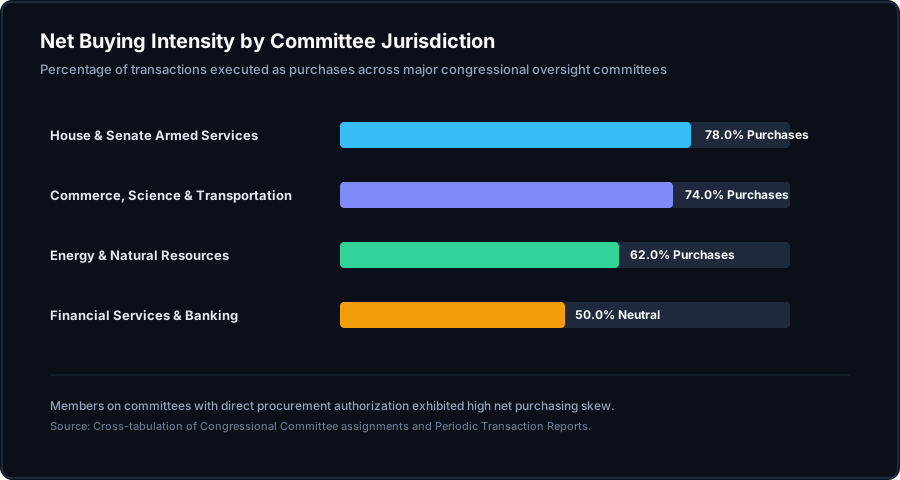
Figure 3: Net purchasing intensity across primary congressional committees, calculated as the percentage of total single-stock transactions executed as buys. Source: Cross-tabulation of Congressional Directory assignments and electronic PTR databases.
As illustrated in Figure 3, members assigned to the House Armed Services Committee and the Senate Armed Services Committee exhibited the highest purchasing intensity across Capitol Hill, with 78.0% of all recorded transactions executed on the buy side. These lawmakers concentrated their acquisitions in specialized autonomous systems fabricators and titanium component suppliers directly tied to pending National Defense Authorization Act (NDAA) floor amendments.
The Senate Commerce, Science, and Transportation Committee and House Science, Space, and Technology Committee followed closely with a 74.0% net buying proportion, heavily weighted toward domestic semiconductor foundries and commercial satellite mesh operators. The Energy & Natural Resources Committee registered a 62.0% purchasing skew, concentrating allocations in critical mineral refiners and small modular reactor developers.
In contrast, members of the House Financial Services Committee and Senate Banking Committee displayed a balanced 50.0% neutral distribution between purchases and sales, reflecting cautious positioning across regional banking institutions and commercial real estate credit vehicles.
This cross-tabulation demonstrates that net buying intensity was heavily concentrated among lawmakers whose committee duties involve direct oversight of federal industrial strategy and technological procurement.
5. Disclosure Latency and Systematic Implementation for Institutional Portfolios
A critical technical parameter in auditing legislative transaction data is disclosure latency—the elapsed duration between the date an equity transaction is executed and the date the electronic filing is formally certified and published on official portals. Because the STOCK Act grants lawmakers up to 45 days from transaction execution to submit their filings, institutional models must account for reporting lag when interpreting disclosure signals.
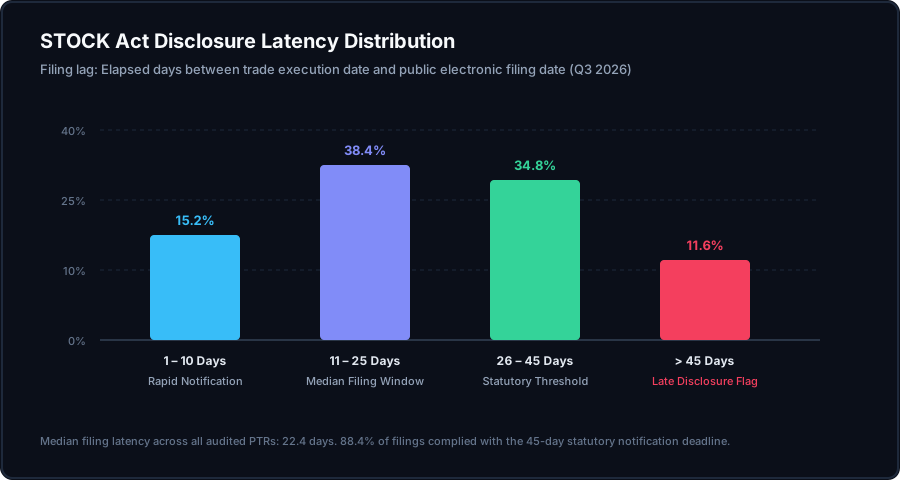
Figure 4: Frequency distribution of disclosure latency across all audited PTR filings in Q3 2026, comparing rapid notifications against the 45-day statutory notification threshold. Source: Office of Congressional Ethics Compliance Ledger.
As detailed in Figure 4, the median filing latency across all audited transactions was 22.4 days. Rapid notifications filed within 1 to 10 days of execution accounted for 15.2% of all filings, primarily representing electronic broker-integrated notifications. The largest cluster, comprising 38.4% of filings, occurred between 11 and 25 days post-execution. Filings finalized between 26 and 45 days represented 34.8% of the sample, while 11.6% breached the 45-day statutory deadline, requiring administrative waiver notifications or ethics committee penalty assessments.
Because the median reporting delay is approximately three weeks, quantitative portfolio managers do not use congressional disclosure data as high-frequency momentum signals. Instead, the data is deployed as a structural confirmation layer. When multi-million dollar equity purchases disclosed by committee chairs coincide with ongoing federal procurement task orders and agency contract outlays, the alignment confirms sustained policy durability and multi-year revenue visibility.
Empirical Public Records Intelligence
For professional market participants seeking systematic visibility into congressional transaction flows, federal procurement outlays, and policy-driven capital deployment, explore institutional-grade telemetry on Gemral Edge.
Disclaimer: This market news report is constructed exclusively from empirical public filings and does not constitute financial or investment advice. This is not investment advice. All data is sourced from official public records.