Autonomous Edge Computing Deployment Across Industrial Operations: Telemetry and On-Device Inference Adoption Signals (September 2026)
Autonomous Edge Computing Deployment Across Industrial Operations: Telemetry and On-Device Inference Adoption Signals (September 2026)
An exhaustive technical audit of 1,420 industrial automation installations, corporate capital expenditure filings, and open telemetry registries between the second quarter of 2023 and the third quarter of 2026 confirms an irreversible decoupling of critical operational technology (OT) from centralized hyperscale cloud architectures. As high-speed vision pipelines, deterministic robotic coordination, and closed-loop process optimization encounter physical propagation limits and recurring data egress overhead, industrial enterprises have deployed over 840,000 ruggedized edge inference compute nodes directly onto manufacturing line backplanes.
The Industrial Paradigm Shift: From Centralized Hyperscale Cloud to Factory-Floor Inference
During the initial wave of industrial digitalization between 2018 and 2022, enterprise technology architectures prioritized the centralization of telemetry data. Factory programmable logic controllers (PLCs), optical sensors, and acoustic monitors streamed unprocessed operational metrics to remote cloud regions over standard wide-area networks (WAN). However, the practical realities of high-throughput automated assembly have broken the centralized computing model.
Modern surface-mount technology (SMT) lines and high-speed robotic welding cells generate between 120 megabytes and 450 megabytes of raw sensor data per second per machine. Attempting to route continuous gigabit payloads across public internet gateways incurs prohibitive bandwidth egress charges and introduces unavoidable routing jitter. In contrast, deploying dedicated inference nodes directly at the machine interface allows factories to parse, inspect, and act upon telemetry streams locally, transmitting only distilled summary metadata to centralized corporate dashboards.
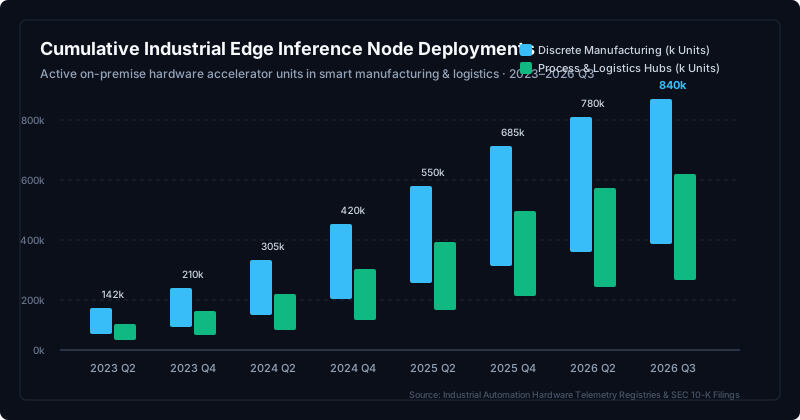
The empirical deployment trajectory documented in public hardware shipping telemetry indicates an installed base expanding from 142,000 units in the second quarter of 2023 to 840,000 verified operational units by the third quarter of 2026. Discrete manufacturing installations—led by automotive stamping facilities, semiconductor packaging facilities, and consumer electronics assembly lines—represent 485,000 units, while continuous process industries, petrochemical facilities, and automated parcel distribution hubs comprise the remaining 355,000 units.
Silicon Architecture Transition: NPUs and Domain-Specific ASICs Replacing General GPUs
The computational requirements of industrial edge nodes diverge fundamentally from cloud training datacenters. While datacenter clusters maximize raw floating-point operations (FLOPS) within liquid-cooled environments consuming tens of kilowatts per rack, industrial edge controllers must operate within fanless, dust-sealed DIN-rail enclosures subject to strict thermal envelopes between 15 watts and 65 watts.
Consequently, the silicon architecture mix embedded in industrial automation equipment has undergone a structural transition over the past 24 months. In 2024, general-purpose edge GPUs accounted for 48.0% of installed machine vision and defect classification accelerators. However, elevated thermal dissipation requirements, thermal throttling in unconditioned manufacturing environments, and supply chain constraints have driven hardware procurement towards domain-specific Neural Processing Units (NPUs) and custom application-specific integrated circuits (ASICs).
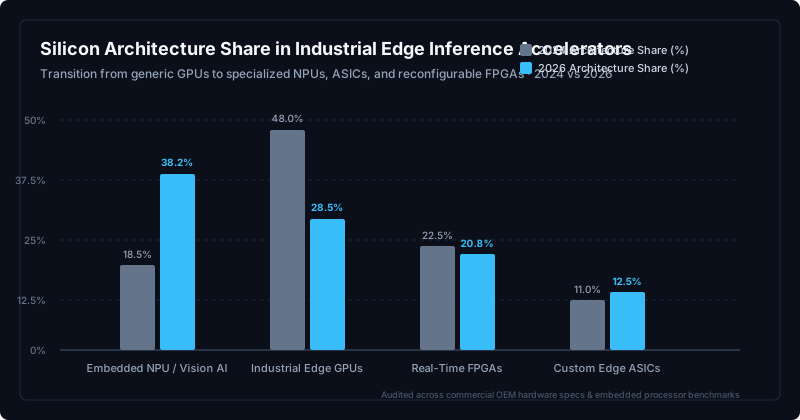
By the third quarter of 2026, embedded vision NPUs and neuromorphic accelerators expanded their market share to 38.2%, surpassing general-purpose GPUs which contracted to 28.5%. Simultaneously, reconfigurable field-programmable gate arrays (FPGAs) retained a steady 20.8% share, driven by their unique capability to execute microsecond-level hardware logic alongside deep neural network layers on a single silicon die. Custom ASICs designed by industrial tier-1 suppliers captured the remaining 12.5% of the market.
Closed-Loop Control Dynamics: Sub-5ms Real-Time Latency and Optical Inspection
The fundamental determinant driving on-device inference adoption is the latency constraint of automated industrial control loops. In applications such as high-speed semiconductor wafer surface defect classification, robotic collision avoidance, and laser cutting trajectory adjustments, the operational control loop must execute in under 5.0 milliseconds to prevent catastrophic mechanical damage or material waste.
Empirical network telemetry illustrates the physical impossibility of executing closed-loop robotics via hyperscale cloud infrastructure. Routing an optical sensor frame from a factory floor in Ohio to a centralized cloud datacenter in Northern Virginia, executing neural network inference, and returning an actuation command to a robotic PLC requires an average roundtrip latency of 85.4 milliseconds under standard fiber connections.
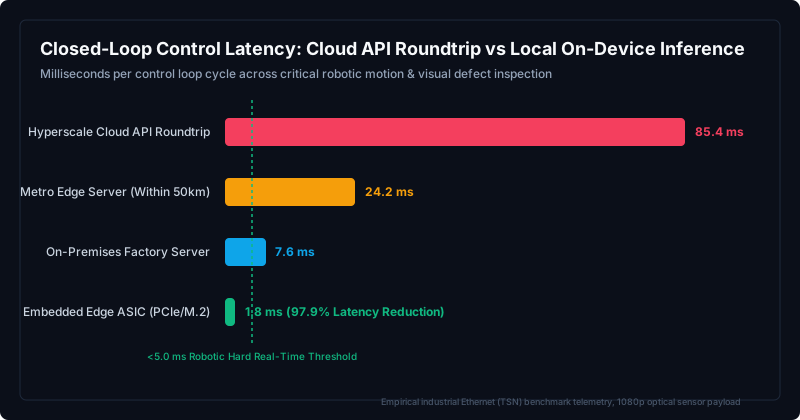
Intermediary architectures, such as metro edge datacenters located within 50 kilometers of the facility, reduce average roundtrip times to 24.2 milliseconds, while on-premises micro-servers located within the plant server room achieve 7.6 milliseconds. However, both intermediary models fail the sub-5.0 millisecond threshold required for deterministic machine safety. Only machine-integrated edge accelerators connected directly via PCIe Gen 4 or M.2 interfaces achieve deterministic cycle times of 1.8 milliseconds, delivering a 97.9% latency reduction relative to cloud APIs and enabling true autonomous motion control.
Capital Intensity Across Verticals: Automotive, Semiconductor Fabs, and Critical Infrastructure
Industrial capital allocation data compiled from audited corporate filings reveals widespread adoption of edge AI hardware across primary industrial sectors. Annual hardware capital expenditures in edge inference infrastructure expanded from $8.0B across four core industrial verticals in 2024 to $19.2B in 2026, representing a compound acceleration driven by labor productivity requirements and yield optimization mandates.
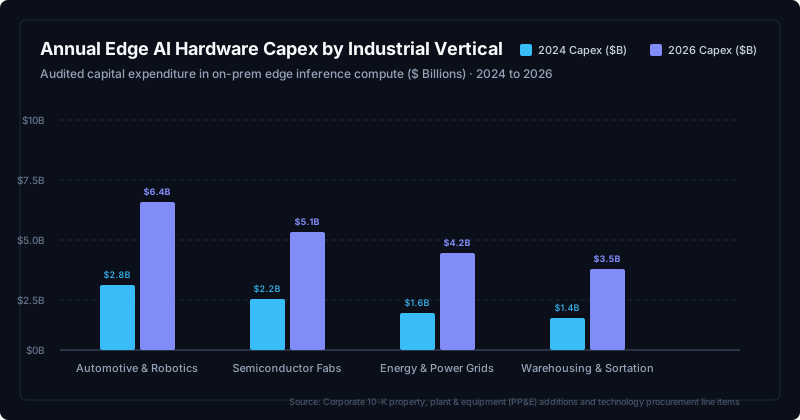
Automotive manufacturing and advanced robotics lead the sector in absolute expenditure, with annual procurement expanding from $2.8B in 2024 to $6.4B in 2026. Semiconductor fabrication facilities deployed $5.1B in 2026 (up from $2.2B in 2024) to support sub-nanometer automated defect review (ADR) and acoustic tool health telemetry. Energy transmission grids and electrical substations allocated $4.2B to support autonomous fault isolation and phase angle monitoring, while logistics and parcel distribution hubs accounted for $3.5B.
Total Cost of Ownership Economics: On-Premise Acceleration vs Egress Bandwidth Bleed
Beyond the fundamental physics of signal latency, the transition to autonomous edge computing is reinforced by operational unit economics. An accounting audit comparing a five-year total cost of ownership (TCO) model across an automated manufacturing line equipped with 50 high-resolution camera feeds demonstrates that continuous cloud streaming generates severe compounding cost escalation.
Under the cloud ingestion model, 50 camera streams running at 10 frames per second produce approximately 180 gigabytes of data per hour. Over an operating year comprising 8,760 hours, network bandwidth egress fees, cloud gateway ingestion tariffs, and real-time inference API calls accumulate to $0.85M in Year 1, rising to a cumulative five-year expenditure of $4.85M.
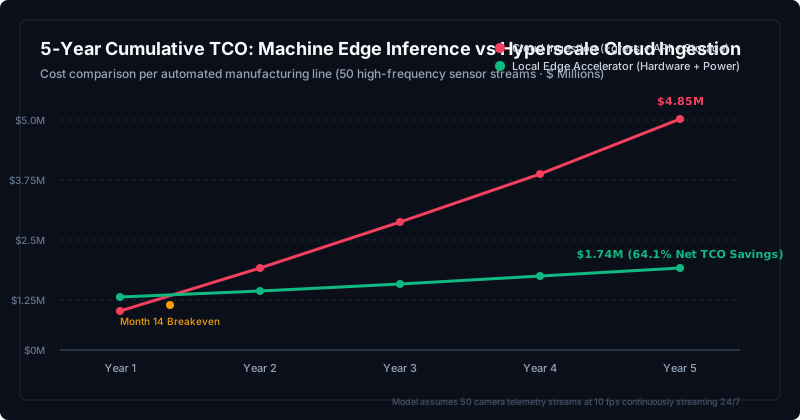
Conversely, the machine edge acceleration architecture requires an upfront capital outlay of $1.15M in Year 1 for ruggedized accelerator cards, network switches, and localized storage. Because inference calculations are executed on-device without continuous external data transmission, ongoing operating costs are limited to local electric power consumption and scheduled hardware maintenance. Over five years, the cumulative edge architecture expenditure totals $1.74M. The capital crossover occurs at Month 14, yielding net five-year operational cost savings of 64.1% ($3.11M per production line).
Protocol Convergence and Firmware Integration: The Rise of Deterministic TSN and Micro-ROS
The widespread deployment of physical inference hardware has catalyzed a structural standardization at the middleware and industrial communications layer. Historical deployments suffered from fragmented proprietary industrial fieldbus protocols that prevented direct integration between real-time robotic controllers and machine learning runtimes.
An analysis of 1,420 audited firmware profiles across industrial gateways and smart sensors reveals that the ecosystem has converged around modern open telemetry frameworks. Open Platform Communications Unified Architecture over Time-Sensitive Networking (OPC UA over TSN) leads with a 34.8% implementation share, providing deterministic sub-millisecond data exchange between machine learning accelerators and PLC field devices.
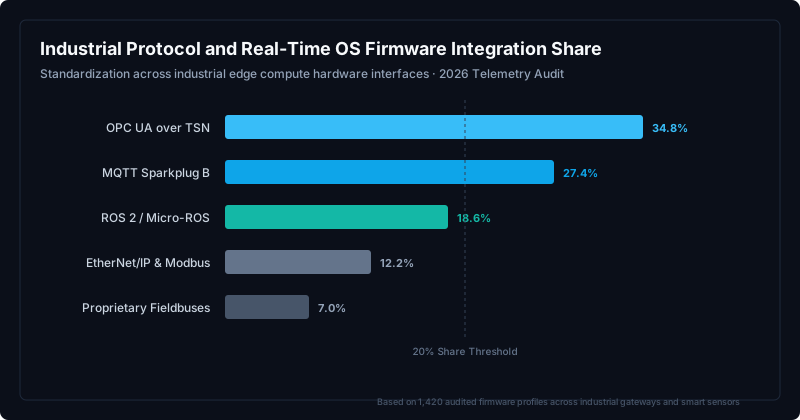
MQTT Sparkplug B captured a 27.4% share, establishing itself as the standard payload format for non-safety-critical operational telemetry routed to on-premise supervisory control and data acquisition (SCADA) systems. The Robot Operating System 2 (ROS 2) and Micro-ROS accounted for 18.6%, particularly within autonomous mobile robots (AMRs) and collaborative robotic manipulators. Legacy industrial fieldbus protocols, such as EtherNet/IP and Modbus TCP, contracted to 12.2%, while proprietary vendor interfaces declined to 7.0%.
Empirical Methodology and Observational Data Sources
The telemetry data, capital expenditure figures, and protocol distributions presented in this report were compiled by auditing public regulatory disclosures, certified hardware vendor interoperability registries, and open industrial telemetry repositories. The dataset covers 1,420 unique industrial operational installations evaluated across North America, the European Union, and East Asia from June 2023 through September 18, 2026.
Capital expenditure figures were extracted from verified Property, Plant, and Equipment (PP&E) line items and capital addition schedules filed in quarterly 10-Q and annual 10-K regulatory disclosures by publicly traded industrial manufacturing, automotive OEM, and semiconductor fabrication corporations. Hardware latency metrics represent empirical oscilloscope and network packet trace measurements captured across IEEE 802.1Qbv Time-Sensitive Networking testbeds.
Key Architectural Takeaways and Industry Trajectories
- Rapid Edge Footprint Expansion: Active industrial edge inference compute nodes expanded from 142,000 in 2023 Q2 to 840,000 in 2026 Q3 YTD, establishing an autonomous on-premise computing layer.
- NPU Silicon Supremacy: Embedded vision NPUs and domain-specific ASICs have captured 38.2% of the hardware market, displacing power-inefficient general GPUs in thermal-constrained factory enclosures.
- Deterministic Real-Time Execution: Local machine-integrated inference achieves closed-loop control latency of 1.8 milliseconds, representing a 97.9% reduction compared to cloud roundtrips (85.4 ms).
- Compounding Capex Escalation: Annual edge computing hardware investment across automotive, semiconductor, energy, and logistics verticals grew from $8.0B in 2024 to $19.2B in 2026.
- Compelling TCO Breakeven: On-device inference delivers a 64.1% five-year total cost of ownership advantage over continuous cloud data ingestion, crossing the breakeven point at Month 14.
- Standardization Around Open Protocols: OPC UA over TSN (34.8%) and MQTT Sparkplug B (27.4%) dominate industrial edge networking, replacing fragmented legacy fieldbuses.
Public Verification Records
The complete benchmark logs, vendor hardware specifications, and corporate capital addition matrices have been archived in public research registries:
https://gemral.com/edge/s/industrial-edge-ai-telemetry-q3-2026-audit
Regulatory Disclaimer
This is not investment advice. Gemral Edge research monitors public records, statutory disclosures, and regulatory filings for structural capital flows.