Defense Contractors by Market Cap: Mapping Valuation Multiples, Backlogs, and Federal Contract Obligations
A comprehensive public record ranking of the largest aerospace and defense primes alongside emerging defense tech pure-plays, evaluating market valuation multiples, funded backlog coverage, and statutory procurement velocity.

As geopolitical friction drives global security appropriations toward historic records, institutional equity desks systematically rank defense contractors by market cap to understand where capital concentrates across the defense industrial base. The valuation landscape reflects a sharp bifurcation: multi-decade franchise aerospace primes trade at single-digit to low double-digit cash flow multiples underpinned by multi-year programmatic order books, while high-growth autonomous technology pure-plays command premium software-like enterprise multiples.
Evaluating the defense industrial base requires reconciling publicly disclosed enterprise market capitalizations against statutory Department of Defense appropriations and procurement pipelines. Institutional researchers monitor federal contract velocity through our comprehensive federal contract database, cross-referencing daily award modifications against historical backlog conversion rates alongside our teardowns of drone companies with government contracts and broader research on companies with government contracts.
Defense Contractors by Market Cap: The 2026 Prime and Pure-Play Hierarchy
The public equity defense market structure is stratified into established tier-one prime systems integrators and specialized mid-cap technology developers. At the pinnacle of the market capitalization leaderboard, RTX Corporation (NYSE: RTX) commands a market cap of approximately $168 billion with an enterprise value exceeding $205 billion. RTX anchors critical national security architecture across Raytheon missile systems, Pratt & Whitney military jet engines, and Collins Aerospace avionics. Its total order backlog stands at an unprecedented $202 billion, providing more than 2.7 years of forward revenue visibility across commercial aerospace and defense programs.

Following RTX, Lockheed Martin (NYSE: LMT) maintains a market capitalization of approximately $138 billion. Lockheed Martin serves as the Pentagon's single largest supplier, driven by the Fifth-Generation F-35 Lightning II joint strike fighter program, PAC-3 Patriot missile interceptors, Aegis Combat Systems, and the classified Skunk Works advanced development division. Lockheed Martin's total backlog surpasses $165 billion, representing a backlog-to-revenue ratio of approximately 2.4x.
General Dynamics (NYSE: GD), valued at approximately $82 billion, dominates sea and land combat dominance platforms. As the primary builder of the U.S. Navy's Columbia-class ballistic missile submarines and Virginia-class fast-attack submarines through its Electric Boat subsidiary, alongside M1A2 Abrams main battle tanks, General Dynamics holds an order book of $93 billion. Northrop Grumman (NYSE: NOC), with a market cap of approximately $76 billion and an $85 billion backlog, represents the premier provider of strategic deterrence platforms, including the newly revealed B-21 Raider stealth bomber, the Sentinel intercontinental ballistic missile program, and high-altitude autonomous intelligence platforms.
Rounding out the top tier, L3Harris Technologies (NYSE: LHX) holds a market cap of approximately $47 billion. Following its strategic acquisition of Aerojet Rocketdyne, L3Harris has become the indispensable merchant supplier of solid rocket motors, tactical radios, and electronic warfare suites, supporting a company-wide backlog of $33 billion.
Revenue Multiples and Backlog Coverage Ratios Across the Defense Sector
Valuing defense primes requires examining the stability of statutory revenue backlogs relative to enterprise value. Unlike commercial tech corporations whose revenue visibility fluctuates with quarterly consumer demand, top defense contractors operate under Congressionally mandated multi-year procurement programs.
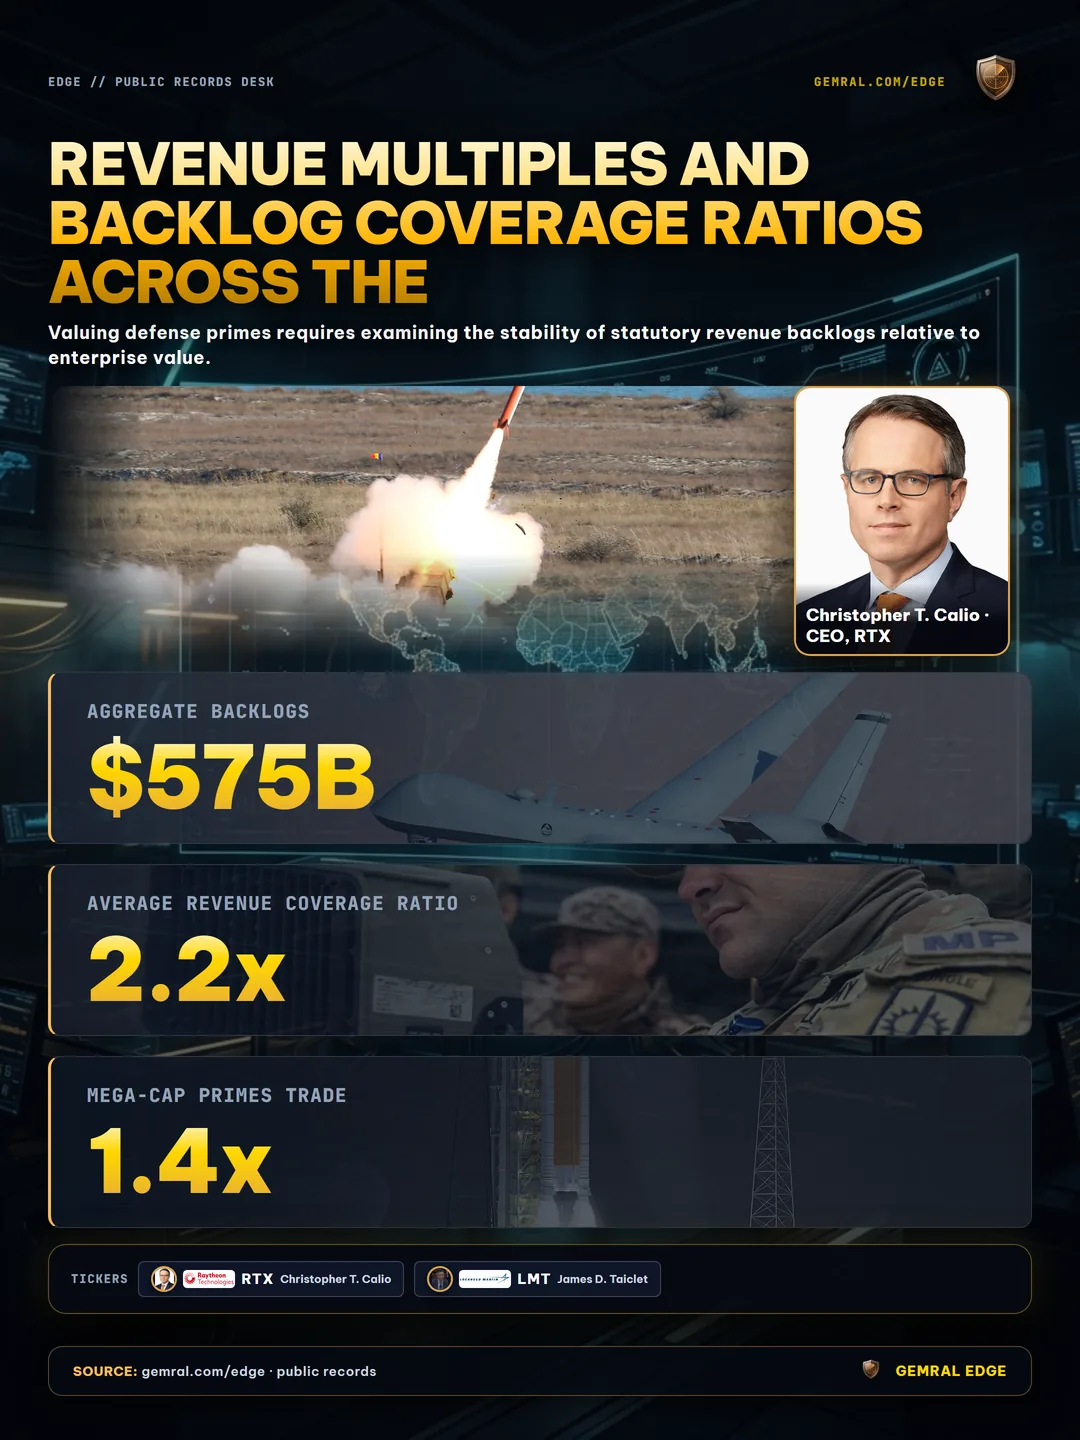
Across the top five defense primes (RTX, LMT, GD, NOC, LHX), aggregate backlogs exceed $575 billion. This statutory backlog provides an average revenue coverage ratio of 2.2x annual sales. Valuation multiples across the mega-cap group reflect this utility-like predictability:
- Enterprise Value to Sales: Mega-cap primes trade between 1.4x and 2.1x EV/Sales, reflecting regulated operating margins capped between 9% and 12% by Federal Acquisition Regulation (FAR) cost-accounting standards.
- EV to EBITDA Multiples: The peer group trades at an average forward EV/EBITDA of 13.4x, with General Dynamics and Lockheed Martin historically commanding defensive premiums due to high free cash flow conversion and consistent dividend growth.
- Backlog Quality and Milestone Velocity: Contract structures have increasingly shifted away from cost-plus-award-fee toward fixed-price development, increasing initial execution margin pressure while offering measurable margin expansion during high-rate full production.
Progress payments and milestone obligations tracked through statutory award disclosures provide early indication of cash flow generation before quarterly financial statements reflect completed deliveries.
Top 5 Defense Contractors by Market Cap vs High-Growth Pure-Play Defense Tech
While the top five aerospace primes capture the bulk of total Pentagon outlays, institutional capital has increasingly rotated into agile pure-play defense technology contractors. These emerging innovators trade at substantially higher valuation multiples due to accelerated organic growth trajectories.

AeroVironment (NASDAQ: AVAV) illustrates this market multiple expansion. With a market capitalization of approximately $5.8 billion, AeroVironment trades at an EV/Sales multiple of 6.8x—more than triple the multiple of diversified primes. Investors award this valuation premium because AeroVironment commands a virtual monopoly in organic tactical loitering munitions through the Switchblade 300 and Switchblade 600 platforms, bolstered by an active $990 million Army IDIQ contract ceiling and priority positioning within the Pentagon's Replicator autonomy initiative.
Similarly, Kratos Defense & Security Solutions (NASDAQ: KTOS), with a market capitalization of $3.5 billion, trades at an EV/Sales multiple of 3.1x. Kratos specializes in high-subsonic jet target drones and jet-powered collaborative combat aircraft (CCA) such as the XQ-58A Valkyrie. While legacy primes manufacture exquisite multi-million dollar platforms, pure-play defense tech firms target attritable mass: low-cost, expendable autonomous systems deployed in large quantities. This creates a distinct financial profile characterized by shorter product development cycles, rapid inventory turns, and dynamic production scalability.
Tracking Federal Award Obligations and Subcontracting Disclosures
For quantitative researchers and equity research desks, relying solely on lagging quarterly SEC Form 10-K and 10-Q filings creates an informational blind spot. By the time a defense prime formally reports expanded backlog in quarterly disclosures, the underlying contract awards have been public knowledge for weeks or months.
Systematic institutional tracking relies on point-in-time public record ingestion:
- Daily Pentagon Procurement Disclosures: Federal law requires the Department of Defense to publicly disclose every contract action valued at $7.5 million or higher on each business day at 17:00 EST.
- Subsidiary-to-Ticker Entity Resolution: Federal obligations are rarely awarded directly to a corporate parent ticker. Contracts flow to operating entities like Sikorsky Aircraft, Pratt & Whitney Military Engines, or Electric Boat Corporation, requiring strict point-in-time parent equity linkage.
- PSC and NAICS Classification: Filtering transaction records by Product and Service Codes—such as PSC 1510 (Fixed Wing Aircraft), PSC 1410 (Guided Missiles), and PSC 1550 (Unmanned Aircraft)—allows analysts to quantify demand shifts toward unmanned autonomy and missile replenishment.
- Subcontractor Cascades: Prime awards frequently mandate statutory subcontracting allocations, signaling forward revenue pipelines for tier-two and tier-three specialized component suppliers before formal partnership press releases.
By continuously tracking and aggregating these disparate federal award records, institutional analysts quantify real-time obligation velocity, monitor procurement concentration across primes, and identify shifts in the defense capital expenditure cycle.
Regulatory Disclaimer & Public Transparency Notice
Public data · not investment advice. All market capitalization figures, backlog disclosures, and federal procurement obligations cited in this report are sourced from official public records maintained by the Department of Defense, Securities and Exchange Commission, and federal procurement databases. Gemral Edge provides systematic public record aggregation, entity resolution, and policy telemetry for quantitative research desks. Institutional data feeds and API access are available through our Edge Data Plans ($39 Pro, $299 B2B, $2000 API).
Frequently asked questions
What are the largest U.S. defense contractors by market cap?
The largest publicly traded U.S. defense contractors by market capitalization are RTX Corporation (NYSE: RTX, ~$168B), Lockheed Martin (NYSE: LMT, ~$138B), General Dynamics (NYSE: GD, ~$82B), Northrop Grumman (NYSE: NOC, ~$76B), and L3Harris Technologies (NYSE: LHX, ~$47B).
How does funded backlog relate to defense contractor market cap?
Funded and statutory contract backlog provides forward revenue coverage, typically ranging from 2.0x to 2.7x annual sales for mega-cap primes. A high backlog-to-revenue ratio insulates defense contractors from macro volatility and supports resilient free cash flow conversion.
Why do pure-play defense tech contractors trade at higher valuation multiples than primes?
Pure-play contractors like AeroVironment (AVAV, ~6.8x EV/Sales) focus on rapid-growth uncrewed aerial systems, loitering munitions, and software-defined autonomy. Investors award premium multiples due to accelerated procurement adoption under Pentagon initiatives like Replicator compared to mature capital equipment programs.
How can institutional analysts track federal defense contract awards before earnings?
Federal contract obligations are published daily by the Department of Defense at 17:00 EST and documented via public procurement award records. Systematically aggregating these disclosures and mapping subsidiary awards back to parent tickers enables point-in-time revenue tracking before quarterly 10-Q filings.