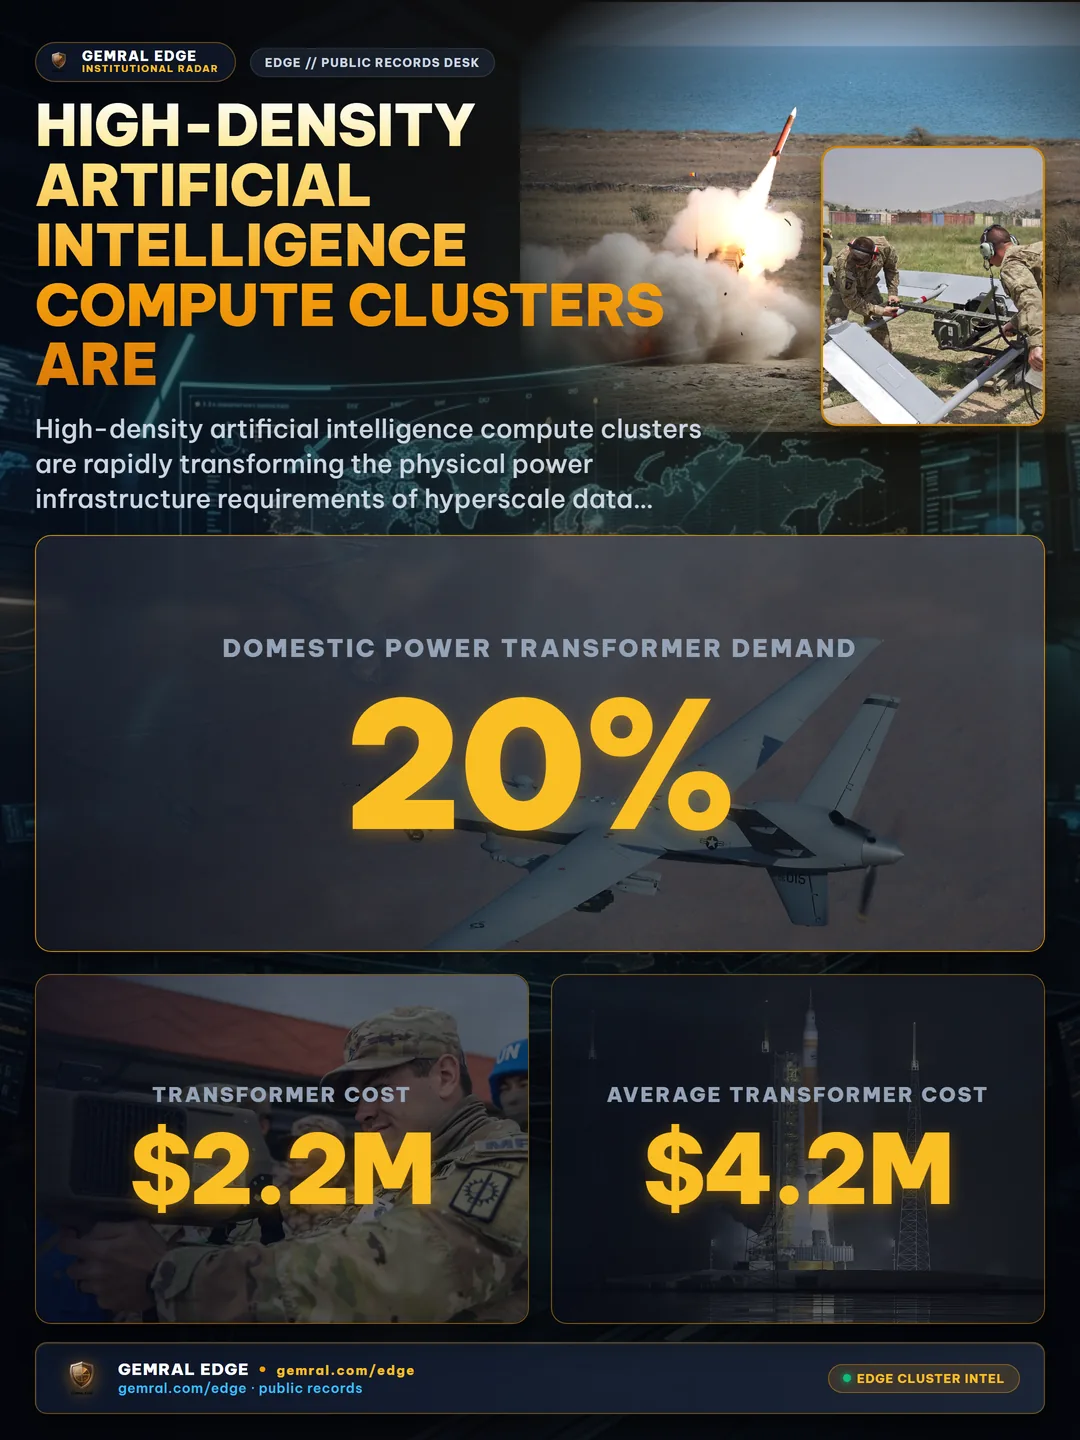
High-density artificial intelligence compute clusters are rapidly transforming the physical power infrastructure requirements of hyperscale data centers. Where enterprise cloud facilities once drew 20 MW to 40 MW from local utility distribution feeders, modern accelerated computing campuses routinely demand 100 MW to over 500 MW per site. At this unprecedented scale, direct connection to local municipal distribution lines becomes physically impossible, forcing operators to engineer dedicated on-site substations that interface directly with bulk high-voltage transmission networks.
Dedicated Data Center Substations: Why AI Computing Demands High-Voltage Transmission Yards
A data center substation is a specialized high-voltage electrical installation situated on or immediately adjacent to a computing campus. Its primary operational function is stepping down bulk electrical transmission voltages down to intermediate medium voltages that can be distributed safely across campus buildings and server halls.
Regional bulk transmission lines transport electricity over long distances at extra-high voltages, typically 115 kV, 230 kV, or 500 kV. These elevated voltages minimize line losses across hundreds of miles of transmission towers. However, computer server power supply units operate at low utilization voltages, such as 415V three-phase or 480V distributions. Distributing hundreds of megawatts at low voltage would require copper conductors of unmanageable physical thickness due to electrical resistance and thermal dissipation constraints.
The dedicated on-site substation acts as the critical bridge between regional grid transmission lines and server racks. Incoming 115 kV or 230 kV transmission feeds enter the utility switchyard through high-voltage circuit breakers and disconnect switches. The electricity passes into Large Power Transformers (LPTs), which step down the transmission voltage to medium-voltage distribution circuits operating at 34.5 kV or 13.8 kV. These medium-voltage feeders route power underground through concrete encased duct banks into on-campus electrical rooms, where secondary step-down transformers drop the power to 415V or 480V for uninterruptible power supply (UPS) lineups and power distribution units (PDUs).
When hyperscale campuses scale from 100 MW to 300 MW or 500 MW, local utility distribution networks cannot absorb the load. A standard municipal distribution circuit carries between 10 MW and 30 MW. Supplying a single 300 MW AI data center without a dedicated substation would require stringing dozens of separate distribution circuits from distant utility substations, creating severe grid congestion and voltage instability for neighboring communities. By constructing a dedicated on-site high-voltage substation, the data center taps directly into bulk transmission corridors, establishing a robust and dedicated power gateway.
Utility Interconnection Queues: Navigating Transmission Backlogs Across Major Grid Operators
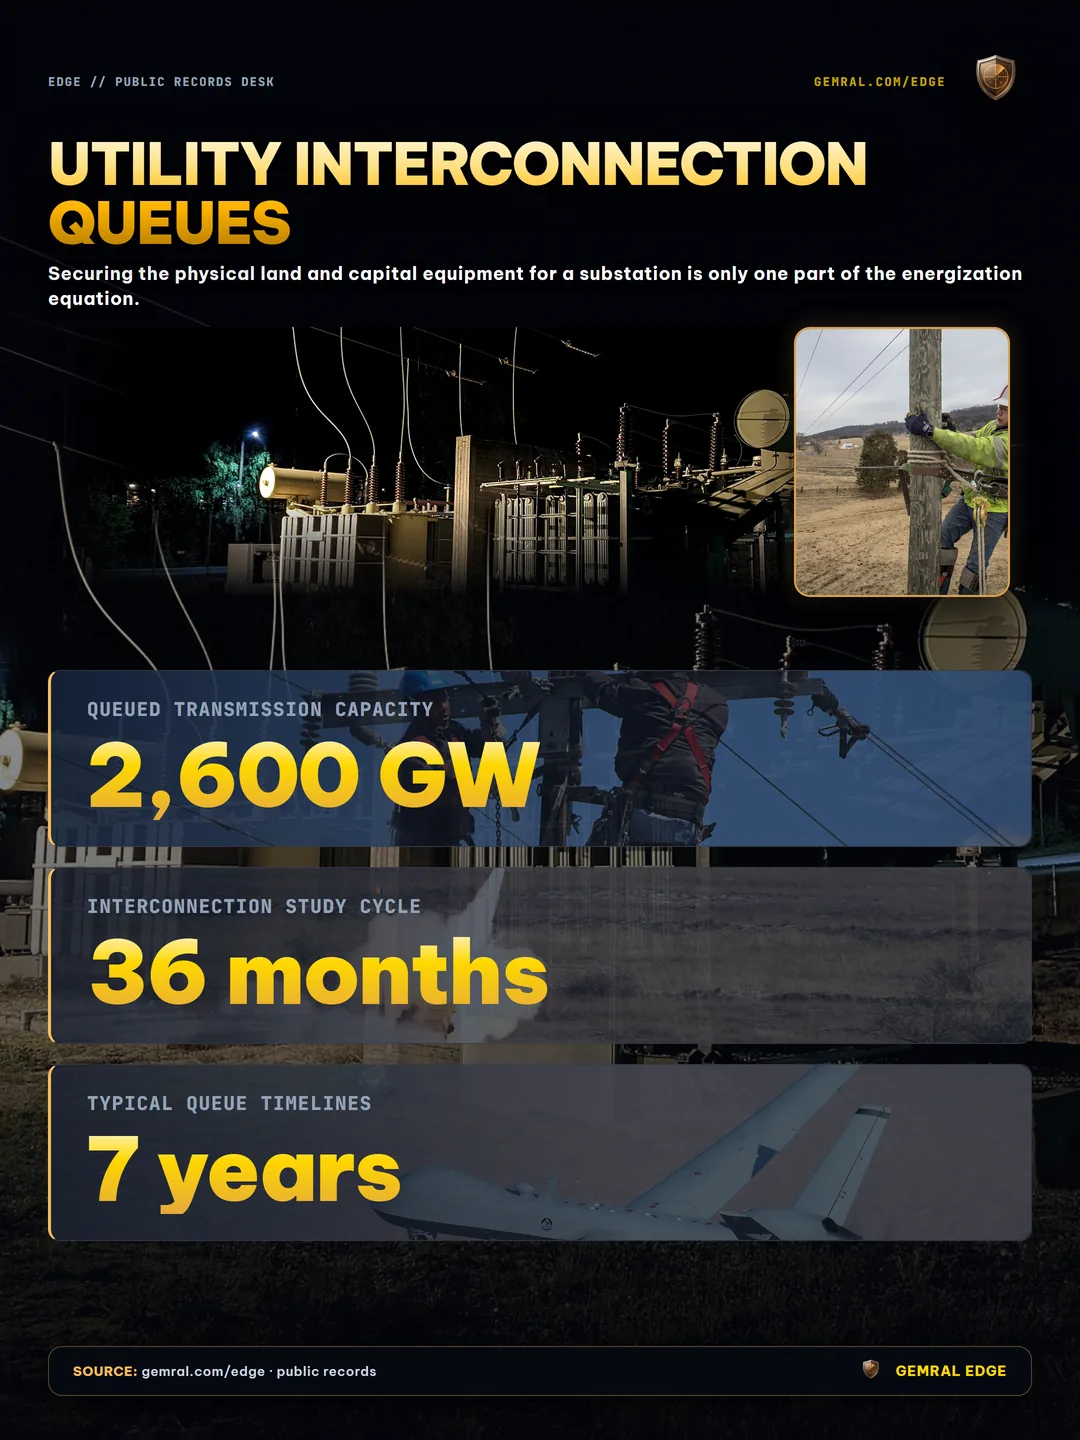
Securing the physical land and capital equipment for a substation is only one part of the energization equation. The primary timeline bottleneck facing data center development across North America is the regional utility transmission interconnection queue.
Before an operator can connect a 100 MW or 300 MW substation to the regional transmission grid, the regional transmission organization (RTO) or independent system operator (ISO) must conduct rigorous engineering studies. These studies evaluate whether adding the requested load will cause thermal overloads on existing transmission circuits, degrade grid voltage stability, or violate regional reliability criteria under peak demand conditions.
Across major US transmission jurisdictions—including PJM Interconnection in the mid-Atlantic, the Electric Reliability Council of Texas (ERCOT), and the Midcontinent Independent System Operator (MISO)—interconnection queues face historic backlogs. Nationally, more than 2,600 GW of combined generation, battery storage, and large load requests currently sit in transmission study queues.
Historically, completing the interconnection study cycle took between 24 to 36 Months. As the volume of large load interconnection requests accelerated alongside generation retirements, typical queue timelines stretched to 5 to 7 Years (60 to 84 months). An interconnection filing moves through three primary evaluation phases: the preliminary System Impact Study (SIS), the definitive Facilities Study (FS), and the final Interconnection Agreement (IA).
Even after an Interconnection Agreement is executed, the utility must often construct extensive network upgrades. These upgrades frequently include reconductoring miles of high-voltage transmission lines, adding breaker positions at regional utility switching stations, and installing synchronous condensers to maintain grid inertia. Consequently, an operator who purchases land today may face an interconnection lead time exceeding 72 Months before high-voltage utility breakers can be closed to energize the on-site substation.
High-Voltage Transformer Lead Times: The Critical Equipment Bottleneck in Power Delivery
Beyond transmission study backlogs, data center developers face an acute supply chain constraint: procurement lead times for high-voltage Large Power Transformers (LPTs). These custom-engineered machines, typically rated between 50 MVA and 120 MVA for data center substation applications, convert transmission voltages of 115 kV or 230 kV down to 34.5 kV distribution feeds.
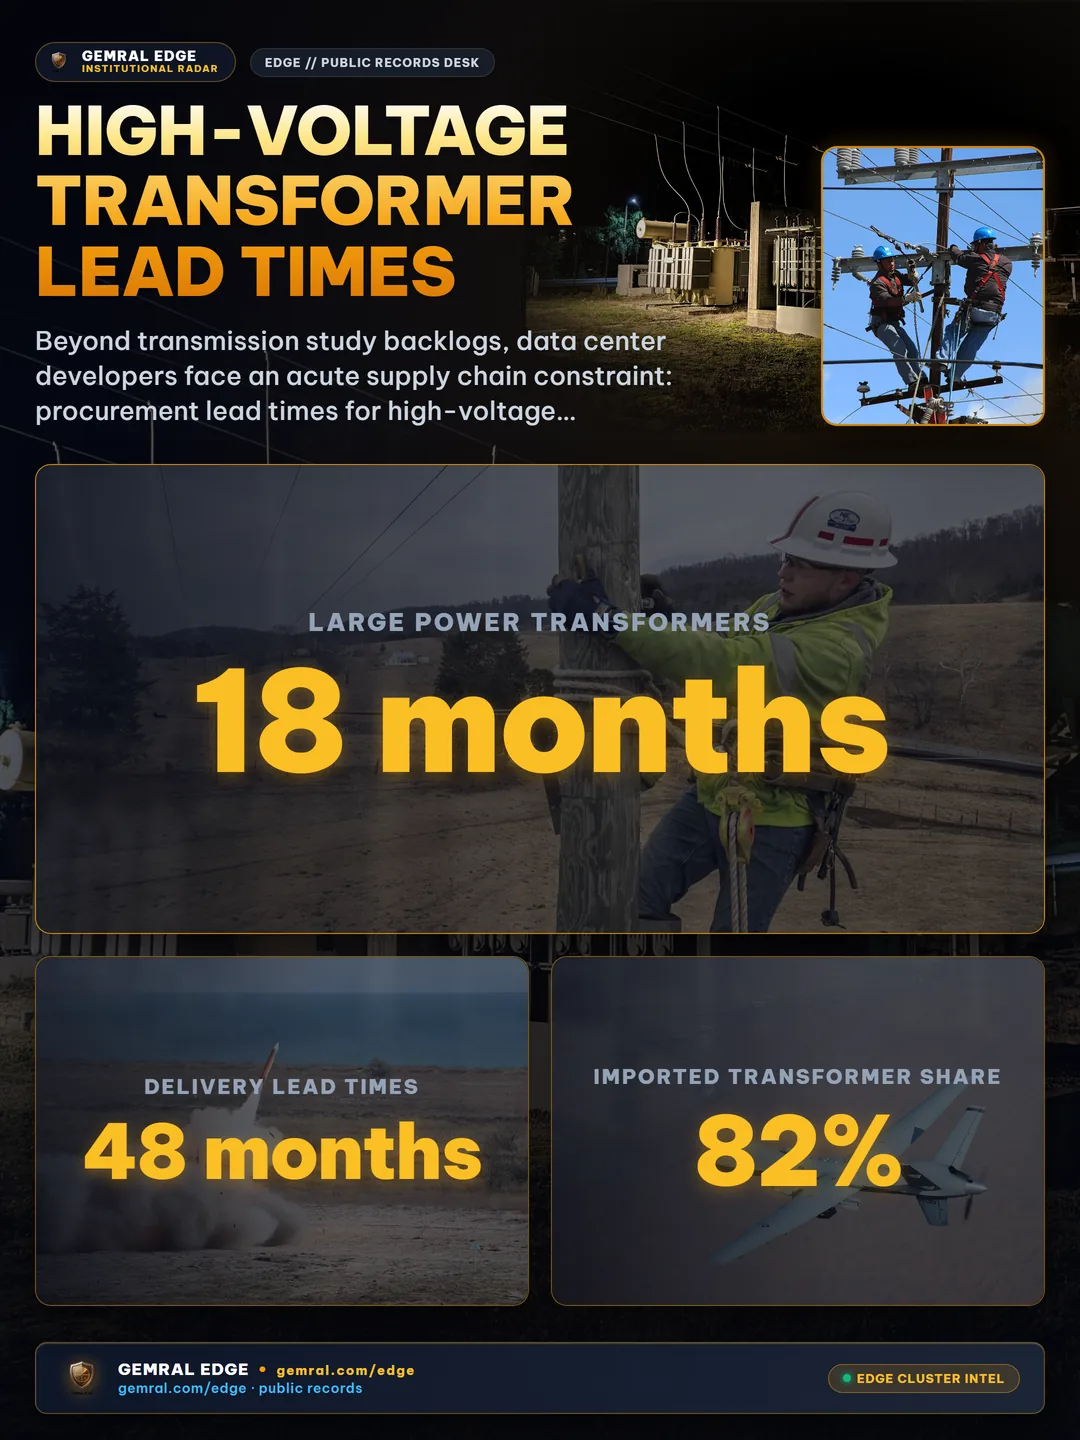
Prior to 2021, standard procurement lead times for Large Power Transformers averaged 12 to 18 Months. Under current supply chain conditions, quoted delivery lead times have expanded to 38 to 48 Months from order placement to site delivery.
Multiple structural factors drive this multi-year delivery window:
- Raw Material Constraints: High-efficiency power transformers require specialized Grain-Oriented Electrical Steel (GOES) for core laminations. Global manufacturing capacity for high-permeability GOES remains concentrated among a small handful of specialized domestic and international mills, creating a rigid material bottleneck.
- High Import Dependency: Domestic US manufacturing facilities supply less than 20% of domestic power transformer demand. Approximately 82% of core transformer assemblies and components rely on international supply chains across Europe, Japan, and South Korea, exposing projects to maritime shipping delays and tariff exposure.
- Hand-Crafted Manufacturing: Unlike mass-produced server hardware, high-voltage transformers are built to project-specific electrical specifications. The core stacking and copper coil winding processes require highly skilled technicians and specialized clean-room winding facilities. Expanding factory throughput requires years of specialized workforce training.
- Capital Cost Escalation: High demand from both data center developers and electric utilities replacing aging 50-year-old grid assets has driven unit pricing sharply upward. A single 120 MVA substation transformer that previously cost $2.2M now routinely commands $4.2M or more, requiring multi-million-dollar non-refundable reservation deposits at least three years ahead of site groundbreaking.
To mitigate this critical path risk, hyperscalers and institutional infrastructure funds have transitioned from just-in-time equipment procurement to programmatic forward purchasing, placing orders for hundreds of transformers years before site zoning and grading approvals are finalized.
Substation Firm Capacity vs Backup Generators: Decoupling IT Load Boundaries
A frequent source of confusion among market participants and equity analysts is the relationship between utility substation capacity and on-site backup generator capacity. When evaluating campus announcements, observers often conflate environmental permit megawatt figures with active compute consumption.
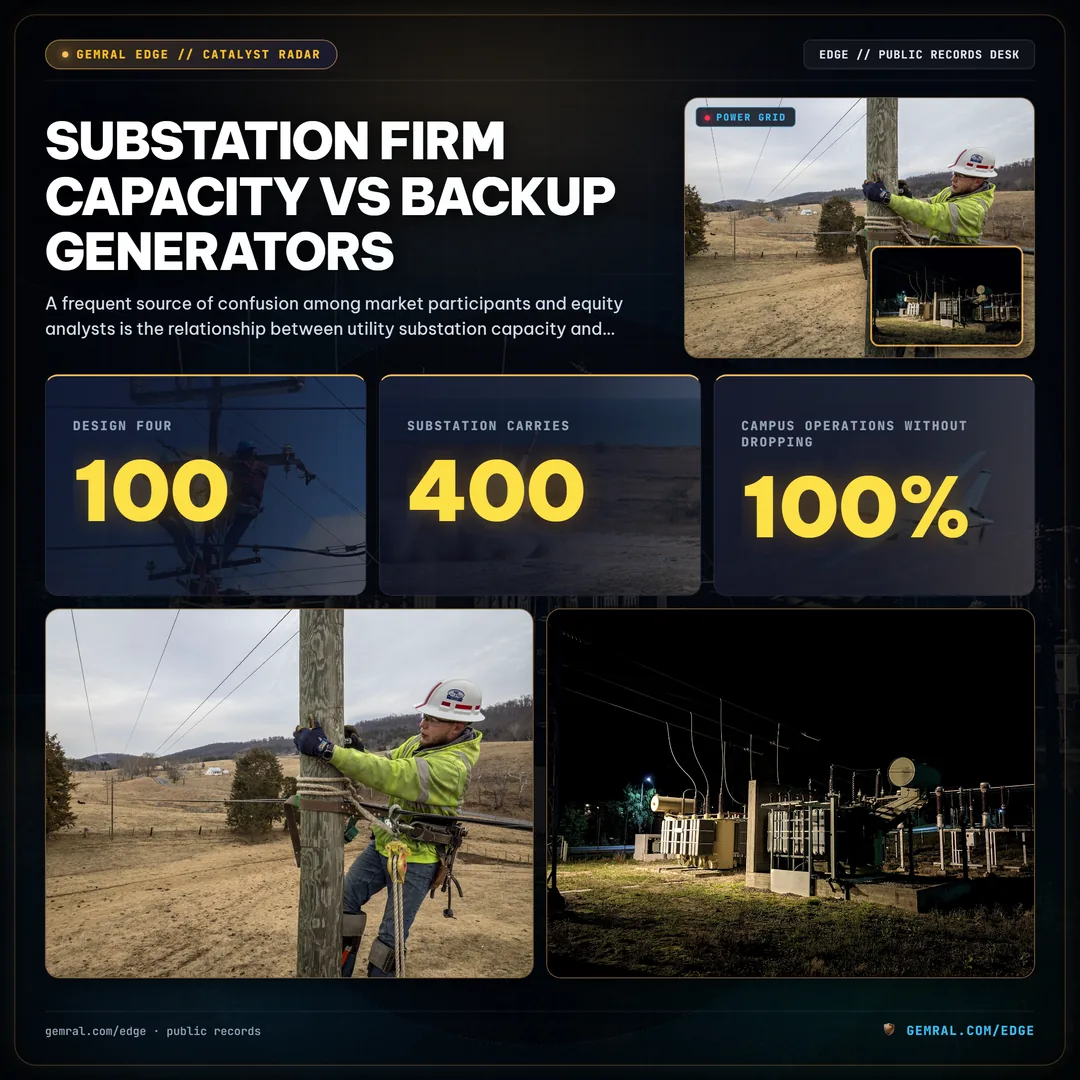
Substation capacity defines the continuous firm power capacity that the electric utility agrees to supply to the campus under normal operating conditions. Hyperscale substations are engineered with redundant architectures, typically utilizing an N+1 or 2N topology across transformer bays. In a 2N design with four 100 MVA transformers, the substation carries 400 MVA of total connected transformer capacity, but operates with a firm capacity of 200 MVA. This ensures that if two transformers fail or are taken offline for maintenance, the remaining units carry 100% of campus operations without dropping load.
Conversely, on-site diesel or natural gas backup generators operate strictly during utility power interruptions or transmission maintenance events. While server workloads require continuous grid energization, emergency generators provide the final safety net to maintain 99.999% uptime availability.
Environmental regulatory agencies require data centers to secure air quality operating permits before installing and testing stationary emergency generators. For example, a campus in Virginia may secure state air permits authorizing a combined generator capacity of 98.0 MW across an array of 3.0 MW standby units.
Crucially, permitted backup generator capacity represents an upper bound on on-site emergency backup capacity, not continuous IT load (upper bound on backup capacity, not IT load). Generators are sized to support the absolute peak electrical draw of the facility, including mechanical chillers, pumps, fans, and uninterruptible power systems operating at design power usage effectiveness (PUE) thresholds of 1.25, plus safety margins.
Furthermore, in our verified historical dataset covering 116 known Virginia data center campuses, 92.2% of sites (107 of 116 known sites) carry permitted backup generator megawatts, representing 171 of 194 dated air permits. Because backup generators are only permitted to operate for emergency generation and periodic maintenance testing (typically limited to 50 to 100 hours per generator annually), their permitted capacity must never be treated as an equivalent measure of continuous grid demand or daily computational throughput. Readers seeking deeper background on stationary generation permits can examine our detailed breakdown of data center backup generators.
Substation Proximity and Entity Resolution: Tracking Physical Infrastructure Telemetry
When evaluating data center site viability and power availability, physical proximity to existing high-voltage transmission infrastructure serves as a decisive leading indicator. Constructing new overhead or underground transmission lines costs between $2.5M and $6.0M per mile, requires extensive right-of-way easement acquisitions, and introduces years of environmental impact reviews.
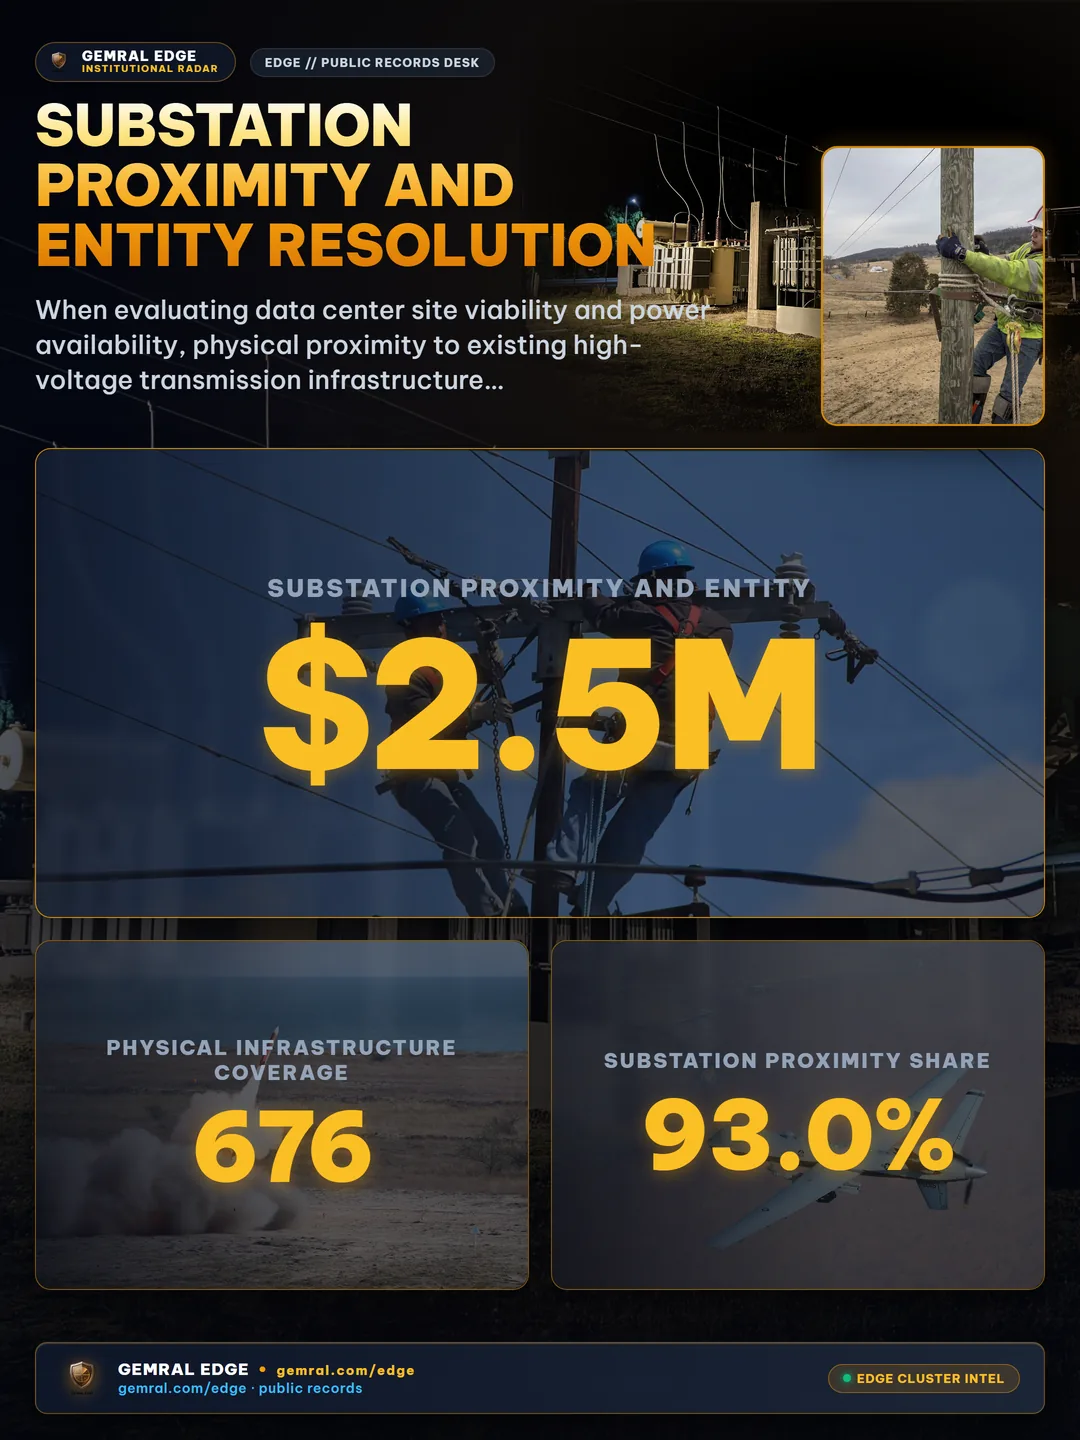
In our physical infrastructure coverage across 676 known hyperscale data center sites, 93.0% of sites (629 of 676 known sites) are located within 5 km of a high-voltage substation operating at 115 kV or higher, with a median distance of exactly 1.02 km (0.8 Miles). Campuses developed within 1 km of an existing 230 kV or 500 kV transmission substation benefit from dramatically shorter interconnect lead times and reduced capital expenditure requirements.
However, tracking data center power connections through public records presents severe entity resolution challenges. Hyperscalers and colocation developers routinely acquire real estate, submit air permit filings, and negotiate utility interconnection agreements through anonymous single-purpose limited liability companies (LLCs).
A critical failure mode in conventional equity research is look-ahead bias caused by static entity mapping. In our study of 169 dated state air permit events across Virginia, 40 of 169 permit events (23.7%) attach too early or to the wrong parent company if mapped through a static current-owner table. Similarly, across 687 power plant status events in federal utility records, 70 of 687 events (10.2%) suffer from identical look-ahead bias when corporate mergers, campus sales, and tenant leases are backprojected onto historical dates.
Point-in-time entity resolution ensures that every substation interconnect filing, parcel acquisition deed, and environmental air permit links to the exact parent operator who held beneficial ownership on the recorded filing date. Across state-level environmental disclosures, our tracked database captures 46 records in Georgia, 34 dated records in Texas, and 15 records in Arizona (including 10 records with explicit issue dates). Additionally, 79 of 81 known sites in Texas, Georgia, Ohio, and Arizona carry formal federal air-program registrations. For equity investors assessing public energy producers, our companion study on data center energy stocks details how regulated utilities handle these capital deployment cycles.
Institutional Alternative Data for Grid Infrastructure: Monitoring AI Power Constraints
For quantitative hedge funds, infrastructure credit investors, and real estate developers, tracking the physical reality of data center power delivery has evolved from an operational detail into a primary source of variant perception.
Public hyperscaler forward guidance frequently discusses multi-billion-dollar artificial intelligence capital expenditures. However, balance sheet capital cannot translate into operational GPU clusters without physical grid energization. By systematically monitoring the physical telemetry of high-voltage substations, regional transmission interconnection queues, and environmental generator permits, institutional investors can verify whether stated campus completion timelines are physically achievable.
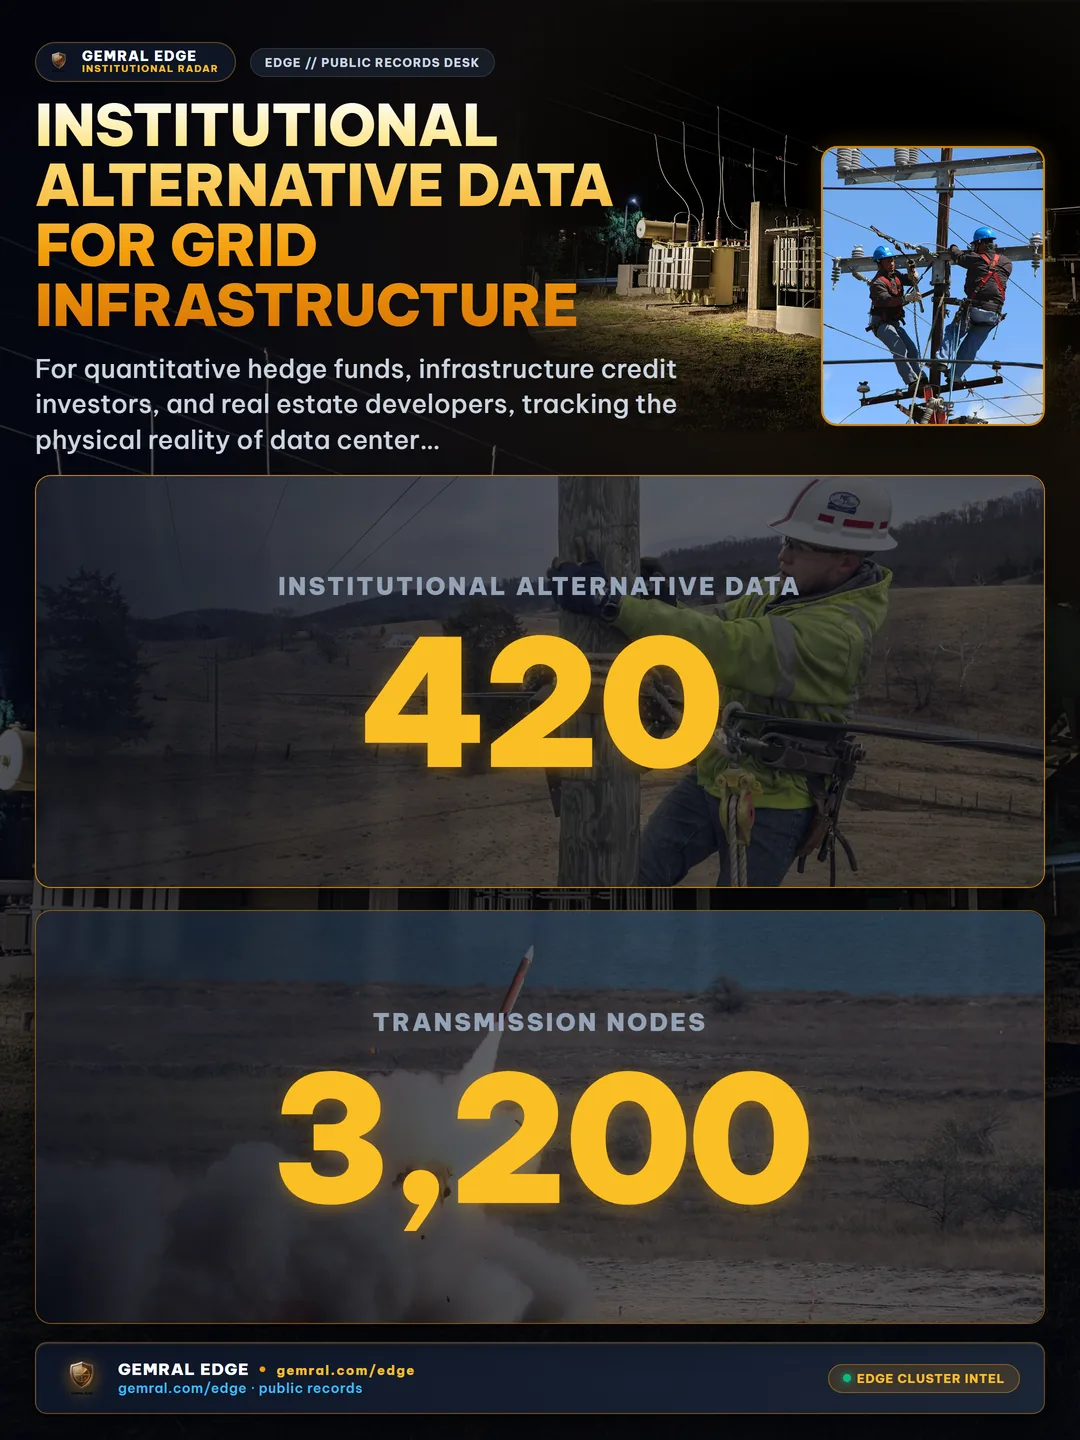
Our institutional dataset tracks power delivery metrics across 4 Balancing Authorities and 14 major utility service territories, covering more than 420 tracked hyperscale campuses and 3,200 transmission nodes:
- Substation Interconnection Status: High-voltage switchyard construction progress, transformer pad installations, and dual-feed transmission line extensions mapped point-in-time to parent corporate entities.
- Transmission Queue Telemetry: Position, requested capacity, and study milestone progress across regional ISO/RTO interconnection study cycles, identifying queue withdrawal risks and energization slippage.
- Environmental Air Permits: Complete chronological permit modification histories tracking permitted backup megawatts (upper bound on backup capacity, not IT load), generator engine counts, and fuel storage authorizations without static entity look-ahead bias.
- Regional Grid Stress Telemetry: Hourly balancing area demand trends, wholesale locational marginal pricing (LMP), and transmission reserve margins across high-density data center corridors.
Institutions evaluating physical infrastructure datasets and data center power delivery can explore our private sample data pack and API documentation directly via the Data Preview portal or explore our industry breakdown on our Sectors page.
Disclaimer: This analysis is provided for institutional information and market research purposes only and does not constitute financial, investment, or legal advice. All data and operational metrics reflect point-in-time public records and physical infrastructure telemetry.
Frequently asked questions
What is the primary function of a dedicated data center substation?
A dedicated data center substation steps down high-voltage utility transmission power (115 kV, 230 kV, or 500 kV) to medium distribution voltages (34.5 kV or 13.8 kV) across redundant transformer bays. This allows hyperscale AI facilities consuming hundreds of megawatts to interconnect directly with bulk regional transmission networks rather than overloading local distribution grids.
How long are lead times for high-voltage data center power transformers?
Lead times for Large Power Transformers (LPTs) and step-down substation transformers typically range between 38 to 48 months as of 2026, driven by global grain-oriented electrical steel shortages, winding capacity constraints, and unprecedented utility queue backlogs.
What is the difference between substation firm capacity and backup generator megawatts?
Substation firm capacity represents continuous utility grid power delivered under N+1 or 2N operational redundancy. In contrast, permitted backup generator capacity represents an upper bound on on-site emergency generation, not continuous IT load, and is strictly governed by state environmental air operating permits.
Why are utility interconnection queues creating multi-year delays for AI campuses?
Regional grid operators such as PJM, ERCOT, and MISO face interconnection backlogs exceeding 2,600 GW of combined generation and large load requests. Detailed engineering feasibility studies, system impact evaluations, and transmission upgrade requirements regularly push energized commercial operation dates back by 5 to 7 years.