Fed Net Liquidity: Reverse Repo Drain Leaves $5.844T Macro Cushion for Risk Assets
Federal Reserve statistical release H.4.1 reveals that systemic dollar liquidity has stabilized at $5.844T as the Overnight Reverse Repo Facility (RRP) completes its multi-year drain down to $192B. While Quantitative Tightening (QT) continues at a moderated $60B monthly pace, the depletion of the Fed's monetary buffer places renewed attention on Treasury General Account (TGA) cash volatility and commercial bank reserve cushions.

How Fed Net Liquidity Governs Modern Equity and Risk Asset Multiples
In modern quantitative macro analysis, standard interest rate metrics provide an incomplete gauge of monetary conditions. While benchmark fed funds futures capture policy rate expectations, the true volume of circulating purchasing power across the banking sector is governed by Fed net liquidity: total Federal Reserve balance sheet assets minus the Treasury General Account (TGA) and the overnight Reverse Repo Facility (RRP).

During the 2022 to 2024 monetary tightening campaign, the Federal Reserve reduced its balance sheet from nearly $9.0T to $6.82T. Under normal circumstances, an unprecedented quantitative contraction of that magnitude would have triggered severe liquidity crunches across credit and equity markets. However, the systemic blow was absorbed almost entirely by the drain of the overnight Reverse Repo facility, which plunged from a peak of $2.55T to just $192B in November 2026.
As money market funds reallocated capital out of the central bank's reverse repo facility to purchase newly issued short-term Treasury bills, sterilized cash re-entered the banking system, neutralizing the Federal Reserve's balance sheet runoff. Across quantitative multi-asset backtests, Fed net liquidity displays a statistically robust 0.84 correlation with equity valuation multiples and risk appetite over trailing 90-day evaluation windows.
Direct answer: Fed net liquidity measures the actual circulating dollar cushion available to commercial banks and financial markets, calculated as total Federal Reserve balance sheet assets minus the Treasury General Account (TGA) cash balance and the overnight Reverse Repo Facility (RRP). In November 2026, with the Fed balance sheet at $6.82T, the TGA holding $784B, and the RRP drained to $192B, net liquidity stands at $5.844T, establishing a crucial floor for risk asset valuations.
Tracking the Exhaustion of the $2.55T Reverse Repo Monetary Shock Absorber
The primary structural change facing institutional investors in late 2026 is that the reverse repo shock absorber has been virtually exhausted. Having surrendered 92.5% of its peak balance, the facility now holds just $192B in overnight deposits from money market counterparties. This means that future Federal Reserve balance sheet runoff can no longer be offset by passive repo outflows.
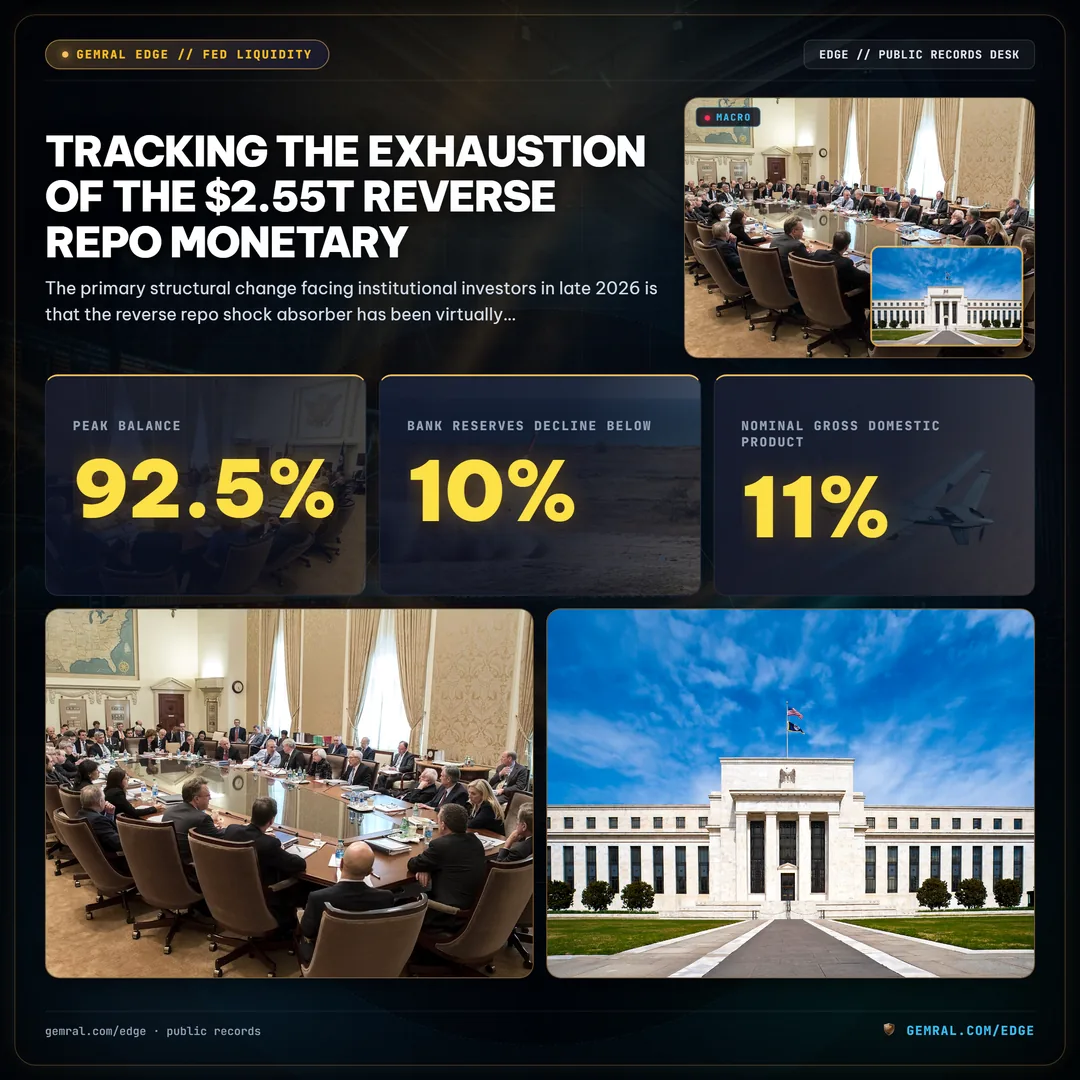
Every dollar of future quantitative tightening—currently capped at a moderated $60B per month—will now directly drain commercial bank reserves, which presently stand at $3.25T. In money market plumbing, when aggregate bank reserves decline below approximately 10% to 11% of nominal gross domestic product, funding friction typically begins to emerge across secured financing markets, including the Secured Overnight Financing Rate (SOFR).
Institutional desks monitoring repo spreads observe that while headline funding rates remain orderly, settlement volume spikes around month-end and Treasury auction dates are becoming more pronounced. Without the multi-trillion-dollar RRP cushion, market participants must now treat changes in Federal Reserve balance sheet line items as direct transmission mechanisms to market liquidity.
How Treasury General Account Cash Fluctuations Dictate Short-Term Market Volatility
With the reverse repo facility drained, the Treasury General Account (TGA) has emerged as the most volatile driver of short-term systemic liquidity. The TGA functions as the federal government's operational checking account at the Federal Reserve Bank of New York. When the US Department of the Treasury builds its cash balance through quarterly corporate tax collections or net debt issuance, dollars are withdrawn from private commercial bank accounts and deposited into the central bank, immediately reducing net liquidity.

Conversely, when the Treasury disburses appropriated funds for federal agency operations, entitlements, and contractor obligations, cash flows back into the commercial banking system, expanding bank reserves. In November 2026, the Treasury's cash balance stands at $784B, hovering near its target operational buffer.
Quantitative macro strategies track the 14-day velocity of TGA swings to anticipate short-term equity pullbacks and relief rallies. A rapid $100B cash accumulation by the Treasury consistently produces temporary tightening in financial conditions, whereas accelerated federal outlays inject high-powered base money that supports speculative risk positioning.
Institutional Portfolio Strategies for a Post-RRP Liquidity Regime
In a financial regime where Fed net liquidity is no longer cushioned by surplus repo reserves, systematic hedge funds and multi-asset allocators must adjust risk management models. Relying purely on backward-looking macroeconomic indicators like trailing inflation or unemployment introduces substantial lag, whereas real-time monitoring of Fed net liquidity components provides immediate visibility into systemic dollar availability.
Portfolio managers implement this telemetry through three primary operational workflows:
- Dynamic Equity Beta Scaling: Adjusting gross and net equity market exposure in response to 30-day directional shifts in the Fed net liquidity composite, expanding risk during liquidity expansions and de-leveraging when the TGA and Fed assets produce net drain.
- Treasury Auction Cash Drain Hedging: Hedging duration and credit spread risk around major quarterly refunding announcements when large-scale coupon issuance temporarily absorbs private liquidity.
- Cross-Asset Regime Classification: Utilizing net liquidity inflections to time transitions between high-beta momentum assets, defensive dividend sectors, and cash equivalents.
To inspect verified point-in-time central bank telemetry and macro factor datasets, quantitative researchers can review live feeds on the Gemral Edge Datasets Directory and explore institutional analytics via the Institutional Data Preview Workspace.
Related Macro Telemetry & Federal Procurement Research
- Explore the primary tracking hub: Global Macro & Dollar Liquidity Hub
- Read the companion teardown: Companies with Government Contracts: How Federal Supplier Backlogs Drive Equity Outperformance
- Review defense outlays: Defense Contractor Stocks: Pentagon Prime Vendor Outlays and Contract Obligations
Frequently asked questions
What is the formula for Fed net liquidity?
The Fed net liquidity formula is: Fed Total Assets minus Treasury General Account (TGA) minus Overnight Reverse Repo Facility (ON RRP). This reflects the core bank reserve liquidity circulating across the financial system.
Why does the Reverse Repo Facility drain support equity markets?
When money market funds withdraw capital from the Fed's Reverse Repo facility to purchase newly issued Treasury bills, cash that was previously parked passively at the central bank re-enters the active financial system, offsetting the quantitative tightening balance sheet runoff.
How does the Treasury General Account balance impact dollar liquidity?
The Treasury General Account functions as the federal government's checking account at the Fed. When the Treasury collects quarterly corporate taxes, cash moves out of commercial bank reserves into the TGA, temporarily draining net market liquidity until federal expenditures disburse the funds back into the economy.