Best Insider Trading Websites: 6 Checks Before You Trust One
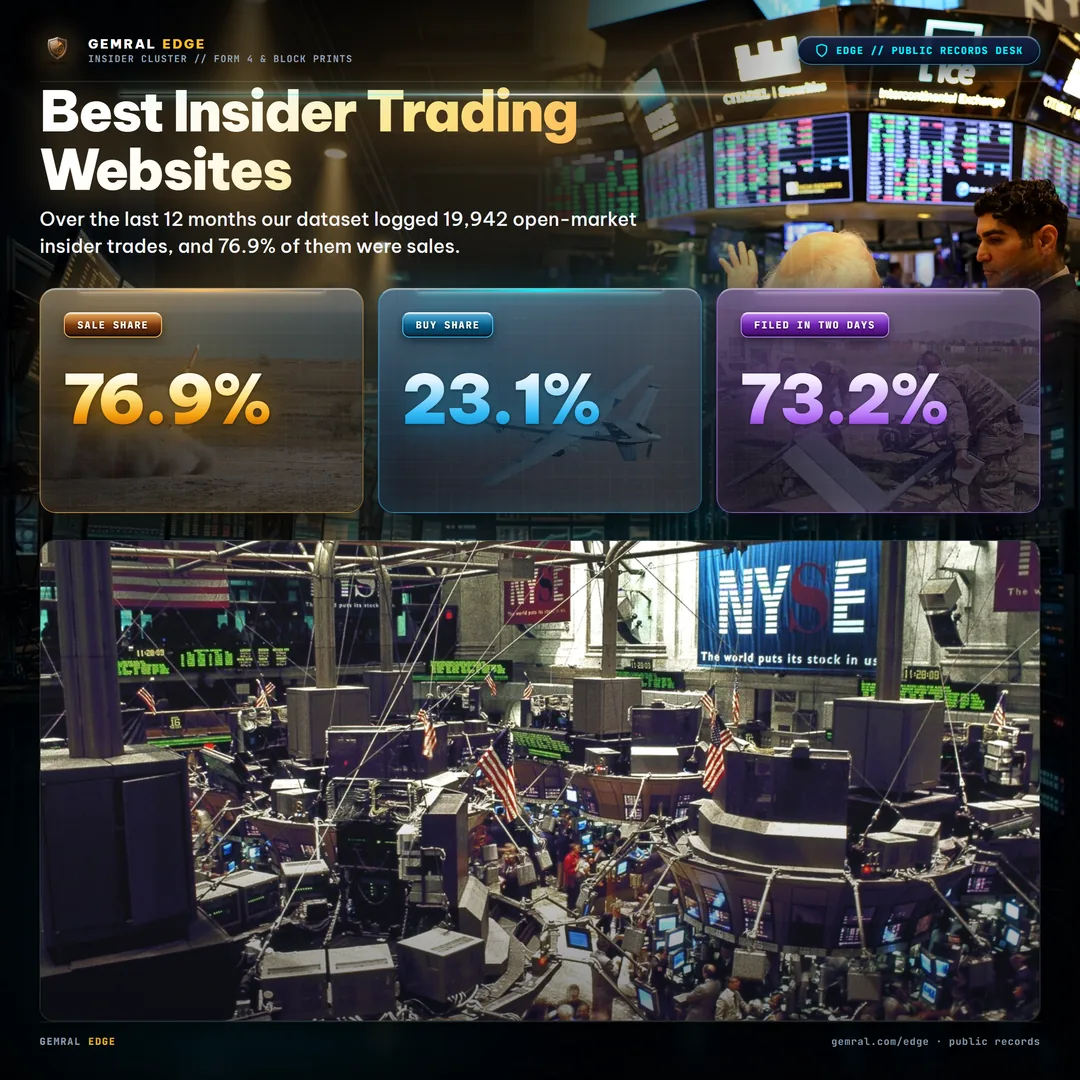
Over the last 12 months our dataset logged 19,942 open-market insider trades, and 76.9% of them were sales. A website that shows only the buys, or hides the filing date, is showing you a different market. Here are the six checks that separate a useful insider trading website from a noisy one.
Search for the best insider trading websites and you get a list of tools that all show the same thing on the surface: a table of company officers and directors who bought or sold shares of their own company. The differences are underneath. Two sites can show the same trade and leave you with opposite impressions, depending on whether they show the filing date, whether they separate buys from sales, and whether they tell you a trade was set up months in advance.
This article is a checklist, not a ranking. We do not score other sites. Instead we use our own dataset of insider transactions to show what each check looks like in real numbers, so you can test any insider trading website against it in a few minutes. Every figure below covers trades dated from November 13, 2025 to November 12, 2026 and was measured from the live dataset on November 13, 2026.
What makes an insider trading website good?
A good insider trading website answers one question honestly: what did the people closest to a company do with their own money, and when could the public first see it? Everything else, such as charts, alerts and rankings, is decoration around that answer. If the site cannot tell you when a trade happened, when it was filed and what kind of trade it was, the rest does not matter.
Insiders file a report of each transaction, and those reports are public. That is the raw material every website starts with. What separates one site from another is how much of the context survives the trip from the filing to your screen. The six checks below each test one piece of that context.
Check 1: Does it separate open-market buys from sales?
In our dataset, 4,614 of 19,942 trades over the last 12 months were open-market purchases, which is 23.1%. The other 15,328 were sales, or 76.9%. Sales outnumber buys by roughly 3.3 to 1.

Open-market buys: 4,614 trades, 23.1% of the total. Sales: 15,328 trades, 76.9% of the total.
That ratio is the first thing to look for on any website. Insiders sell for many ordinary reasons: paying taxes, diversifying, funding a house. They tend to buy on the open market for fewer reasons. A site that blends the two into one feed, or that ranks only by dollar size, makes a routine sale look as meaningful as a purchase. A good site lets you filter to buys alone and see the sales count next to it, so you know how crowded the other side of the ledger is.
Check 2: Does it show when the trade was filed, not only when it happened?
Every record carries two dates: the day the insider traded and the day the report was filed. In our dataset, 14,590 of 19,942 trades, or 73.2%, were filed within two days of the trade. The median gap is one day. That sounds quick, and for most records it is.
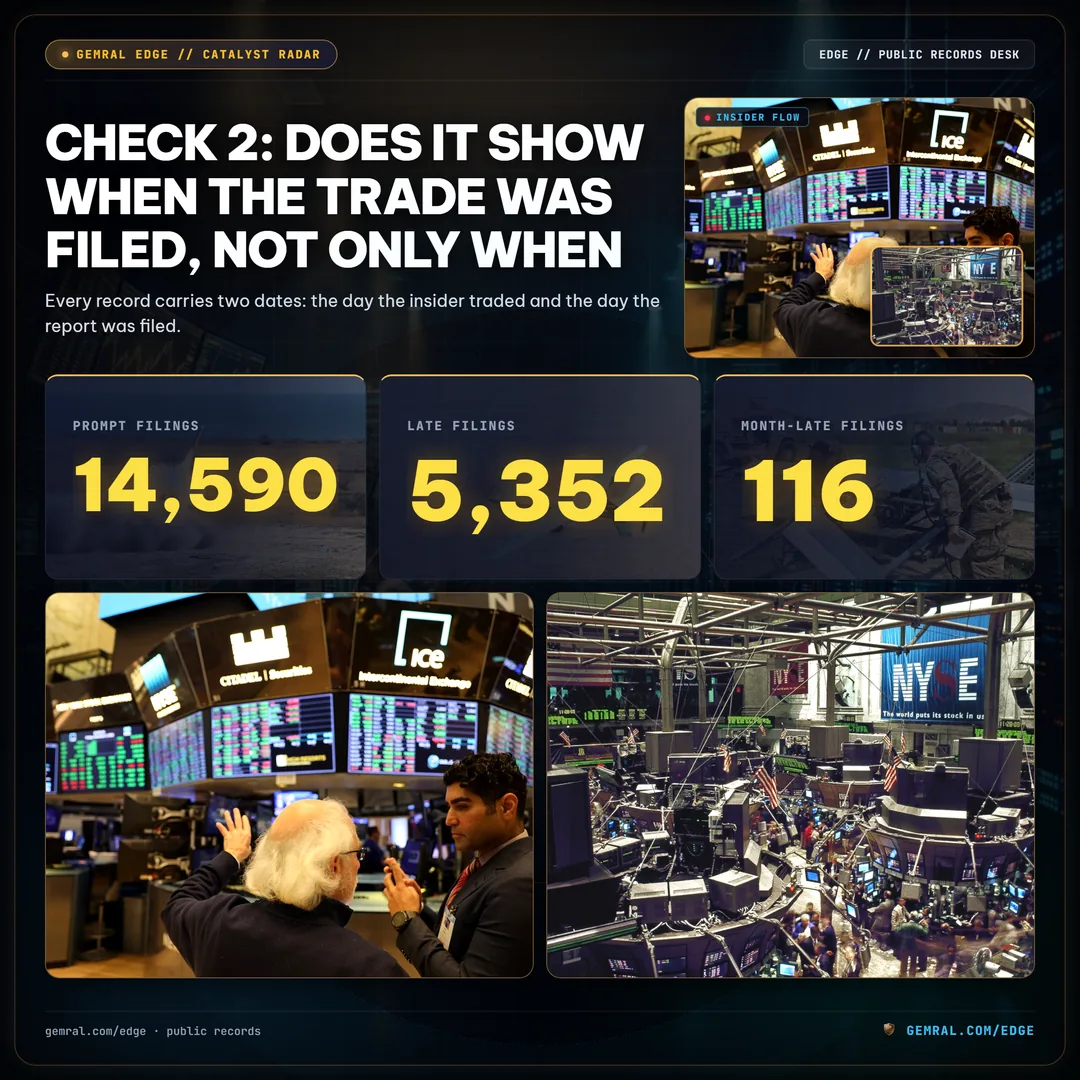
The other 5,352 trades, or 26.8%, were filed later than two days, and 116 of them were filed more than 30 days after the trade. If a website lists only the trade date, a 30-day-old trade that was filed yesterday looks like old news, and a trade that happened yesterday but was filed today looks like it was knowable all along. For research, the filing date is the date the public could first act on the information. A site that hides it invites a look-ahead mistake without ever saying so.
Filed within two days: 14,590 trades, 73.2% of the total. Filed later: 5,352 trades, 26.8% of the total. Filed over 30 days late: 116 trades.
Check 3: Does it flag trades made under a pre-arranged plan?
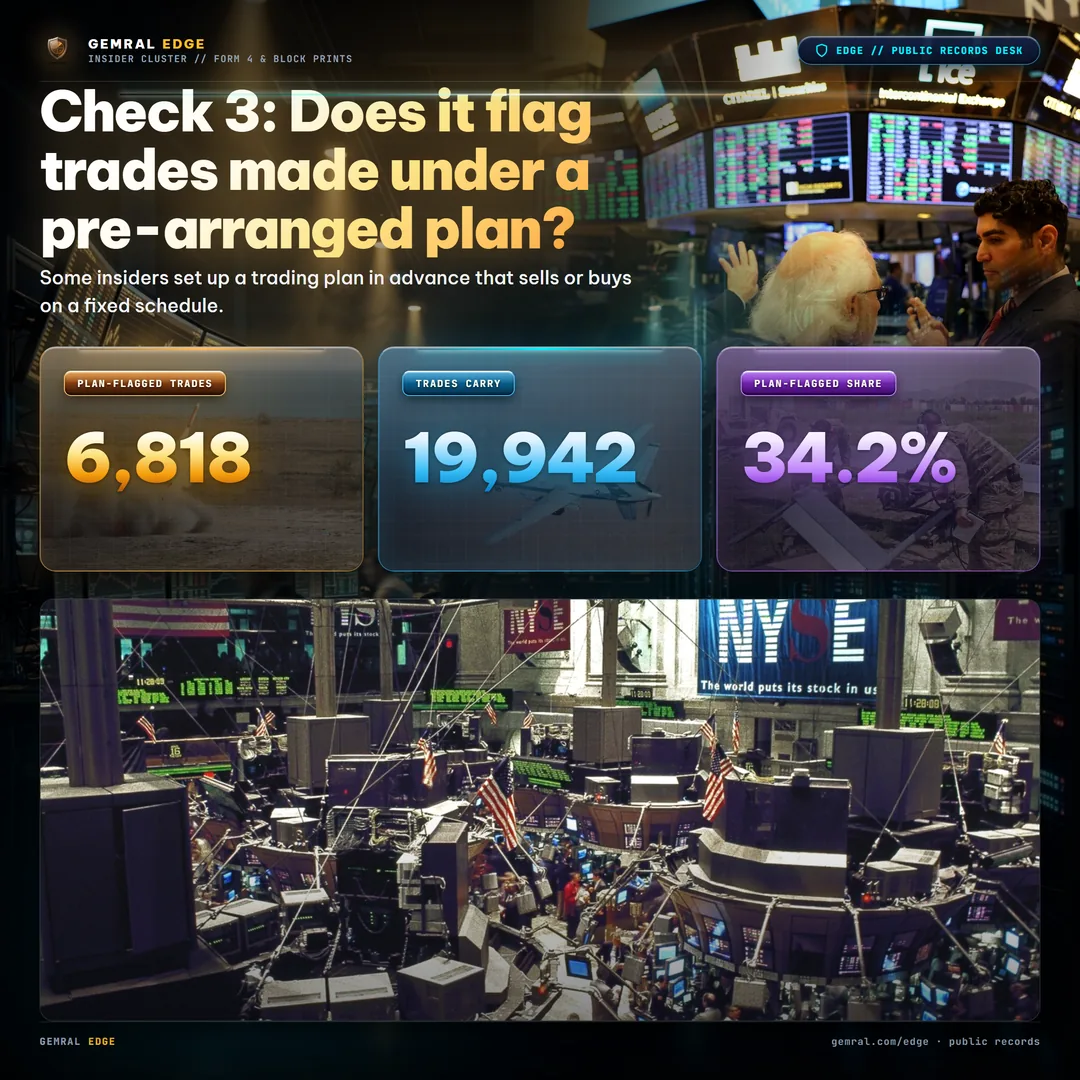
Some insiders set up a trading plan in advance that sells or buys on a fixed schedule. Those trades are flagged in the filing. In our dataset, 6,818 of 19,942 trades carry that flag, which is 34.2%, or about one in three.
This matters because a planned trade says little about what the insider thinks today. It was decided earlier. A website that shows a large sale without the flag can make a scheduled transaction look like a fresh vote of no confidence. A good site shows the flag in the table, not buried in a detail page, and lets you filter planned trades out when you want to look only at discretionary ones.
Plan-flagged trades: 6,818, which is 34.2% of the total. Trades without the flag: 13,124, which is 65.8%.
One record up close: a trade on October 26, 2026
To see how the two dates and the flag fit together, take one ordinary record. A reporting person bought 100,000 shares of GPI on the open market on October 26, 2026. The report was filed on October 27, 2026, a one-day gap, and the trade does not carry the pre-arranged plan flag. That single row tells you what happened, when it happened, when the public could first see it and whether it was scheduled.

Shares bought: 100,000. Filing gap: 1 day. Plan flag: none.
Now imagine the same trade on a website that shows only the trade date and a dollar total. You would not know whether it was filed the next day or a month later, and you would not know whether it was planned. The numbers would be identical and the meaning would not.
Check 4: Does it handle amendments and corrections?
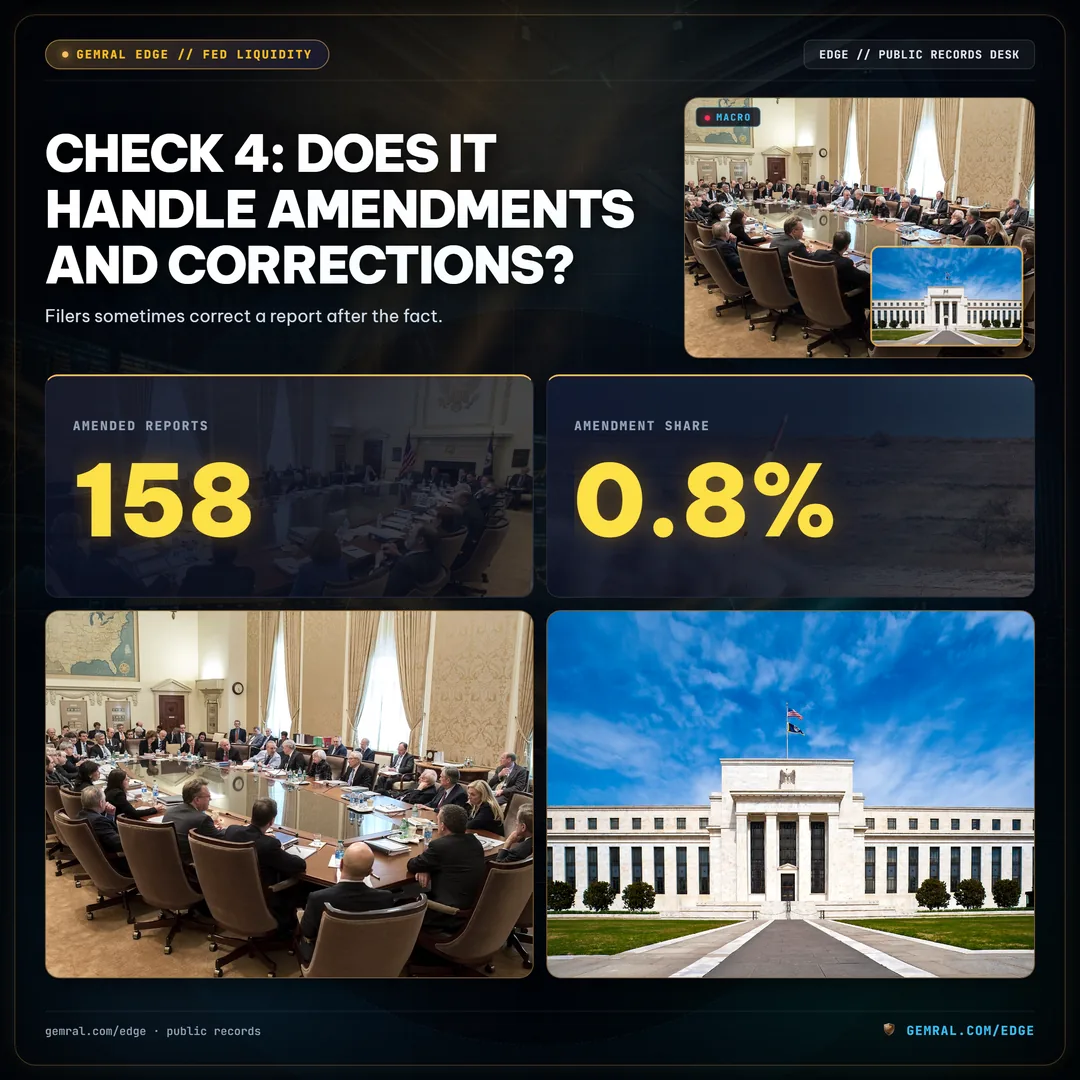
Filers sometimes correct a report after the fact. In the last 12 months our dataset recorded 158 amendments, which is 0.8% of all trades. That is small, but it is enough to matter. If a website keeps both the original and the corrected report, the same trade appears twice and any total built from the table is inflated. If it keeps only the original, you may be reading a figure the filer has already fixed.
The test is simple: pick a trade you know was amended and see how the site treats it. A good site replaces the old record with the corrected one and keeps the link between them, so the count stays honest and the history stays visible.
Amended reports: 158 filings, 0.8% of all trades.
Check 5: Does it use the ticker the company had at the time?
Companies rename, merge, spin off and delist. If an insider trade is stamped with today's ticker instead of the one valid on the filing date, an old record can point to the wrong company, or to none. In our dataset, all 19,942 records in this window carry a ticker, and each ticker is the one valid on the day the record became public.
For anyone doing research across years, this is the check that decides whether a historical study is reliable. A website that only maintains current tickers will quietly drop trades made at companies that no longer exist, which tilts every historical result toward the survivors. Ask any site how it labels a trade at a company that was later acquired. The answer tells you how much of the past it kept.
Trades with a ticker: 19,942, which is 100% of the window. Trades missing a ticker: 0.
Check 6: Does it tell you what it leaves out?
The count above is the number of open-market buys and sales in the Edge dataset. It is not every kind of insider transaction. Stock grants, option exercises, gifts and similar events are different in nature and are not part of this count. It is also not a prediction of anything. A cluster of insider buys is a fact about what people did, not a forecast of what a share price will do.
A trustworthy website says this plainly: what it counts, what it skips, the date range, and the date it last updated. If a site gives you a confident ranking with no scope note, treat the ranking as a starting point for your own reading of the filings, not as a conclusion.
How to test any insider trading website in five minutes
Pick a company you know and open its insider page on the site you are testing. First, check whether buys and sales can be viewed separately. Second, look for both the trade date and the filing date. Third, find the pre-arranged plan flag. Fourth, look up a trade you know was amended. Fifth, check what ticker an older record carries. Sixth, find the scope note. A site that passes all six is giving you the context that makes the numbers usable. A site that passes two or three is giving you a table.
Our own dataset is built around these checks because point-in-time research depends on them: every record is tied to the company and ticker that were valid on the day it became public, and publication lags are applied so records can be joined without look-ahead. That is a design choice, and you can hold it to the same six tests.
Where to explore the data
To look at insider activity yourself, start with the insider activity hub, where buys and sales can be viewed side by side. For the congressional side of the same disclosure stream, see what stocks did Congress buy, and for how the two relate, read congress stock tracker vs corporate insider filings.
A sample of the structured records is available in the institutional data preview. Explore the data at gemral.com/edge.
Frequently asked questions
What is the best insider trading website?
There is no single best site; test any of them against six checks: buys and sales shown separately, trade date and filing date, a pre-arranged plan flag, amendment handling, the ticker valid at the time, and a clear scope note.
How fast are insider trades reported?
In the Gemral Edge dataset, 73.2% of 19,942 trades dated Nov 13, 2025 to Nov 12, 2026 were filed within two days, and the median gap was one day. 116 were filed more than 30 days after the trade.
Are most insider trades buys or sales?
Sales. In the same window 15,328 trades (76.9%) were sales and 4,614 (23.1%) were open-market buys.
What does the pre-arranged plan flag mean?
It marks a trade made under a trading plan set up in advance, so it says little about the insider's view on the trade date. 34.2% of trades in the dataset carry the flag.