AI Infrastructure Physical Telemetry: Point-in-Time Entity Resolution, Accuracy Gates, and Known Limits
AI infrastructure physical telemetry tracks 57 US-listed companies across 7 industry groups using point-in-time entity resolution across data-center sites, dated air permits, backup-generator MW, ≥115 kV substations, daily grid demand, equipment imports, quarterly capex, and monthly satellite measurements.
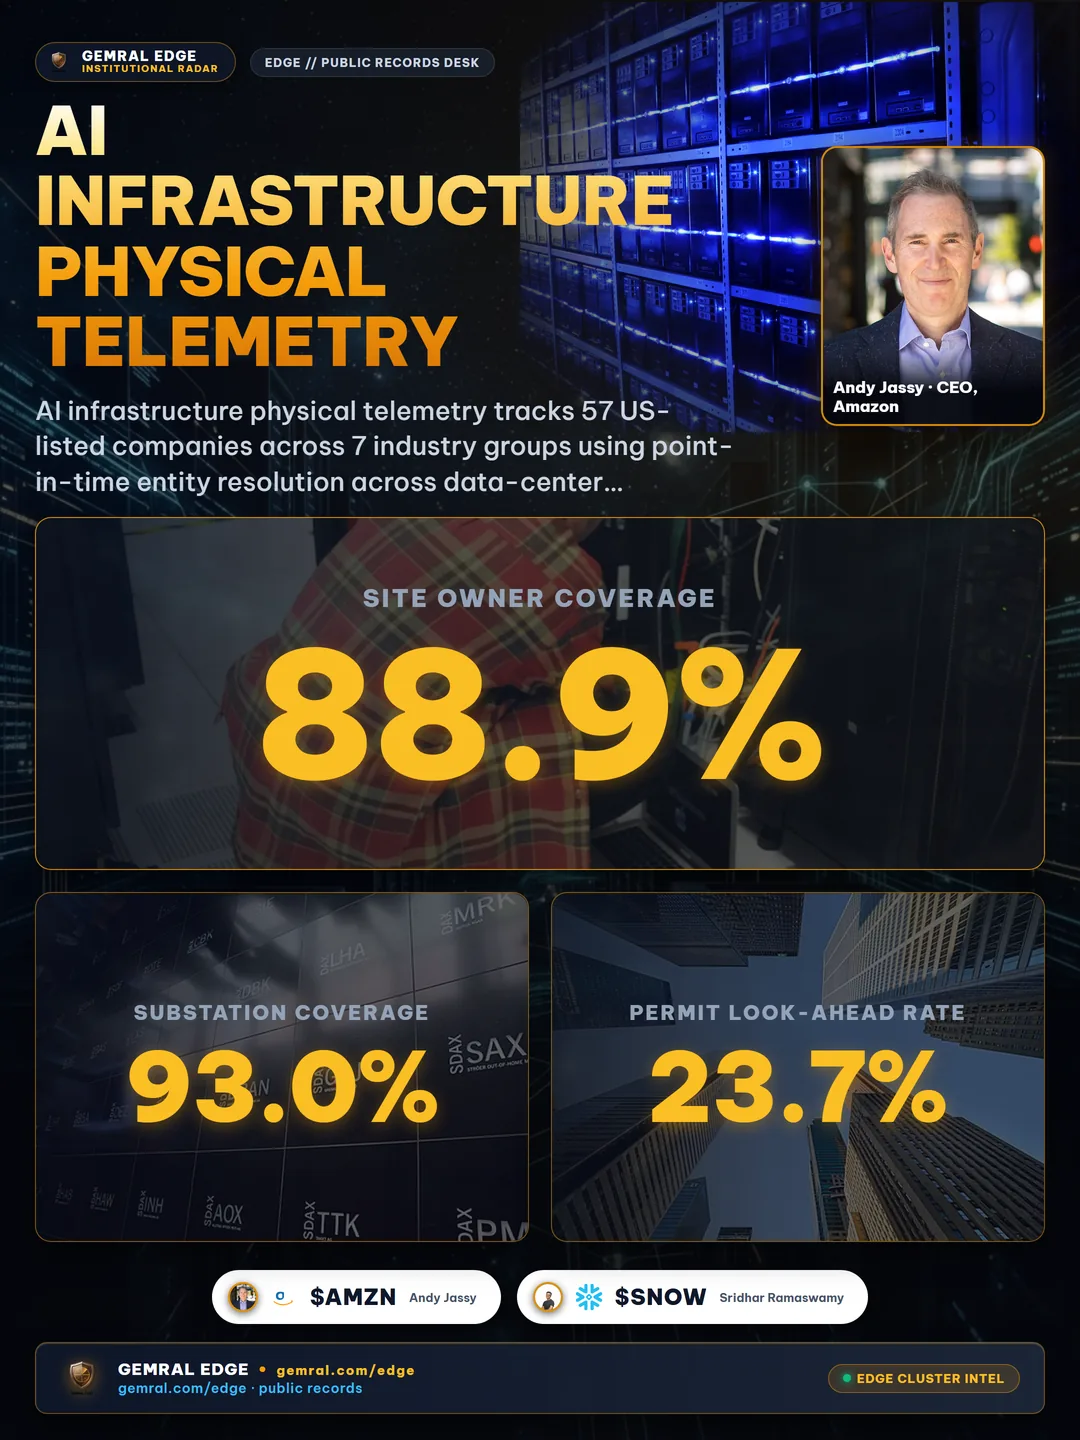
AI Infrastructure Telemetry: Solving Entity Misattribution Across 57 Listed Companies
40 of 169 data-center air-permit events (23.7%) and 70 of 687 power-plant status events (10.2%) fail point-in-time integrity when joined through today's corporate parent table instead of the owner valid on the publication date (measured October 24, 2026). For institutional funds analyzing AI infrastructure buildouts—spanning hyperscalers, AI clouds, data-center operators, semiconductors, optics, cooling equipment, and electric utilities—raw public registries break down at the exact moment a research team attempts to map physical facilities to publicly traded equity tickers.

Why does raw facility matching fail so severely? Because physical infrastructure filings rarely name the publicly listed parent company. Data-center campuses are routinely permitted under special-purpose holding LLCs, joint-venture development vehicles, or regional utility subsidiaries. Similarly, power-plant operators undergo mergers, asset divestitures, and holding-company restructurings across multi-year construction cycles. In an empirical coverage audit measured October 24, 2026, exact matching on raw operator names attributed 0 of 822 power-plant status events to a listed parent ticker, whereas effective-dated entity resolution attributed all 822 events to the parent company valid on the day each record became public. This measures coverage, not return predictability.
Consider how that misattribution distorts quantitative research pipelines when an analyst attempts to connect physical buildout events to equity tickers. Without effective-dated corporate trees, a regional power plant operated by a regulated subsidiary appears completely disconnected from its listed utility parent, or worse, an older environmental filing is silently dropped from cross-sectional coverage. Across 57 US-listed AI-infrastructure companies spanning 7 industry groups—hyperscalers, AI clouds, data-center operators, chips and servers, optics, power and cooling, and utilities and power producers—preserving historical parent-child links is the prerequisite for any cross-dataset join.
Feed 2 addresses this structural gap across a curated universe of 57 US-listed AI-infrastructure companies organized into 7 industry groups (verified November 11, 2026). Every physical record—whether an environmental air permit, a high-voltage substation link, a monthly equipment import series, a quarterly capital expenditure filing, or a monthly satellite surface measurement—is placed on the same point-in-time timeline. Data comes only from public sources and contains no material non-public information.
How Point-in-Time AI Infrastructure Data Resolves Holding Entities and Look-Ahead Bias
To eliminate look-ahead contamination in quantitative and fundamental research, physical telemetry must enforce two separate mechanisms: effective-dated ownership graphs and immutable publication timestamps. When a data-center parcel or power plant changes ownership through an acquisition or build-to-suit transfer, a static lookup table retroactively overwrites history—crediting the acquiring ticker with permits issued years before the deal closed.

Our effective-dated parent-child resolution layer preserves historical corporate ownership as it existed on each publication date. Across 577 tracked data-center sites as of November 21, 2026, 513 sites (88.9%) have an identified listed owner or an explicitly classified owner type, while 64 sites remain held under intermediary entities with no public parent disclosure. Thirteen of the 57 universe tickers hold sites under direct or resolved subsidiary ownership, and delisted or acquired companies remain in the historical record under the ticker they carried at the time.
In addition, every amendment or record update is written to an append-only revision log rather than silently overwriting historical values. Note an explicit temporal boundary: the revision log started in October 2026. Prior to October 2026, historical updates reflect the state captured under earlier ingestion rules rather than a full line-by-line diff history. Maintaining that explicit boundary prevents quantitative researchers from assuming revision-level auditability before the October 2026 cutoff.
Look-ahead discipline also requires separating historical backfills from live event capture. Most data-center permit events (289 of 292, measured November 12, 2026) were loaded from historical records, so their publication date is set to the permit issue date; we began recording new permits as they appear only in late 2026. Researchers must treat permit history as a dated reference rather than a point-in-time record for backtests.
Separating execution or permit issue dates from public availability timestamps also protects multi-layer joins against subtle survivorship and restatement errors. In commercial data-center construction, a single campus frequently undergoes multiple permit modifications over a 24-month window as backup-generator counts expand or fuel-storage limits change. A point-in-time table structure retains each version at its respective effective date, allowing an institutional team to reconstruct the exact permitting state visible on any historical research date without leaking subsequent modifications backward in time.
Furthermore, entity resolution must account for build-to-suit joint ventures and colocation leases where the legal property owner on a county tax parcel differs from the hyperscale tenant operating the compute cluster. Across the 577 tracked data-center sites as of November 21, 2026, 513 sites (88.9%) resolve to an identified listed owner or an explicitly classified owner category, while 64 sites remain under intermediary entities where no public document establishes a parent link. Rather than guessing or inferring unverified ownership for those 64 intermediary sites, strict data governance leaves their parent link null until a primary public filing confirms the corporate relationship.
Why Physical Telemetry Matters: Power Plants, Substations, and 107 Five-Layer Sites
Physical compute expansion is constrained by electrical transmission and generation lead times long before servers arrive at a loading dock. Combining five independent public-record layers on the same campus allows researchers to observe physical capacity milestones years ahead of quarterly revenue recognition.

Across 549 primary data-center sites (excluding off-grid crypto mining facilities, measured October 24, 2026), 487 sites link to a ≥115 kV substation, 484 map to a regional grid balancing zone, 264 carry air-permit or federal air-program registration records, 284 resolve to a parent owner entity, and 183 carry monthly satellite surface measurements (2023 forward). Notably, 107 data-center sites carry all five public-record layers simultaneously—92 of them concentrated in Virginia.
| Physical Infrastructure Layer | Measured Coverage | Measurement Date | Key Scope & Temporal Window |
|---|---|---|---|
| Site Owner Resolution | 88.9% (513 / 577) | 2026-11-21 | 64 intermediary sites without public parent |
| Substation Proximity (≥115 kV) | 93.0% (629 / 676) | 2026-10-18 | Within 5 km; median distance 1.02 km |
| Virginia Backup-Generator MW | 88.6% (109 / 123) | 2026-11-20 | Permitted backup ceiling, not IT load |
| Federal Air-Program Registration | 97.5% (79 / 81) | 2026-10-19 | Covers TX, GA, OH, and AZ primary sites |
| Five-Layer Integrated Sites | 107 (92 in VA) | 2026-10-24 | Owner + Substation + Grid + Air + Satellite |
On the generation side, monthly power-plant status tracking from February 2021 forward demonstrates how early public records surface new electrical capacity before turbines synchronize to the grid. Across 7,765 US power plants tracked since February 2021 (measured October 24, 2026), 1,118 plants transitioned from "planned" to "operating" with a median lead time of 16 months (interquartile range 9 to 25 months), while 2,884 plants moved from "under construction" to "operating" with a median lead time of 8 months. Another 1,398 planned plants remain in the pre-operating queue.
Why do substation proximity and regional grid balancing zones matter as much as power-plant lifecycles? Because high-density AI training clusters require immediate access to ≥115 kV transmission corridors. Across 676 evaluated physical sites (measured October 18, 2026), 629 sites (93.0%) sit within 5 km of a ≥115 kV substation, with a median distance of 1.02 km. Pairing each site with its nearest high-voltage substation and its daily regional grid demand series (280,000+ rows from 2019 forward) reveals whether a hyperscale cluster sits inside a constrained transmission pocket or a balancing area with expanding baseload capacity.
Meanwhile, monthly satellite surface measurements per site (running from 2023 forward across 183 primary data-center sites) provide an independent physical check on ground-level construction progress. When environmental air permits, substation proximity, utility generation queues, and satellite built-up or surface-heat indicators all align on the same campus, analysts gain multi-source verification that capital expenditure plans are translating into physical steel and concrete.
AI Infrastructure Capex, Equipment Imports, and State Air-Permit Coverage
Beyond campus coordinates and substation links, Feed 2 integrates three macro-to-campus quantitative layers: state air-quality permit records, quarterly corporate capital expenditures, and monthly US equipment import statistics. Each layer carries strict coverage definitions so analysts never extrapolate beyond what the underlying public document supports.
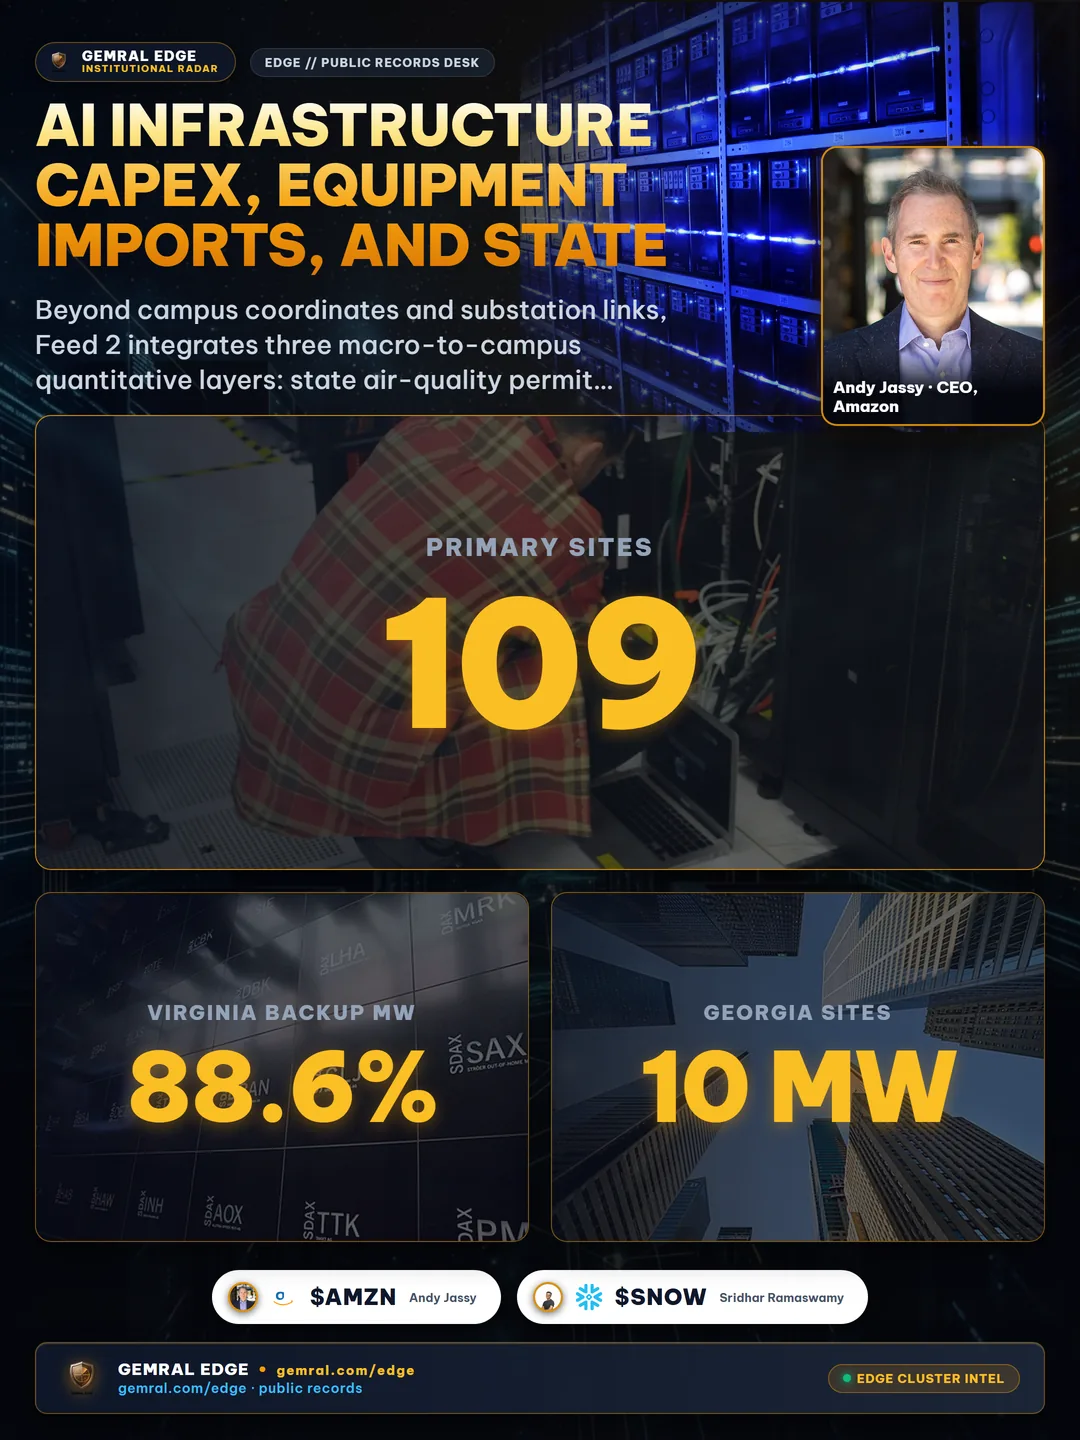
At the state permitting layer (measured November 11, 2026), dated state air-permit records cover known primary data-center sites in Georgia (46 records: 25 new permits and 21 modifications), Arizona (17 records: 8 new and 9 modifications, 10 with explicit issue dates), and Texas (34 records: 11 new and 23 modifications), alongside federal air-program registrations covering 79 of 81 sites across Texas, Georgia, Ohio, and Arizona (Ohio maintains no state air-permit portal). In Virginia, 109 of 123 ticker-linked primary sites (88.6%, measured November 20, 2026) carry permitted backup-generator MW values, supplemented by 8 Georgia sites with 10 MW records (measured October 19, 2026). Permitted backup-generator MW is an upper bound on on-site backup capacity, not IT load; we do not convert it.
At the county land-use layer (measured November 20, 2026), county land-use and building records capture 245 permitted buildings, 139 data-center parcels (46 linked to 8 listed tickers), and 85 planned project areas, every field as published, with version history. Crucially, county land-use and building records cover one county and start on October 20, 2026; the accuracy check confirms faithful copying, not the issuer's own completeness, and floor area is not converted to MW.
At the financial and supply-chain layer, quarterly capital expenditure filings span 3,216 rows across 55 of the 57 universe tickers (measured November 20, 2026), paired with 280,000+ daily regional grid demand rows (2019 forward), 26,000+ physical site events, and 73,165 monthly US equipment import rows spanning 17 HS6 product codes by origin country across 104 months from January 2018 through August 2026 (measured October 25, 2026). Imports are industry context by product code and origin country, not company-level shipments.
Why combine quarterly corporate capital expenditure rows with state air-quality permitting and regional equipment import series? Because each series captures a distinct stage of the physical AI hardware and construction cycle. Quarterly capital expenditure filings reflect aggregate corporate cash outflows on a reporting lag, whereas state air-quality permits and federal air-program registrations mark site-level capacity commitments on specific campuses across Virginia, Texas, Georgia, Arizona, and Ohio. Meanwhile, monthly US equipment import flows across 17 harmonized product codes—covering transformers, switchgear, servers, cooling assemblies, and optical networking gear—provide an early, industry-wide barometer of supply-chain throughput across 104 consecutive months.
Notice also how multi-state permitting heterogeneity affects cross-regional comparisons. Virginia provides detailed facility-level air-permit documents naming backup-generator makes and permitted megawatt totals across 109 of 123 ticker-linked sites (88.6%), whereas Ohio maintains no centralized state air-permit portal, making federal air-program registrations the primary public compliance trail in Ohio. By normalizing both state-level permits (46 in Georgia, 34 in Texas, 17 in Arizona) and federal registrations (79 of 81 sites, or 97.5% across Texas, Georgia, Ohio, and Arizona) onto a unified campus schema, researchers can compare buildout velocity across jurisdictions without mistaking missing state portals for absent construction.
Accuracy Gates: 100% Sampled Precision Across 12 Physical Infrastructure Record Types
Every record type in Feed 2 ships only after passing a minimum 95% sampled accuracy audit against the original public documents. Across 12 Feed 2 record types audited in October and November 2026, every category achieved 100% sampled precision against primary source records.

This pre-release accuracy gate is enforced mechanically rather than treated as an informal spot check. Sampled rows across all 12 categories—from 173 site-owner links and 200 power-plant owner links to 101 air permits, 157 substation distances, 163 grid-zone assignments, 200 daily grid-load rows, 200 monthly satellite observations, 58 backup-generator megawatt checks, 96 and 60 equipment-import checks, 60 quarterly capex rows, and 60 county land-use records—are verified directly against the original public filing or registry entry. Any category falling below the 95% minimum accuracy threshold is held out of production release and excluded from institutional sample packs until entity-resolution or parsing defects are corrected and re-verified.
| Record Type | Sampled Precision | Verified Rows | Audit Notes |
|---|---|---|---|
| Site Owner Links | 100% | 173 / 173 | Parent entity & ticker attribution |
| Power-Plant Owner Links | 100% | 200 / 200 | Effective-dated utility ownership |
| Site Air Permits | 100% | 101 / 101 | Dated permit issue & modification |
| Nearest ≥115 kV Substation | 100% | 157 / 157 | Geospatial distance verification |
| Grid Zone & Daily Load | 100% | 163 / 163 & 200 / 200 | Balancing area & sub-zone demand |
| Monthly Satellite Measurements | 100% | 200 / 200 | Audited November 12, 2026 |
| Backup-Generator MW | 100% | 58 / 58 | 2 additional rows not checkable |
| Equipment Imports (HS6 × Country) | 100% | 96 / 96 & 60 / 60 | Product code & origin country |
| Quarterly Capex & Land Records | 100% | 60 / 60 & 60 / 60 | XBRL cash-flow & county parcel checks |
Known Data Limitations and Structural Boundaries
Institutional due diligence requires documenting where a dataset stops rather than glossing over coverage edges. Five structural boundaries govern physical AI-infrastructure telemetry across all 57 universe tickers and 25 tables:
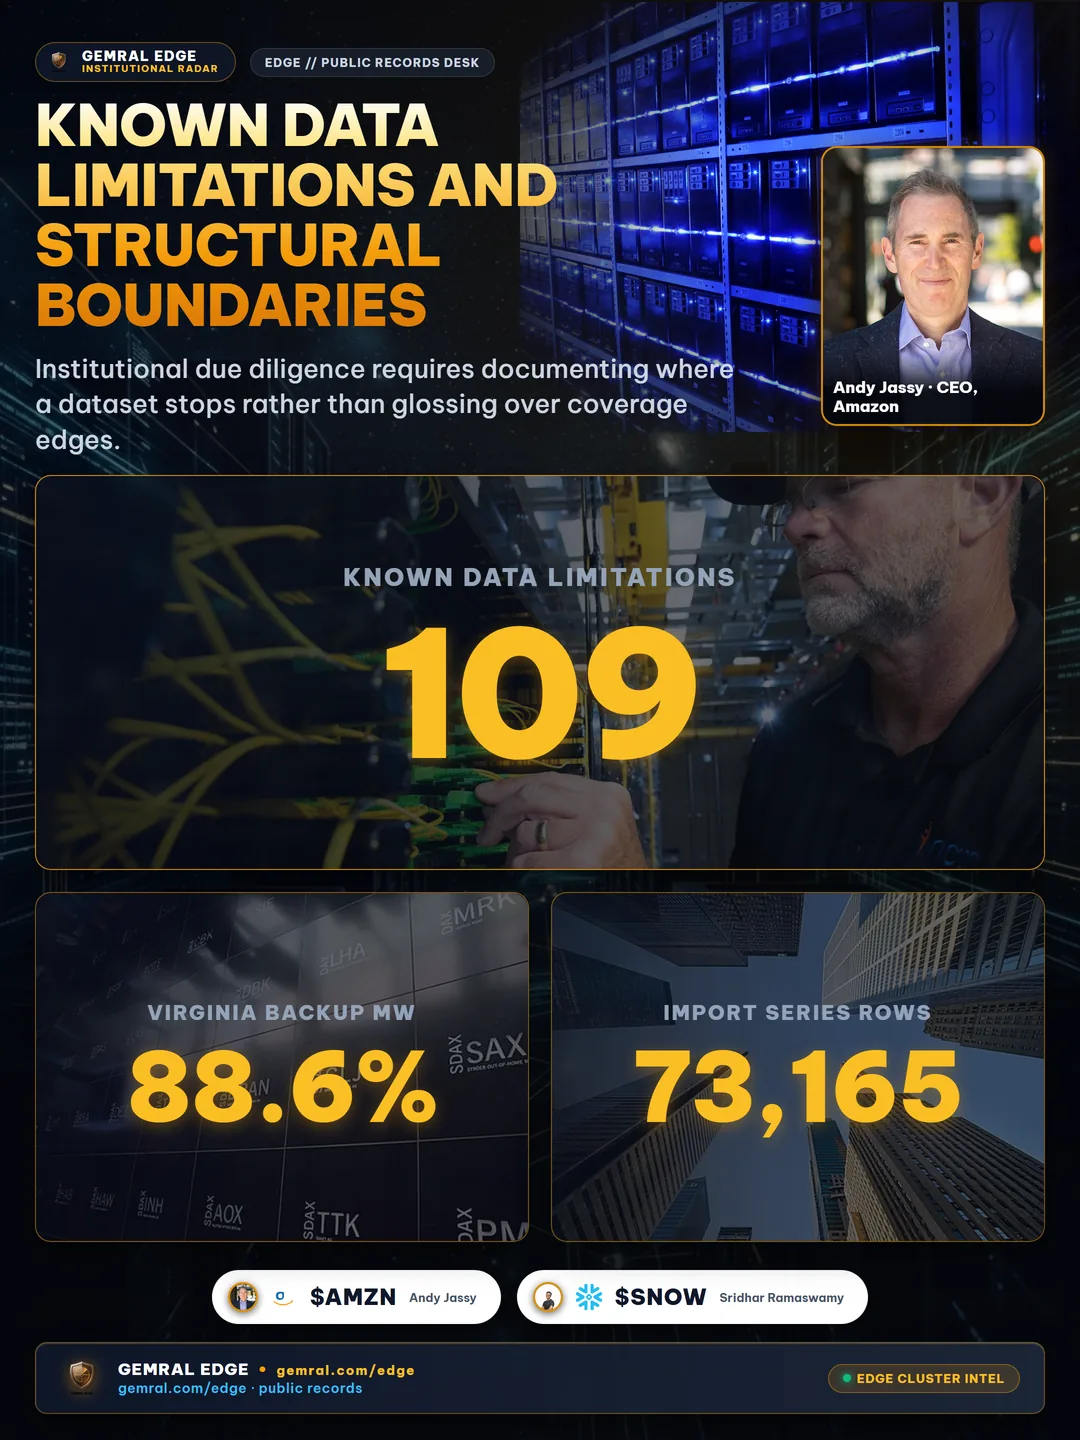
- Backup MW vs. IT Load: Permitted backup-generator MW is an upper bound on on-site backup capacity, not IT load; we do not convert it. Across Virginia (109 of 123 ticker-linked sites, 88.6%) and Georgia (8 sites, 10 MW records), these figures reflect emergency backup ceilings stated on air permits rather than continuous electrical draw.
- Historical Permit Backfill: Most data-center permit events (289 of 292, measured November 12, 2026) were loaded from historical records, so their publication date is set to the permit issue date; we began recording new permits as they appear only in late 2026. Treat permit history as a dated reference, not as a point-in-time record for backtests.
- Industry-Level Equipment Imports: Imports are industry context by product code and origin country, not company-level shipments. Across 73,165 monthly rows (17 HS6 codes over 104 months from January 2018 through August 2026), trade statistics measure aggregate US import flows by harmonized product category rather than individual corporate purchase orders.
- Single-County Land Records: County land-use and building records (245 permitted buildings, 139 data-center parcels, and 85 planned project areas, measured November 20, 2026) cover one county and start on October 20, 2026; the accuracy check confirms faithful copying, not the issuer's own completeness. Floor area is not converted to MW.
- Revision Log Start Date: The revision log started in October 2026, meaning line-item amendment history begins from that deployment date forward.
Documenting these five boundaries explicitly inside both the technical specification and the Due Diligence Questionnaire allows quantitative data-sourcing teams to configure strict temporal filters before running any model. Rather than discovering an undocumented backfill or unit mismatch months into a research sprint, engineering teams can align their ingestion schemas with exact coverage dates on day one.
Delivery Architecture: Parquet Sample Packs, REST API, and MCP Integration
Physical AI-infrastructure telemetry is delivered in three production formats designed for quantitative pipelines, fundamental research desks, and AI-assisted analyst workflows. Bulk historical delivery ships as Parquet files accompanied by SHA-256 verification manifests, row-count summaries, a complete data dictionary, and quickstart notebooks. The latest verified Feed 2 sample pack (built November 20, 2026) contains 176 Parquet files across 25 tables totaling 427,261 rows for all 57 universe tickers, with zero external URL leakage across all scanned cells.
For programmatic workflows, a read-only REST API (supporting physical infrastructure resources), webhooks, and an MCP server for AI assistants expose the same entity-resolved records. On request, the identical Parquet files can be pushed to a fund's own cloud bucket (Amazon S3, Google Cloud Storage, or Azure), delivered over sFTP, or formatted for loading into Snowflake or Databricks from the fund's own storage.
Every Parquet delivery bundle includes deterministic partition layouts, typed schemas, and a machine-readable manifest listing SHA-256 checksums and exact row counts for all 176 files. Automated verification checks confirm zero unescaped URLs and full referential integrity across all 25 tables prior to release, ensuring data engineering teams can ingest updates into internal lakehouses with minimal custom glue code. Whether a systematic research desk queries physical site events directly through REST endpoints, connects an internal assistant via the MCP server, or loads monthly Parquet snapshots into cloud data warehouses, every delivery channel enforces identical point-in-time timestamps and entity-resolution keys. That parity guarantees that exploratory queries in an interactive notebook match production batch pipelines down to the exact row and publication date.
How Institutional Funds Evaluate Physical Telemetry: Sample Packs and DDQ
Institutional data sourcing teams evaluate physical AI-infrastructure telemetry through a structured technical review before licensing. Sample packs (176 Parquet files, 25 tables, 427,261 rows across 57 tickers) are issued via a private, per-fund download link with a 14-day expiration window upon email request, alongside the complete Due Diligence Questionnaire (DDQ), data dictionary, and methodology documentation. Fund licensing is quoted on request by email.

During a standard 14-day evaluation, data teams typically audit three components: first, sample-level alignment between physical site records and original public filings (verified at 100% precision across 12 record types); second, temporal separation between event dates and public availability timestamps; and third, compatibility between the 25-table Parquet schema and the fund's internal security master. Engineering and compliance teams can validate each schema column, publication timestamp, and historical coverage boundary directly against the published data dictionary and Due Diligence Questionnaire before initiating a full historical production feed.
To inspect live sample rows immediately or review physical infrastructure coverage across the 57-company universe, explore the data at gemral.com/edge/data-preview or visit gemral.com/edge/tech. For related analyses, see our sovereign AI infrastructure guide and AI data center power case study.
Public data · not investment advice. Data comes only from public sources and contains no material non-public information.
Frequently asked questions
What does AI infrastructure physical telemetry cover?
It covers 57 US-listed AI-infrastructure companies across data-center sites (88.9% owner coverage across 513 of 577 sites), state and federal air permits, ≥115 kV substation proximity (93.0% within 5 km), daily regional grid demand, power-plant lifecycle changes, quarterly capex (3,216 rows across 55 tickers), monthly equipment imports (73,165 rows), and monthly satellite surface measurements.
How does point-in-time entity resolution prevent look-ahead bias?
Joining site events through today's parent table instead of the owner valid on the publication date would misattribute 40 of 169 permit events (23.7%) and 70 of 687 power-plant status events (10.2%). Point-in-time resolution anchors each event to the parent company and ticker valid on its public release date.
What are the known limits of Feed 2 physical AI infrastructure data?
Permitted backup-generator MW is an upper bound on backup capacity rather than IT load; most historical permit events (289 of 292) were backfilled with publication dates set to permit issue dates; equipment imports reflect industry context by product code and origin country rather than company shipments; and county land-use records cover one county starting October 20, 2026.
How can institutional funds evaluate the Feed 2 sample pack and DDQ?
Institutional teams can inspect live sample rows at /edge/data-preview or request a private 14-day Parquet sample pack (176 files, 25 tables, 427,261 rows) and DDQ by email.