
AI Data Center Power: Case Study in Backup-Generator Permits, Owner Resolution, and Grid Proximity
A forensic walkthrough of dated state air permits, holding-entity owner resolution, and high-voltage substation telemetry across Virginia data center campuses operated by Microsoft (MSFT) and Digital Realty Trust (DLR).
The AI Data Center Power Visibility Gap: Why Quarterly Capex Filings Lag Physical Permits
Institutional investors evaluating AI data center power infrastructure face a persistent visibility lag in corporate financial statements. Quarterly capital expenditure disclosures aggregate global spending across servers, real estate, cooling equipment, and software into a single consolidated dollar figure—offering zero site-level visibility into where megawatts of backup generation are being permitted, which regional electric grid zone will supply the load, or which listed holding company actually owns an LLC-registered campus.
Physical infrastructure records resolve this blind spot before equipment is fully energized. Across 57 US-listed AI-infrastructure companies spanning 7 distinct industry groups (hyperscalers, AI clouds, data-center operators, chips and servers, optics, power and cooling, and utilities, measured November 11, 2026), dated air-permit modifications, federal air-program registrations, substation coordinates, and monthly satellite measurements reveal physical expansion milestones campus by campus.
To illustrate how raw government environmental filings translate into ticker-resolved telemetry—and where naïve data pipelines fail—this case study examines three verified Virginia campuses inside the DOM regional grid balancing area, comparing direct corporate filings against LLC-obscured holding entities.
Case Study Timeline: Tracing 408.05 MW and 125.0 MW MSFT Campus Permits in Virginia
In northern Virginia's Dominion Energy (DOM) balancing area, hyperscale campuses require state environmental air permits whenever diesel or natural-gas backup generators are installed or expanded. Inspecting verified permit records for two Microsoft Corporation (MSFT) campuses demonstrates how sequential permit modifications track multi-year campus scaling:

| Campus & Ticker | Event Date | Filing Type | Permitted Capacity / Output | Substation Link |
|---|---|---|---|---|
| MSFT East Coast DC | Sep 19, 2023 | Permit Modification | 408.05 MW Backup | 0.42 km to 115 kV |
| MSFT East Coast DC | Apr 24, 2024 | Permit Modification | 408.05 MW Backup | 0.42 km to 115 kV |
| MSFT East Coast DC | Dec 31, 2024 | Emissions Reported | 36.58 tpy NOx | DOM Grid Zone |
| MSFT AVC43 DC | Jul 12, 2023 | New Permit Issued | 125.00 MW Backup | 2.56 km to 115 kV |
| DLR Center N LLC | Oct 04, 2017 | Permit Modification | 283.175 MW Backup | 0.51 km to 230 kV |
| DLR Center N LLC | Mar 14, 2025 | Permit Modification | 84.225 MW Backup | 0.51 km to 230 kV |
At the Microsoft East Coast Data Center campus, state environmental records document two consecutive permit modifications—dated September 19, 2023 and April 24, 2024—establishing a permitted backup-generator ceiling of 408.05 MW, followed by an annual emissions filing on December 31, 2024 reporting 36.58 tons per year (tpy) of nitrogen oxides (NOx). Meanwhile, the nearby Microsoft AVC43 Datacenter received a new air permit on July 12, 2023 covering 125.0 MW of permitted backup generation capacity. Across Virginia's tracked primary sites (measured October 19, 2026), 92.2% (107 of 116 ticker-linked sites) carry permitted backup-generator MW across 171 of 194 total permits.
Holding-Entity Owner Resolution: Linking Center N LLC (283.175 MW) to Digital Realty (DLR)
While Microsoft frequently files permits under its direct corporate name, real estate investment trusts (REITs) and colocation developers overwhelmingly register data center campuses under single-purpose Limited Liability Companies (LLCs). A raw keyword search for "Digital Realty" across state environmental portals misses dozens of major campuses entirely.
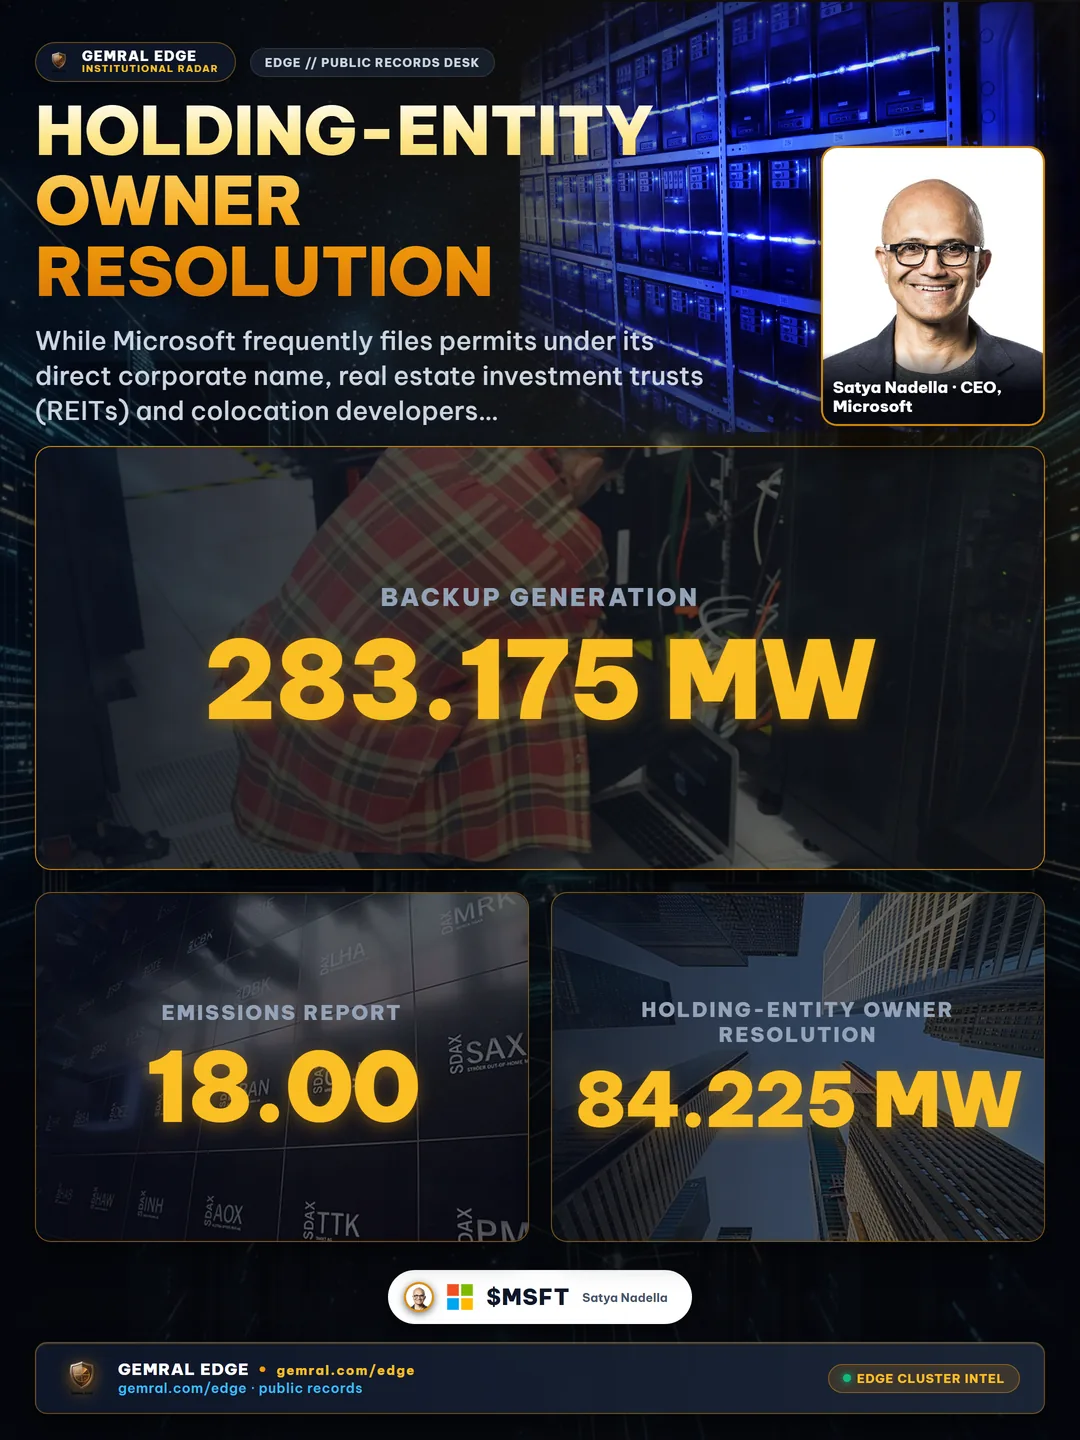
Consider the Virginia facility registered on air permits as "Center N LLC". On October 4, 2017, Center N LLC received a permit modification for 283.175 MW of backup generation, followed by an emissions report of 18.00 tpy NOx on December 31, 2024, and a subsequent permit modification on March 14, 2025 covering 84.225 MW. Without entity resolution linking the subsidiary LLC back to its publicly traded parent, an automated scraper treats Center N LLC as an uninvestable private entity.
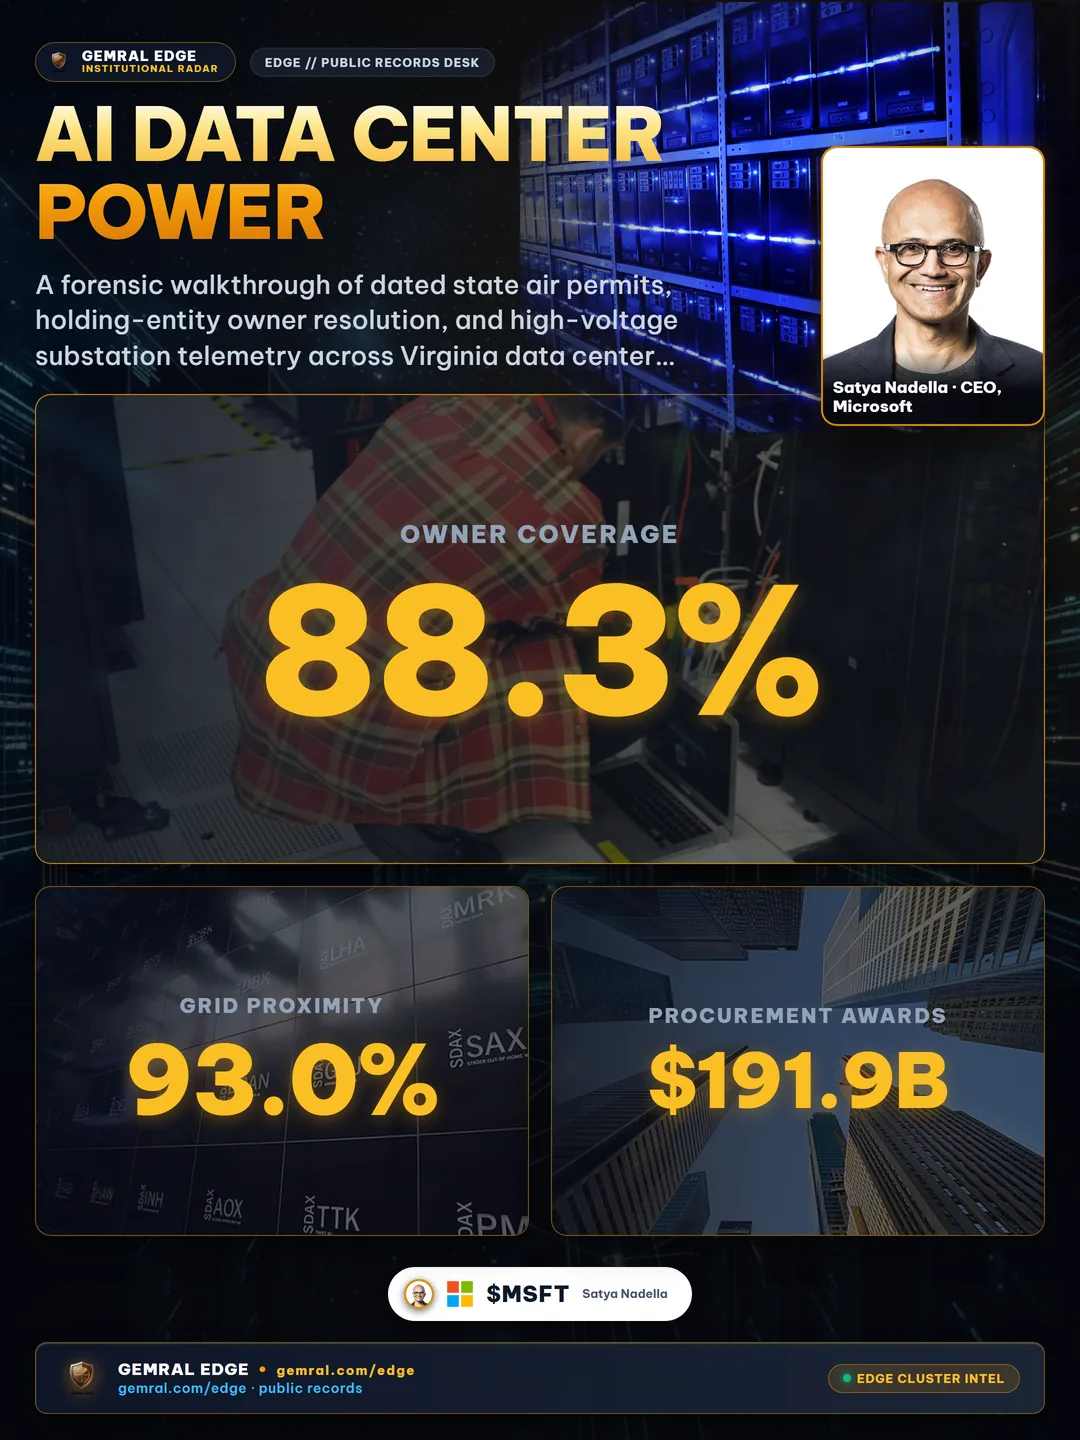
By chaining corporate property deeds, tax parcel records, and parent-subsidiary disclosures, verified entity resolution maps 88.3% of all tracked data-center campuses (492 of 557 sites, measured November 11, 2026) to an identified listed owner or owner category—resolving Center N LLC cleanly to Digital Realty Trust (DLR). Just as dated subsidiary links in federal contracts resolve $191.9 billion in procurement awards, physical owner resolution ensures campus capacity maps accurately to listed equity tickers.
Grid Proximity and Substation Telemetry: Measuring 0.42 km to 115 kV and 230 kV Nodes
Air permits capture on-site backup generation, but primary compute operations depend on continuous utility transmission delivery. Pairing geocoded campus boundaries with high-voltage transmission infrastructure reveals why data-center clusters form tight geographic corridors around major electrical substations.
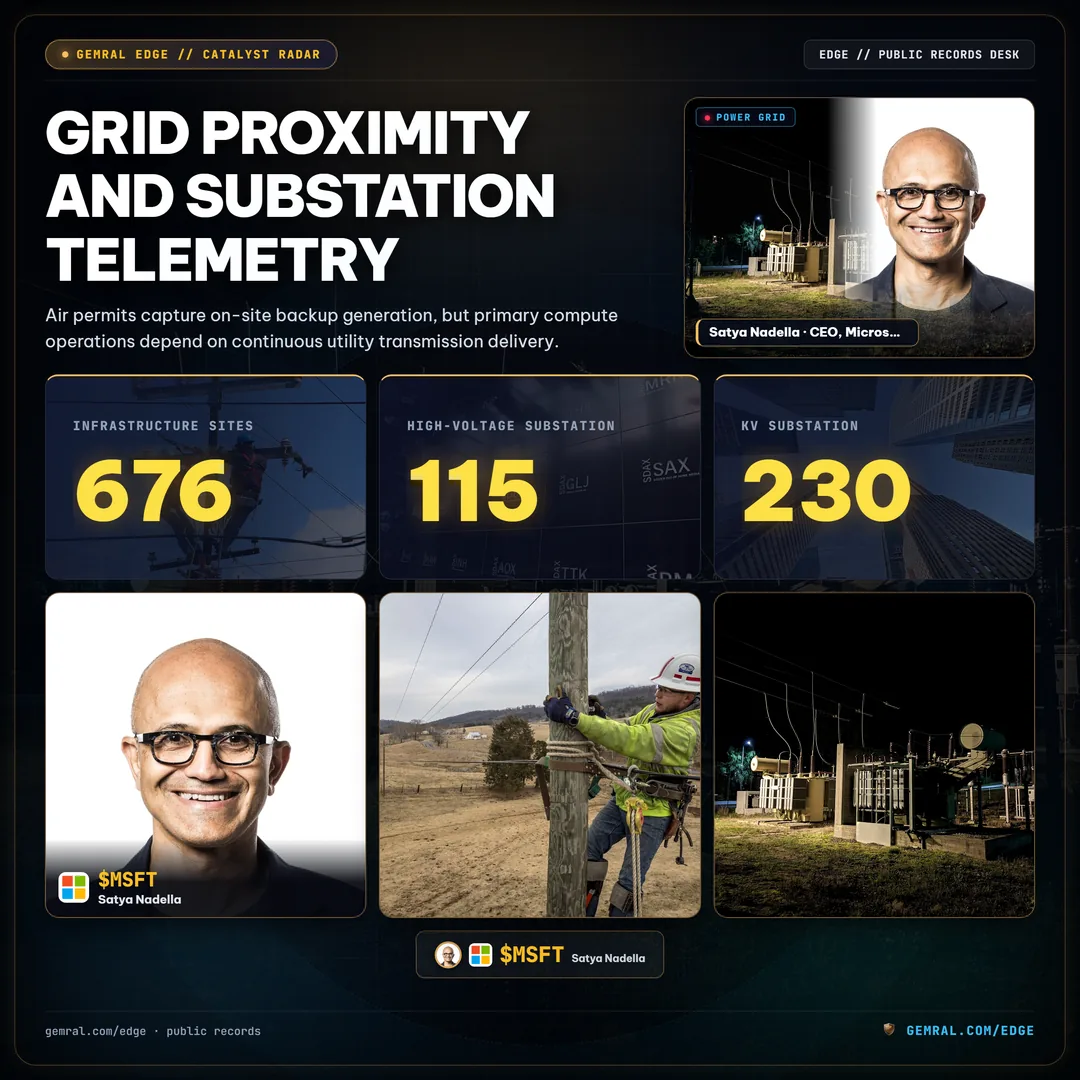
Across 676 tracked infrastructure sites (measured October 18, 2026), 93.0% (629 sites) sit within 5.0 kilometers of a high-voltage substation rated at 115 kV or higher, with a median distance of 1.02 km. In our verified case study cohort, Microsoft's East Coast campus sits just 0.42 km from a 115 kV substation, Digital Realty's Center N LLC sits 0.51 km from a 230 kV substation, and Microsoft's AVC43 campus sits 2.56 km from a 115 kV node—all drawing from the DOM grid balancing area where daily regional electricity load has been tracked continuously since 2019. For deeper analysis of substation bottlenecks, review our technical breakdown of data center substation queues and transformer lead times.
Critical Methodological Boundary: Why Permitted Backup MW Is Not IT Compute Load
The most dangerous analytical error when using environmental air permits to model AI compute capacity is equating permitted backup-generator megawatts directly with live IT power draw. Institutional data diligence requires observing three strict physical and engineering boundaries:
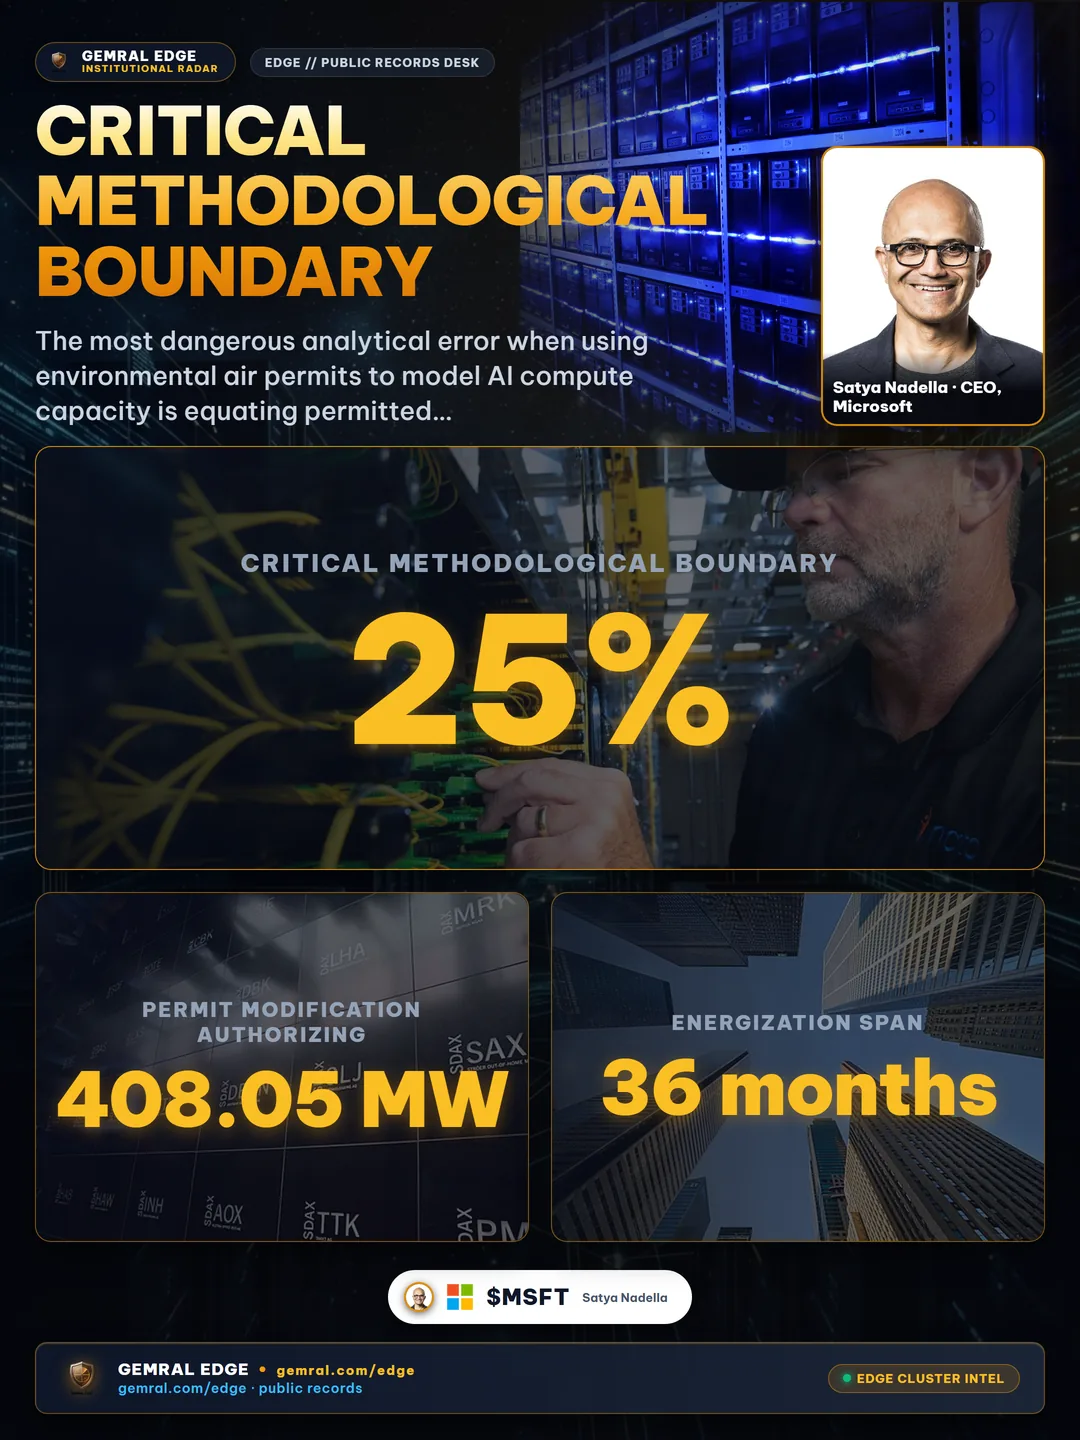
- 01. Upper Bound on Backup Capacity, Not IT Load: Permitted backup-generator MW represents an upper bound on on-site emergency generation capacity, not IT compute load. Operators routinely permit N+1 or 2N redundant generator arrays (adding 25% to 100% overhead) alongside mechanical cooling power (PUE of 1.15 to 1.35), and we do not convert backup MW into IT load.
- 02. Phased Installation vs Full Buildout: A permit modification authorizing 408.05 MW of backup engines grants environmental clearance for future phases; actual engine installation and utility substation energization can span 12 to 36 months after the permit issue date.
- 03. Emissions Signals vs Static Ceilings: Annual NOx emissions filings (such as 36.58 tpy at MSFT East Coast and 18.00 tpy at DLR Center N) confirm that permitted backup engines are actively installed, tested, and undergoing periodic maintenance runs rather than remaining unbuilt paper plans.
Cross-State Permit Architecture: Comparing Virginia, Georgia, Arizona, and Texas Coverage
Because environmental air permitting is administered at the state and local level in the United States, data availability varies sharply across major AI data-center hubs. Multi-state infrastructure telemetry must normalize heterogeneous state registries alongside federal air-program registrations:
Measured on November 11, 2026 across primary campuses outside Virginia, state air-permit records cover 46 permits in Georgia (25 new permits and 21 modifications), 17 permits in Arizona (8 new and 9 modifications, with 10 carrying explicit issue dates), and 34 permits in Texas (11 new and 23 modifications). Earlier measurements on October 19, 2026 confirmed 8 Georgia campuses with 10 explicit permitted backup-generator MW records, while 97.5% of known primary campuses across Texas, Georgia, Ohio, and Arizona (79 of 81 sites) carry federal air-program registration records—crucial in jurisdictions like Ohio that lack a centralized state air-permit portal.
Transparency and Limitations: Navigating Backfilled Historical Permit Dates
Rigorous quantitative research requires disclosing timestamp limitations before integrating physical telemetry into historical models. As documented in our data quality audit (measured November 12, 2026), most historical data-center permit events (289 of 292 records) were loaded from historical archives, meaning their recorded publication timestamp equals the permit issue date rather than the exact date an external observer first scraped the state portal. Automated tracking of new permits as they appear began in late 2026.

Consequently, quantitative analysts must treat pre-late-2026 permit history as a dated engineering reference rather than a strict point-in-time feed for historical trading evaluations. By contrast, when combining physical campus layers with monthly satellite measurements (built-up index and surface heat, 2023 onward) and power-plant status changes (2021 onward, where 1,118 US power plants moved from planned to operating over a median of 16 months, measured October 24, 2026), researchers gain verifiable multi-layer confirmation of regional power capacity expansion.
Multi-Layer Infrastructure Integration: Linking Campuses to Power Plants and Equipment Imports
In a complete physical AI-infrastructure framework, campus air permits operate alongside five complementary public layers: county land-use records covering one county (239 permitted buildings, 139 data-center parcels, and 85 planned project areas, measured October 20, 2026), nearest high-voltage substations, daily regional grid demand, quarterly capital expenditures across 51 of 57 universe tickers, and monthly US international equipment imports across 17 product codes (73,165 rows from January 2018 through August 2026, measured October 25, 2026; serving strictly as industry context by product code and origin country, not company-level shipments).
Cross-referencing physical campus buildouts with nuclear SMR power agreements, data center liquid cooling supply chains, and recent federal infrastructure contract awards ($2.409B FLR) provides portfolio managers with an auditable map of physical capacity growth across the AI hardware cycle.
Frequently asked questions
Does permitted backup-generator MW equal actual AI data center IT power load?
No. Permitted backup-generator MW disclosed in state air permits represents an upper bound on on-site emergency generation capacity, not actual IT compute load. Analysts apply their own utilization and redundancy assumptions rather than converting backup MW directly into IT load.
How does owner resolution connect LLC-named data center campuses to public tickers?
Data center operators frequently register air permits and land parcels under holding LLCs (such as Center N LLC) rather than the parent ticker. Point-in-time entity resolution maps 88.3% of tracked campuses (492 of 557 sites, measured November 11, 2026) to their listed parent company.
How close are major AI data center campuses to high-voltage grid substations?
Across tracked physical infrastructure sites (measured October 18, 2026), 93.0% (629 of 676 sites) are located within 5 kilometers of a >=115 kV substation, with a median distance of 1.02 km—such as 0.42 km for Microsoft's East Coast campus and 0.51 km for Digital Realty's Center N campus in Virginia.
Can historical data center air permits be used directly for point-in-time historical evaluations?
Most historical data center permit events (289 of 292 records, measured November 12, 2026) were loaded from historical records with publication dates set to permit issue dates; new permits began recording as they appear in late 2026. Historical permit archives should be treated as dated references.