Insider Buy vs Sell Ratio Across Federal Contractors and Capitol Hill Holdings
Across 35,102 corporate executive and director equity transactions spanning 3,632 distinct tickers, the market-wide insider buy vs sell ratio stands at 0.3054 by transaction count—reflecting 8,212 open-market purchases (Transaction Code P) against 26,890 open-market sales (Transaction Code S), or 1 purchase for every 3.27 sales. On a dollar-weighted basis, corporate insiders purchased $13,497,688,004.86 ($13.50 billion) of company stock on the open market while selling $197,080,764,618.47 ($197.08 billion), producing a raw dollar ratio of 0.0685 ($1.00 bought per $14.60 sold). Researchers monitoring the live corporate insider trading tracker can immediately see why raw headline ratios mislead investors who fail to separate automated Rule 10b5-1 liquidity dispositions from discretionary cash commitments.
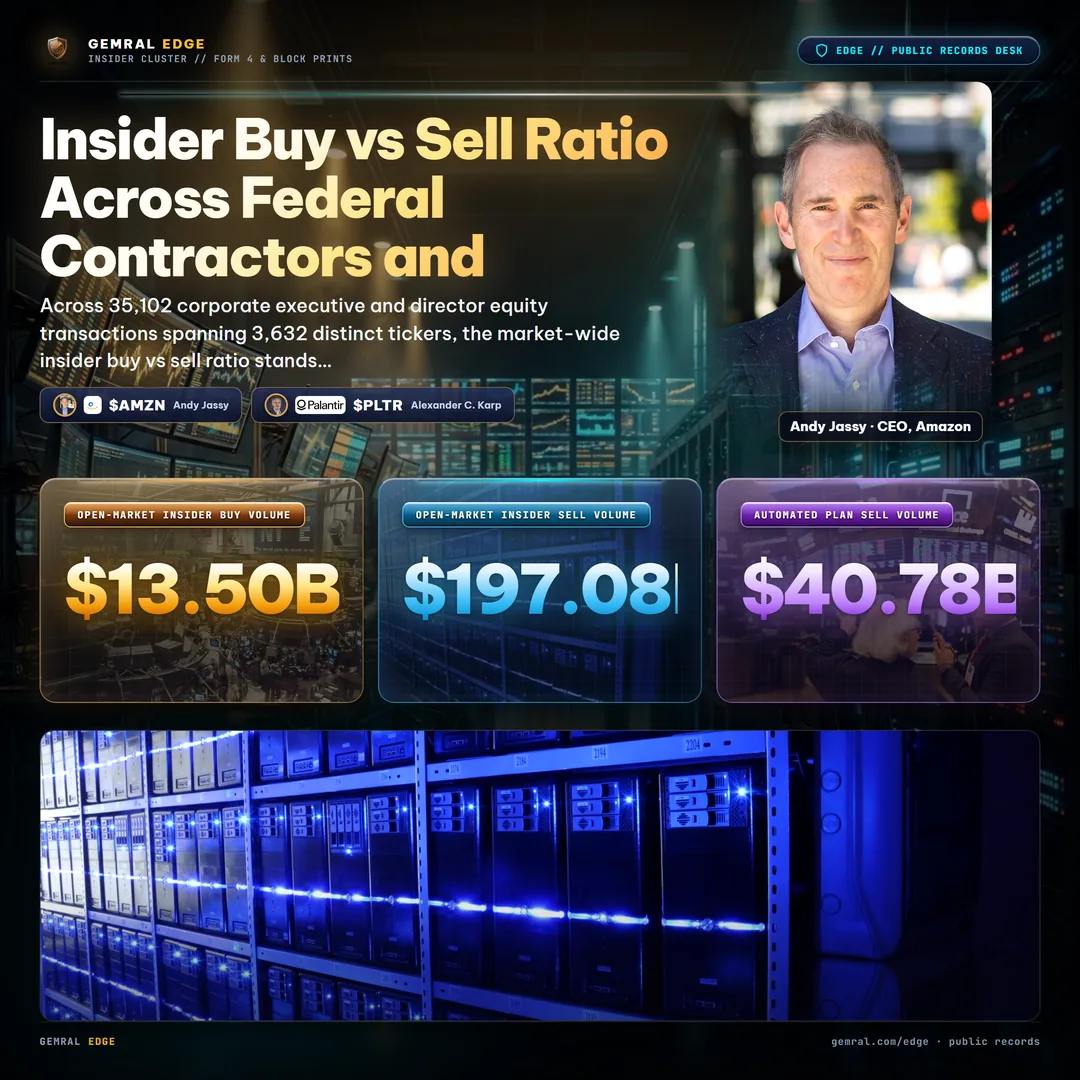
When we strip out pre-scheduled trading plans authorized under SEC Rule 10b5-1 amendments, the structural picture shifts dramatically. Out of 26,890 open-market sale transactions, 12,704 filings (47.2%) are automated Rule 10b5-1 sales totaling $40,781,004,845.88 ($40.78 billion, or 20.7% of all dollar sales), whereas 7,917 of the 8,212 open-market purchases (96.4%) are unscheduled, opportunistic buys. Removing automated Rule 10b5-1 transactions causes the opportunistic insider buy vs sell ratio to nearly double from 0.3054 to 0.5581—representing 1 discretionary open-market purchase for every 1.79 discretionary sales. Cross-referencing this baseline against 4,197 federal contract records and 9,824 congressional transaction records in 2026 exposes sharp divergence between Washington's preferred equities and corporate boardroom conviction.
Insider Buy vs Sell Ratio in 2026: The 35,102-Transaction Baseline
Interpreting the corporate insider buy vs sell ratio requires establishing an empirical benchmark across the entire universe of SEC Section 16 officer and director disclosures. Under statutory reporting mandates, corporate officers, directors, and 10% beneficial owners must report open-market transactions within 2 business days of execution. Across our 35,102-transaction dataset covering 3,632 public companies, selling outpaces buying in aggregate volume because executive compensation is heavily weighted toward equity grants, restricted stock units, and performance options that insiders periodically convert into cash.

However, aggregate dollar volume masks substantial ticker-level accumulation. While total open-market sales reach $197.08 billion ($197,080,764,618.47) across 26,890 filings compared to $13.50 billion ($13,497,688,004.86) across 8,212 buy filings, individual company dispersion tells a much more balanced story. Across all 3,632 distinct tickers with Section 16 activity, exactly 1,219 companies (33.6%) recorded more open-market buy transactions than sell transactions, and 1,218 companies (33.5%) registered positive net dollar accumulation where insider purchases exceeded insider sales in total dollar value.
| Metric Dimension | Open-Market Buys (Code P) | Open-Market Sells (Code S) | Buy vs Sell Ratio | Structural Benchmark |
|---|---|---|---|---|
| All Section 16 Filings (Count) | 8,212 filings | 26,890 filings | 0.3054 | 1 buy per 3.27 sells across 3,632 tickers |
| Opportunistic Only (Count) | 7,917 filings (96.4%) | 14,186 filings (52.8%) | 0.5581 | 1 discretionary buy per 1.79 discretionary sells |
| Rule 10b5-1 Automated (Count) | 295 filings (3.6%) | 12,704 filings (47.2%) | 0.0232 | Pre-scheduled liquidity plans dominate selling |
| All Section 16 Filings (Dollar) | $13.50B ($13,497,688,004.86) | $197.08B ($197,080,764,618.47) | 0.0685 | $1.00 bought per $14.60 sold market-wide |
| Federal Contractors (148 Tickers) | 264 filings ($762.99M) | 1,439 filings ($27.83B) | 0.1835 (0.3616 opp.) | 1 buy per 5.45 sells (49.3% of sells are 10b5-1) |
| Capitol Hill Holdings (583 Tickers) | 615 filings ($2.82B) | 7,813 filings ($75.19B) | 0.0787 (0.1839 opp.) | 1 buy per 12.70 sells (57.2% of sells are 10b5-1) |
How to Calculate the Opportunistic Insider Buy vs Sell Ratio Without Rule 10b5-1 Noise
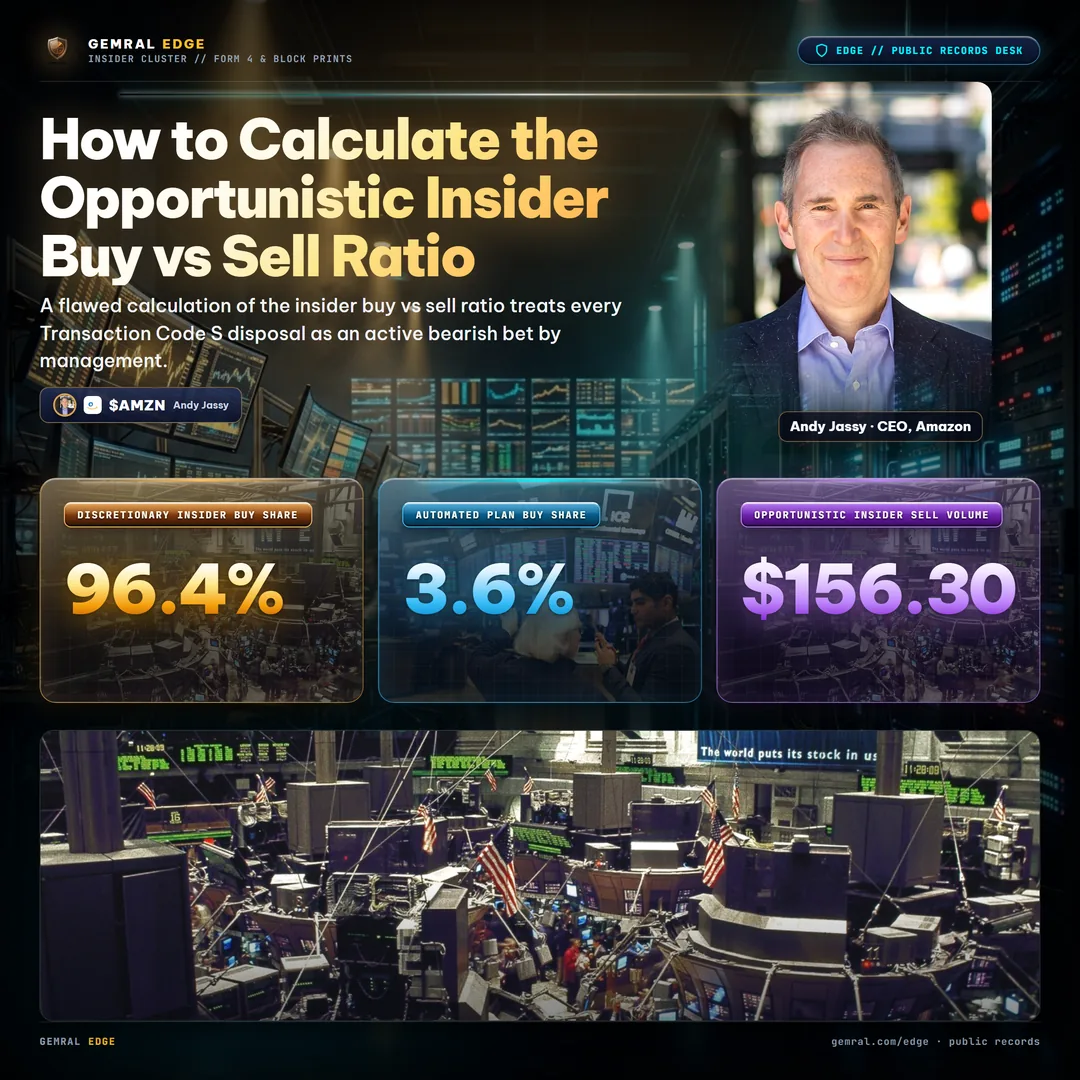
A flawed calculation of the insider buy vs sell ratio treats every Transaction Code S disposal as an active bearish bet by management. Since the Securities and Exchange Commission enforced mandatory cooling-off periods of 90 to 120 days and strict affirmative defense certifications for Rule 10b5-1 trading arrangements, corporate filings explicitly flag whether a transaction executed pursuant to a pre-scheduled Rule 10b5-1 contract. Separating these automated liquidity events from unscheduled trades is the foundational step in modern insider flow analysis.
In our 35,102-row dataset, the asymmetry between planned buying and planned selling is stark:
- Open-Market Purchases Are 96.4% Discretionary: Out of 8,212 open-market purchase filings, 7,917 represent opportunistic, unscheduled decisions by officers and directors to deploy personal capital at prevailing market prices. Only 295 purchase filings (3.6%) occurred under a pre-arranged Rule 10b5-1 plan.
- Nearly Half of Open-Market Sales Are Automated: Out of 26,890 open-market sale filings, 12,704 transactions (47.2%) executed automatically under Rule 10b5-1 plans, accounting for $40,781,004,845.88 ($40.78 billion, or 20.7% of total dollar sales). The remaining 14,186 sale transactions (52.8%) represent opportunistic sales totaling $156,299,759,772.59 ($156.30 billion, or 79.3% of dollar sales).
- The Opportunistic Adjustment Formula: Dividing the 7,917 opportunistic purchases by the 14,186 opportunistic sales yields an opportunistic insider buy vs sell ratio of 0.5581. Instead of 3.27 sales for every buy, true discretionary boardroom sentiment runs at just 1.79 opportunistic sales per opportunistic buy.
Looking solely at raw sell counts would classify both Amazon (AMZN) and Dell Technologies (DELL) as experiencing identical executive liquidation. In our contractor dataset, Amazon recorded 0 insider buys and 38 insider sales totaling $5,716,600,855.17 ($5.72 billion), while Dell recorded 0 insider buys and 69 insider sales totaling $3,389,701,916.46 ($3.39 billion). However, 100.0% of Amazon's 38 sales (all 38 filings) were pre-scheduled Rule 10b5-1 transactions (0 opportunistic sales), whereas 60 of Dell's 69 sales were unscheduled opportunistic dispositions and only 9 were Rule 10b5-1 sales.
Why Corporate Insider Buying vs Selling Carries Asymmetric Conviction
Why do institutional researchers treat an uptick in the insider buy vs sell ratio above 0.5581—or a ticker-level ratio above 1.00—as a primary quantitative signal? As classic financial literature and empirical market studies have long established, corporate executives sell shares for dozens of non-fundamental reasons: diversifying concentrated net worth, funding tax obligations upon equity vesting, estate planning, or executing pre-scheduled 90-day cooling-off diversification programs. An insider sale, particularly under Rule 10b5-1, rarely signals deteriorating operating fundamentals in isolation.
Conversely, an open-market purchase (Transaction Code P) carries a singular economic motive: the officer or director believes the equity is undervalued relative to near-term cash-flow catalysts and is willing to lock up after-tax personal capital under Section 16 short-swing profit recovery rules. Because Section 16 insiders forfeit any profits realized from matching purchases and sales within a 6-month window, open-market buying represents structural, multi-quarter conviction. As we highlighted in our recent audit of insider buying this week across public filings, the strongest signal emerges when multiple officers within the same enterprise execute cluster purchases within a tight calendar window while recording 0 opportunistic sales.
Comparing the Insider Buy vs Sell Ratio Across Federal Contractors and Capitol Hill Holdings
How does the market-wide 0.3054 insider buy vs sell ratio compare against two of the most closely watched institutional cohorts in 2026: companies winning federal government contracts and equities being accumulated by members of the U.S. Congress? By joining our 35,102 Section 16 insider filings with 4,197 federal procurement obligation records (spanning 212 distinct contractor tickers) and 9,824 congressional trade disclosures in 2026, we can measure executive conviction across both cohorts.
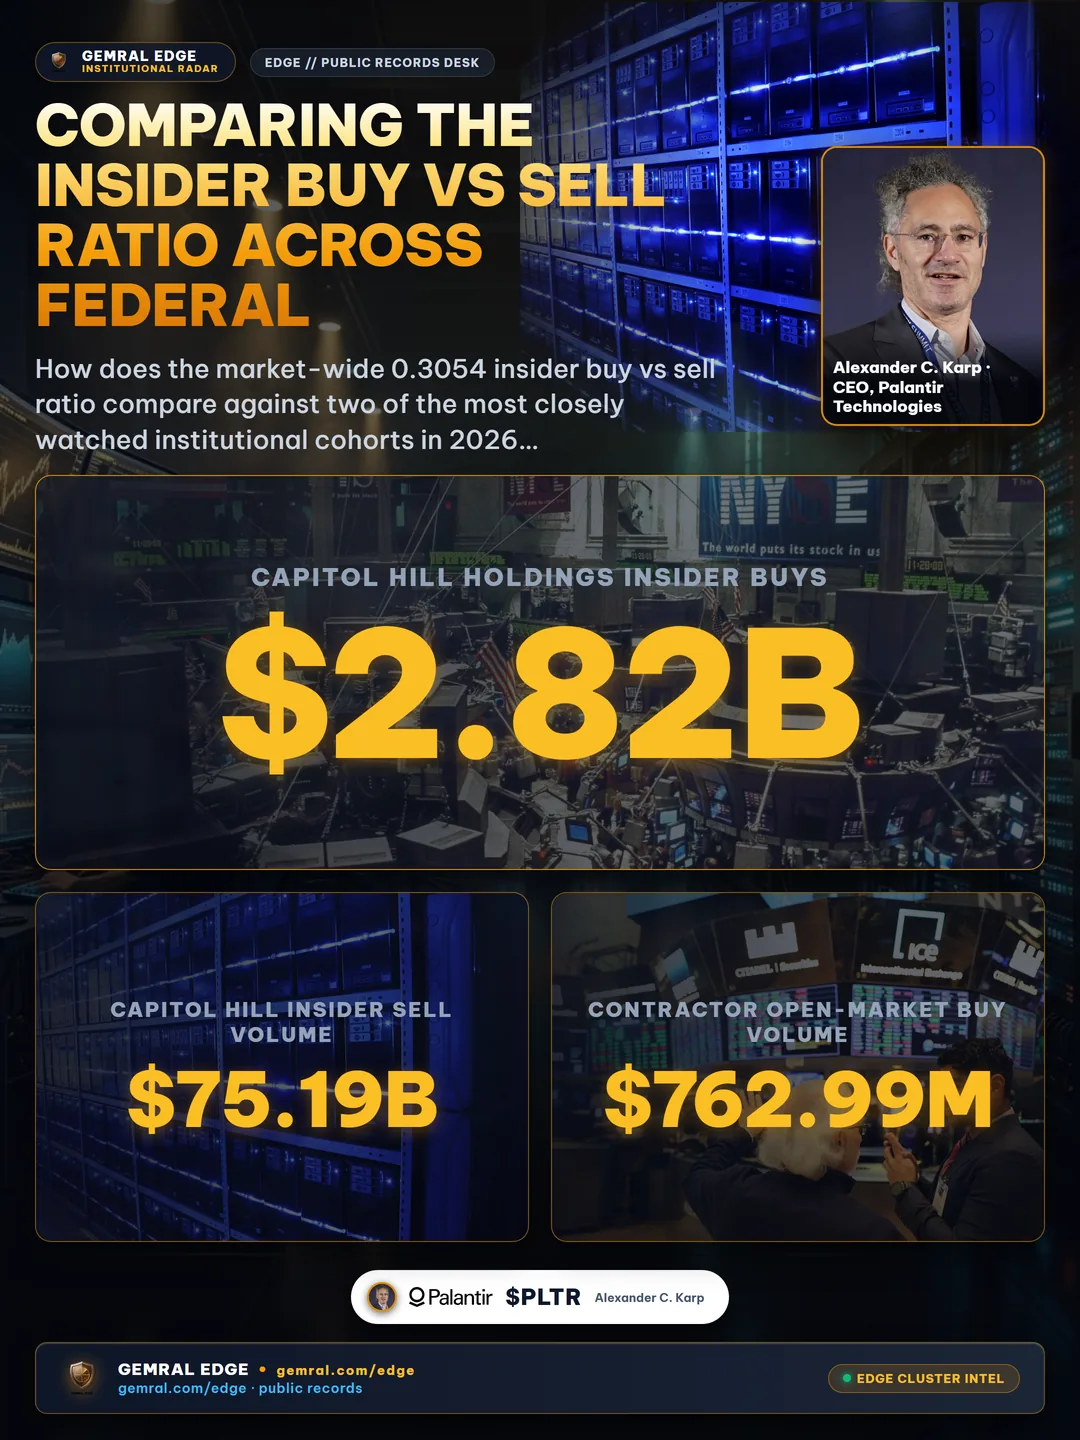
First, examine the Capitol Hill cohort. In 2026 Periodic Transaction Reports filed with the Office of the Clerk of the U.S. House of Representatives and the Senate within the statutory 30-day notification and 45-day maximum reporting window enacted under the 2012 STOCK Act, lawmakers logged 3,377 stock purchases against 3,266 sales—a net-positive congressional buy-to-sell ratio of 1.0340 across 743 purchased tickers. Yet within the 583 congressional buy tickers that also have corporate Section 16 filings, corporate insiders logged just 615 open-market purchases ($2,819,326,698.04 or $2.82 billion) against 7,813 open-market sales ($75,190,149,113.93 or $75.19 billion). That produces a raw corporate insider buy vs sell ratio of 0.0787 (1 buy per 12.70 sells), or 0.1839 after stripping out 4,468 automated Rule 10b5-1 sales (57.2% of sales in Capitol Hill holdings). Because lawmakers heavily favor mega-cap technology and growth leaders where executive pay is dominated by automated stock sales, Capitol Hill holdings exhibit a much lower insider buy ratio than the broader market.
Second, examine the federal contractor cohort. Across the 148 federal contractors with active Section 16 filings, corporate insiders recorded 264 open-market purchases totaling $762,987,740.38 ($762.99 million) against 1,439 sales totaling $27,830,215,514.00 ($27.83 billion). While the raw contractor count ratio is 0.1835 (1 buy per 5.45 sells, and a 0.0274 dollar ratio), removing the 709 Rule 10b5-1 sales (49.3% of contractor sales) lifts the contractor opportunistic ratio to 0.3616 (264 buys vs. 730 opportunistic sells)—nearly double the opportunistic ratio of Capitol Hill's broader holdings.
| Ticker | Federal Contracts (Total Obligations) | Insider Buys (Code P Value) | Insider Sells (Opp. vs. 10b5-1) | Ticker Buy/Sell Ratio | 2026 Congress Activity |
|---|---|---|---|---|---|
| EML | 7 contracts ($238,136,236.64) | 28 buys ($918,855.72) | 0 sells ($0) | 28 : 0 (100% Buy) | 0 buys · 0 sells |
| DLHC | 3 contracts ($38,231,527.82) | 20 buys ($1,709,136.00) | 0 sells ($0) | 20 : 0 (100% Buy) | 0 buys · 0 sells |
| MIAX | 1 contract ($4,855,054.06) | 17 buys ($3,144,390.74) | 6 sells (3 opp · 3 10b5-1 · $11.56M) | 2.83 raw (5.67 opp.) | 1 buy · 0 sells |
| MMS | 10 contracts ($5,235,526,745.42) | 9 buys ($360,609.36) | 3 sells (0 opp · 3 10b5-1 · $550,640.86) | 3.00 raw (9 : 0 opp.) | 0 buys · 0 sells |
| LUMN | 8 contracts ($683,900,359.95) | 7 buys ($1,581,730.05) | 1 sell (1 opp · 0 10b5-1 · $355,050.00) | 7.00 count (4.46 dollar) | 0 buys · 0 sells |
| AMCR | 1 contract ($20,639,022.79) | 7 buys ($2,856,558.78) | 3 sells (3 opp · 0 10b5-1 · $142,072.72) | 2.33 count (20.11 dollar) | 4 buys · 1 sell |
| SAIC | 43 contracts ($5,616,811,638.86) | 6 buys ($346,465.50) | 0 sells ($0) | 6 : 0 (100% Buy) | 0 buys · 0 sells |
| AIG | 20 contracts ($460,922,968.86) | 5 buys ($104,590.67) | 0 sells ($0) | 5 : 0 (100% Buy) | 1 buy · 0 sells |
| PLTR | 17 contracts ($305,386,999.30) | 0 buys ($0) | 47 sells (16 opp · 31 10b5-1 · $879.20M) | 0.00 (0 : 47) | 16 buys · 16 sells |
| DELL | 10 contracts ($303,538,046.00) | 0 buys ($0) | 69 sells (60 opp · 9 10b5-1 · $3.39B) | 0.00 (0 : 69) | 7 buys · 8 sells |
This forensic split reinforces our earlier multi-trail research on stocks Congress is buying across federal contracts and insider convergence and AI companies with government contracts and Pentagon procurement awards. High-visibility AI and hardware primes like Palantir Technologies (PLTR, 17 contracts for $305.39 million, 0 insider buys vs. 47 sales totaling $879,200,144.23) and Dell Technologies (DELL, 10 contracts for $303.54 million, 0 insider buys vs. 69 sales) attract heavy two-way congressional trading (16 buys and 16 sells in PLTR; 7 buys and 8 sells in DELL) while corporate executives exclusively sell shares. Meanwhile, lower-profile federal primes like Science Applications International Corp. (SAIC, 43 contracts for $5.62 billion, 6 insider buys for $346,465.50 and 0 sales) and Maximus, Inc. (MMS, 10 contracts for $5.24 billion, 9 insider buys for $360,609.36 and 0 opportunistic sales) exhibit 100% opportunistic insider buy ratios.
How to Track Live Insider Buy vs Sell Signals and Multi-Officer Cluster Purchases
Turning the insider buy vs sell ratio into an actionable screening discipline requires filtering out compensation noise and isolating multi-trail anomalies in real time. Rather than tracking unadjusted market aggregates, institutional analysts apply a 3-step filter across our public intelligence layers—where QUASAR POINT flags multi-trail cross-signal convergence, SUNSTRIKE captures rapid 2-business-day disclosure velocity, and DEEP FLOW monitors sustained dollar accumulation:
- Strip Rule 10b5-1 Dispositions Before Computing Ticker Ratios: Always separate automated Rule 10b5-1 sales (which represent 47.2% of all Section 16 sales market-wide and 57.2% across Capitol Hill holdings) from unscheduled opportunistic sales. A contractor like Maximus (MMS) appears to have a 3.00 raw buy-to-sell ratio (9 buys vs. 3 sells), but inspecting the Rule 10b5-1 flag reveals that all 3 sales were automated—leaving a 9-to-0 opportunistic purchase record.
- Require Both Count and Dollar Ratio Confirmation: Verify that a positive transaction count ratio is backed by meaningful open-market dollar volume. In Amcor (AMCR), 7 open-market insider purchases ($2,856,558.78) against 3 sales ($142,072.72) produce a 2.33 count ratio alongside a 20.11 dollar ratio, paired with $20.64 million in federal contract obligations and a 4-to-1 congressional buy-to-sell ratio. Similarly, Lumen Technologies (LUMN) pairs $683.90 million across 8 federal contracts with 7 insider buys ($1.58 million) vs. 1 sale ($355,050.00), achieving a 7.00 count ratio and a 4.46 dollar ratio.
- Cross-Reference Multi-Buyer Clusters Against Federal Backlog: Look for companies where multiple corporate insiders buy stock on the open market while federal agencies obligate multi-year contracts—such as The Eastern Company (EML, 28 insider buys for $918,855.72, 0 sales, $238.14 million across 7 contracts), DLH Holdings (DLHC, 20 insider buys for $1.71 million, 0 sales, $38.23 million across 3 contracts), and American International Group (AIG, 5 insider buys for $104,590.67, 0 sales, $460.92 million across 20 contracts, and 1 congressional buy).
Investors can screen all 35,102 Section 16 disclosures, filter out Rule 10b5-1 plans with one click on the insider trading tracker hub, and monitor real-time executive cluster buying via Gemral Edge Insider Intelligence.
Disclaimer: Public data · not investment advice. All corporate Section 16 insider filings, federal procurement obligations, and congressional Periodic Transaction Reports cited in this analysis are compiled strictly from official public disclosures for informational and educational research only.
Frequently asked questions
What is the average corporate insider buy vs sell ratio in 2026?
Across 35,102 corporate officer and director disclosures covering 3,632 public companies, the raw insider buy vs sell ratio is 0.3054 by transaction count—reflecting 8,212 open-market purchases (Transaction Code P) against 26,890 open-market sales (Transaction Code S), or 1 buy for every 3.27 sales. On a dollar-weighted basis, insiders purchased $13.50 billion and sold $197.08 billion, producing a 0.0685 dollar ratio ($1.00 bought per $14.60 sold).
How do Rule 10b5-1 trading plans affect the insider buy vs sell ratio?
Pre-scheduled Rule 10b5-1 trading plans account for 47.2% of all open-market insider sale transactions (12,704 of 26,890 sales, totaling $40.78 billion) but only 3.6% of open-market purchases (295 of 8,212 buys). When automated Rule 10b5-1 trades are excluded, the opportunistic insider buy vs sell ratio nearly doubles from 0.3054 to 0.5581 (7,917 discretionary purchases vs. 14,186 discretionary sales, or 1 buy per 1.79 sells).
What is considered a strong insider buy vs sell ratio for an individual stock?
While the market-wide transaction count baseline sits at 0.3054, any individual equity with an opportunistic insider buy vs sell ratio above 1.00—meaning discretionary open-market cash purchases exceed unscheduled sales—ranks in the top 33.6% of all 3,632 tracked companies (1,219 tickers). High-conviction cluster anomalies occur when multiple corporate officers buy shares on the open market with zero opportunistic sales.
How does the insider buy vs sell ratio compare between federal contractors and Capitol Hill holdings?
Among 148 federal contractors with active Section 16 filings, executives logged 264 open-market buys ($762.99 million) against 1,439 sales ($27.83 billion), yielding a 0.1835 raw count ratio and a 0.3616 opportunistic ratio after removing 709 Rule 10b5-1 sales. Across 583 equities bought by members of Congress in 2026, corporate insiders logged 615 buys ($2.82 billion) vs. 7,813 sales ($75.19 billion), a 0.0787 raw ratio where 57.2% of sales (4,468 filings) were automated Rule 10b5-1 dispositions.