Congress Stock Trades Tracker: Analyzing STOCK Act Disclosures by Committee and Volume
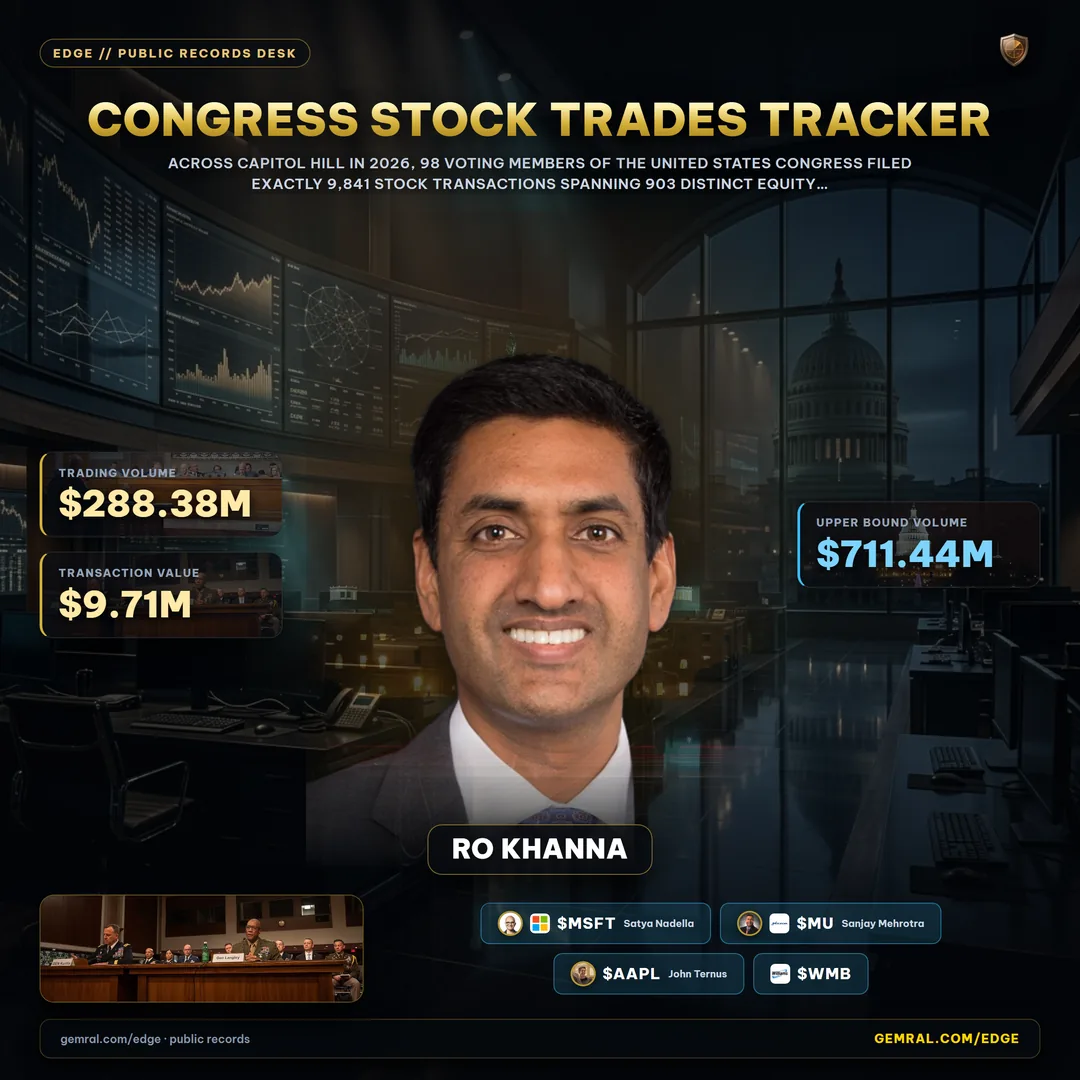
Across Capitol Hill in 2026, 98 voting members of the United States Congress filed exactly 9,841 stock transactions spanning 903 distinct equity tickers, generating an aggregate disclosed trading volume between $288.38M and $711.44M. Unlike corporate executives who face rigid blackout windows and scheduled liquidations, elected federal representatives trade under the Stop Trading on Congressional Knowledge Act of 2012 (STOCK Act). Market participants operating a dedicated congress stock trades tracker can immediately observe an unmistakable accumulation skew: congressional lawmakers filed 5,831 purchase transactions compared to 3,959 sales, producing a net buy-to-sell transaction ratio of 1.47 (59.3% buys versus 40.2% sales).
The informational value of a modern congress stock trades tracker lies not in chasing speculative political gossip, but in analyzing the structural intersection between legislative committee jurisdiction, regulatory oversight, and private capital allocation. While the median disclosed transaction value sits in the standard $1,001 to $15,000 tier, top-tier transactions reaching $1,000,000 to $5,000,000 and even $25,000,000 to $50,000,000 cluster heavily around enterprise cloud, defense contractors, and specialized domestic energy infrastructure. Tracking these capital flows through live intelligence tools like the congress ticker lookup tool reveals how institutional-scale personal portfolios navigate macroeconomic inflections.
Congress Stock Trades Tracker: Auditing 9,841 Disclosed Trades in 2026
The 9,841 congressional equity transactions disclosed in 2026 reflect an intense concentration of capital and activity. A quantitative audit of the public record indicates that trading is not evenly distributed across the 535 voting members of Congress. Instead, the top 10 most active lawmakers account for 8,574 of the 9,841 total filings—over 87.1% of all congressional transaction volume. The remaining 88 trading lawmakers accounted for 1,267 transactions, while hundreds of senators and representatives reported zero personal equity trading activity during the year.
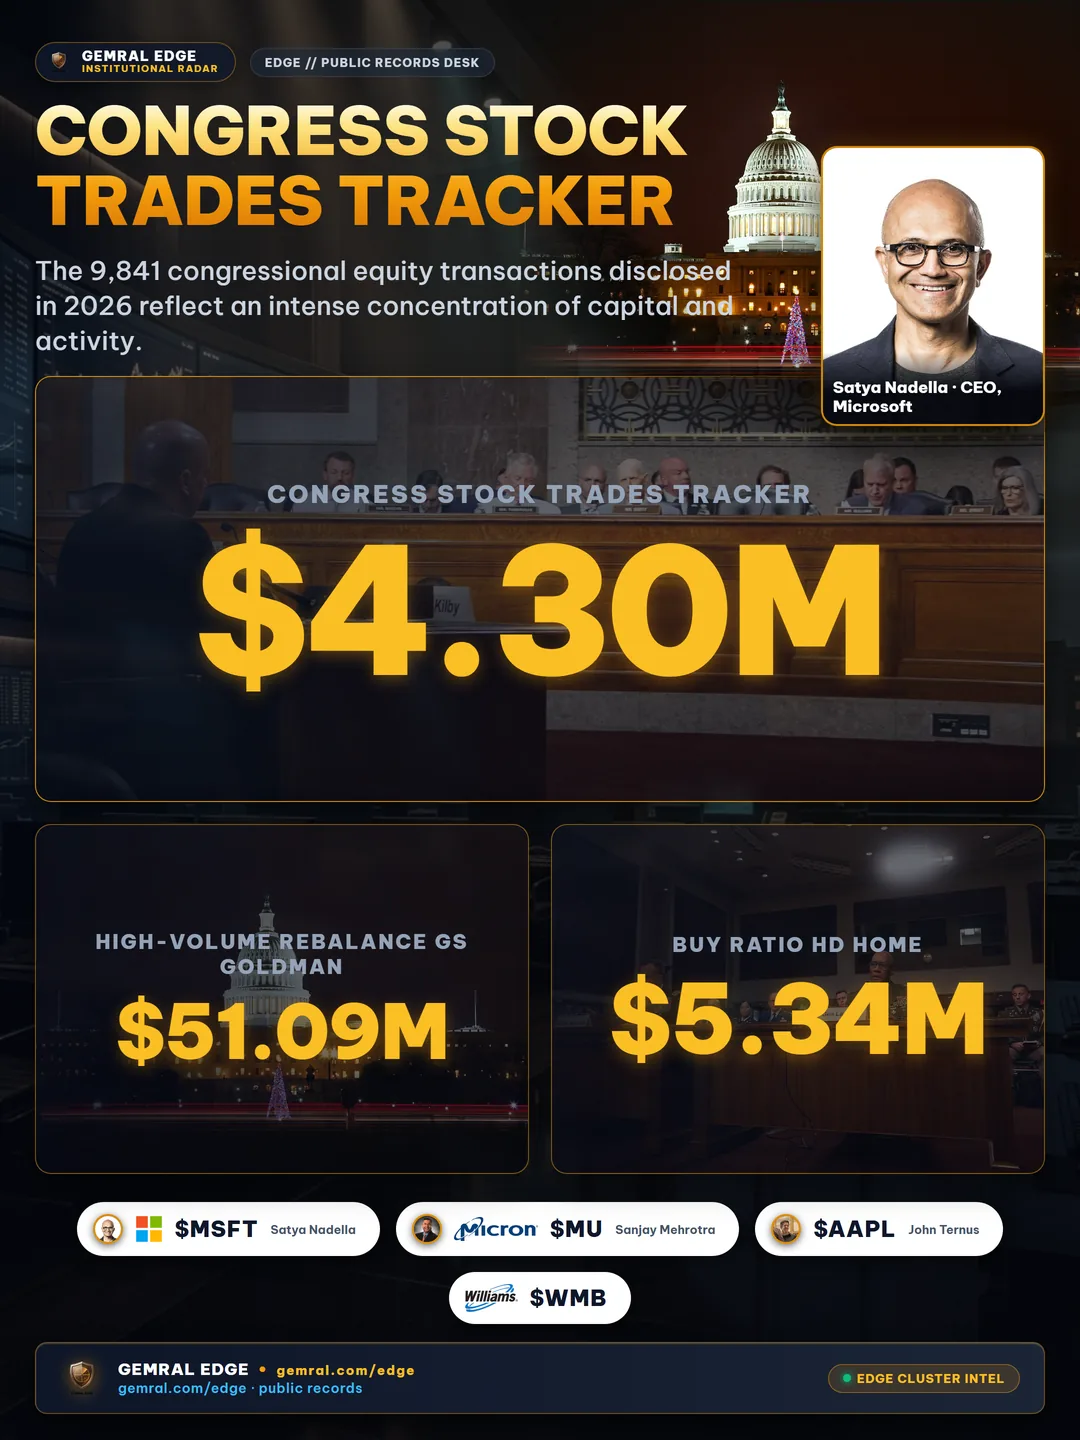
When examined by individual asset classes, large-cap technology and industrial primes dominate the transaction volume. Microsoft Corp (MSFT) registered as the single most actively traded equity on Capitol Hill in 2026, recording 91 distinct transactions (52 purchases and 39 sales) representing between $4.30M and $9.71M in total transaction value. Other top traded names include Home Depot (HD) with 64 transactions ($0.64M to $2.25M), Micron Technology (MU) with 63 transactions, and Apple (AAPL) with 44 transactions ($0.70M to $2.00M). Meanwhile, heavy-volume industrial allocations like Williams Companies (WMB) accumulated $10.52M to $51.09M across 8 transactions, and Goldman Sachs (GS) saw 12 transactions totaling $1.08M to $5.34M with 9 purchases against 3 sales.
| Ticker | Company Name | Total Trades | Buys / Sells | Disclosed Volume Range | Net Stance |
|---|---|---|---|---|---|
| MSFT | Microsoft Corp | 91 | 52 / 39 | $4.30M - $9.71M | Net Accumulation |
| WMB | Williams Companies Inc | 8 | 3 / 5 | $10.52M - $51.09M | High-Volume Rebalance |
| GS | Goldman Sachs Group Inc | 12 | 9 / 3 | $1.08M - $5.34M | 75% Buy Ratio |
| HD | Home Depot Inc | 64 | 24 / 40 | $0.64M - $2.25M | Net Trimming |
| AAPL | Apple Inc | 44 | 20 / 24 | $0.70M - $2.00M | Balanced Rotation |
| QCOM | Qualcomm Inc | 22 | 12 / 10 | $1.16M - $2.65M | Net Accumulation |
How to Track Real-Time Congressional Stock Trades Across House and Senate Disclosures
Tracking congressional stock trades requires understanding the statutory mechanics of congressional disclosure architecture. Unlike the Securities and Exchange Commission's corporate filing infrastructure, congressional financial disclosures are bifurcated into two separate repositories administered by independent legislative bodies: the Legislative Resource Center under the U.S. House of Representatives Clerk, and the Office of Public Records under the Secretary of the U.S. Senate.
Every time a lawmaker, spouse, or dependent child executes a trade exceeding $1,000, they must file a Periodic Transaction Report. On these filings, transaction values are not reported as exact dollar figures; instead, the STOCK Act establishes discrete categorical bands: $1,001 to $15,000; $15,001 to $50,000; $50,001 to $100,000; $100,001 to $250,000; $250,001 to $500,000; $500,001 to $1,000,000; $1,000,001 to $5,000,000; and extending to $5,000,001 to $25,000,000 and $25,000,001 to $50,000,000 for high-net-worth members. A robust data engine normalizes these ranges by tracking both minimum and maximum boundaries, ensuring analytical integrity across multi-tiered allocations.
To extract trade conviction from these reports, quantitative researchers compare congressional purchase timelines against corporate filings. When corporate insiders and federal lawmakers concurrently accumulate the same equity, signal confidence increases exponentially. Readers can examine our companion investigation on corporate insider buy vs sell ratios across federal contractors and Capitol Hill holdings to see how corporate boardroom buying correlates with congressional positioning.
The 45-Day STOCK Act Window: Why Disclosure Lag Matters for Retail Investors
The single greatest operational challenge facing investors who follow congressional portfolios is disclosure lag. Under Section 6 of the STOCK Act, lawmakers must submit a Periodic Transaction Report within 30 days of becoming aware of a transaction, with an outside statutory deadline of 45 days from the actual trade execution date. This means that a stock purchased on Day 1 may not be publicly visible to retail market participants until Day 45.
Our empirical audit of all 9,841 filings in 2026 reveals critical baseline metrics regarding filing timeliness:
- Average Disclosure Lag: The mean time interval from trade execution to public filing disclosure was exactly 36.0 days across all 2026 transactions.
- Median Disclosure Lag: The median disclosure timeline was 26 days, indicating that while many routine trades are submitted within approximately 3 to 4 weeks, long-tail delays skew the overall average upward.
- Statutory Deadline Violations: Exactly 1,498 transactions—representing 15.2% of all filings in 2026—were filed past the mandatory 45-day statutory window. In several documented instances, trades were disclosed between 60 and 90 days after execution.
Because the statutory disclosure window allows up to 45 days of latency, attempting to scalp short-term momentum from congressional filings is mathematically flawed. Rather than treating congressional reports as real-time day trading alerts, institutional analysts use congressional data to identify thematic positioning: multi-month legislative tailwinds, committee policy directions, and structural capital accumulation.
Furthermore, enforcement of the 45-day deadline carries minimal friction. The standard statutory penalty for late filing under current ethics guidelines is a modest $200 fine, which ethics committees frequently waive under administrative review. This dynamic reinforces why automated monitoring tools must actively track disclosure latency, separating lawmakers who file within 7 to 14 days from those who systematically utilize the full 45-day allowance.
Comparing the Most Active Lawmakers: Volume, Committee Power, and Sector Allocations
A granular breakdown of individual member disclosures illustrates the immense variance in personal trading volume and capital commitment across the legislative branch. In 2026, lawmakers from both parties managed highly active equity books:

| Lawmaker | Chamber & Party | Total Filings | Buys / Sells | Disclosed Volume Band | Key Trading Focus |
|---|---|---|---|---|---|
| Ro Khanna | House (D-CA) | 4,057 | 2,232 / 1,825 | $22.08M - $112.06M | High-frequency tech & broad equity dispersion |
| Alan Armstrong | Senate (R-OK) | 1,412 | 1,310 / 100 | $17.02M - $83.23M | Aggressive accumulation (92.8% buy ratio) |
| Gilbert Ray Cisneros, Jr. | House (D-CA) | 819 | 484 / 332 | $6.72M - $24.58M | Diversified equities & municipal allocations |
| Richard Blumenthal | Senate (D-CT) | 678 | 417 / 261 | $36.93M - $119.39M | Major enterprise & healthcare allocations |
| Michael T. McCaul | House (R-TX) | 606 | 375 / 231 | $19.95M - $49.94M | High-conviction tech & energy holdings |
| David McCormick | Senate (R-PA) | 181 | 100 / 81 | $32.68M - $76.30M | Large-cap industrial & macro assets |
| Kevin Hern | House (R-OK) | 297 | 34 / 246 | $9.73M - $27.29M | Net distribution (82.8% sell ratio) |
| Josh Gottheimer | House (D-NJ) | 167 | 73 / 94 | $3.88M - $9.88M | Liquid large-cap rotation |
Representative Ro Khanna (D-CA) led all lawmakers by absolute transaction frequency, reporting 4,057 trades (2,232 purchases and 1,825 sales) with volume between $22.08M and $112.06M, largely reflecting broad household and trust allocations. In contrast, Senator Alan Armstrong (R-OK) demonstrated an overwhelming accumulation bias, executing 1,310 purchases against just 100 sales—a 92.8% purchase rate yielding between $17.02M and $83.23M in gross committed capital. Senator Richard Blumenthal (D-CT) accounted for the largest total dollar volume band among active traders, filing 678 transactions representing up to $119.39M in market exposure.
Crucially, examining committee assignments provides vital context. When members of the House Armed Services Committee or Senate Foreign Relations Committee trade aerospace or semiconductor names, or when members of the Energy and Commerce Committee adjust utility holdings, the alignment between regulatory influence and personal finance becomes an essential research variable. For deeper historical analysis, review our recurring review on what Congress bought this week across periodic transaction disclosures.
Automating Your Congressional Stock Tracker: Alerts, Committee Overlaps, and Signal Convergence
Manual monitoring of House and Senate disclosure portals is time-prohibitive for individual market participants. Disclosures are published unpredictably throughout the week as raw PDF scans or unformatted digital tables. To transform raw public records into actionable intelligence, professional researchers utilize automated tracking workflows that synthesize three distinct data layers:
- Real-Time Filing Ingestion: Automated parsers poll public disclosure portals continuously, extracting trade execution dates, notification dates, ticker symbols, transaction codes, and categorical dollar ranges the moment a PTR document is made available.
- Legislative Committee Mapping: Automated systems link each trading lawmaker to their active committee assignments, subcommittees, and sponsored legislation. An energy trade executed by a member of the Energy and Natural Resources Committee receives immediate context tagging compared to an identical trade made by a member of the Veterans' Affairs Committee.
- Cross-Signal Convergence: The highest-probability market insights emerge when congressional trades converge with independent public data streams. When a lawmaker purchases an enterprise technology contractor within weeks of that same firm receiving a multi-million-dollar defense procurement obligation, the signal moves from isolated trading noise to cross-system convergence. Our investigation on stocks Congress is buying alongside federal contracts and insider convergence explores this multi-trail methodology in detail.
By monitoring the data through dedicated intelligence platforms like Congressional Trading Intelligence (gemral.com/edge/s/congress-stock-trades-tracker), federal contract radar, and corporate insider tracking, retail investors gain parity with institutional research desks, transforming cumbersome government disclosures into transparent market intelligence.
Frequently asked questions
What is a congress stock trades tracker?
A congress stock trades tracker is a public data tool that parses, standardizes, and monitors Periodic Transaction Reports (PTRs) filed by members of the U.S. Senate and House of Representatives under the Stop Trading on Congressional Knowledge (STOCK) Act.
How long do members of Congress have to report their stock trades?
Under the STOCK Act of 2012, lawmakers must report any purchase, sale, or exchange of stocks, bonds, or commodities exceeding $1,000 within 30 days of receiving notice of the transaction, and no later than 45 days after the trade date.
What happens if a member of Congress violates the STOCK Act deadline?
Late disclosures typically trigger a standard $200 ethics penalty, which can be waived by House or Senate ethics committees. In 2026, 1,498 transactions (15.2% of all filings) were disclosed past the statutory 45-day deadline.
Which stocks were most actively traded by Congress in 2026?
In 2026, the most actively traded equity was Microsoft Corp (MSFT) with 91 disclosed transactions ($4.30M to $9.71M), followed by Home Depot (HD, 64 trades), Micron Technology (MU, 63 trades), and Williams Companies (WMB, $10.52M to $51.09M).