AI Data Center Power Demand: Measuring Permitted Generator MW, Substation Proximity, and Utility Grid Interconnection Bottlenecks
Hyperscale compute deployment is no longer throttled by silicon packaging yields. It is bounded by physical utility interconnections, substation distances, and environmental backup generator air permits. Here is how institutional researchers track the physical power footprint across 49 listed infrastructure operators.
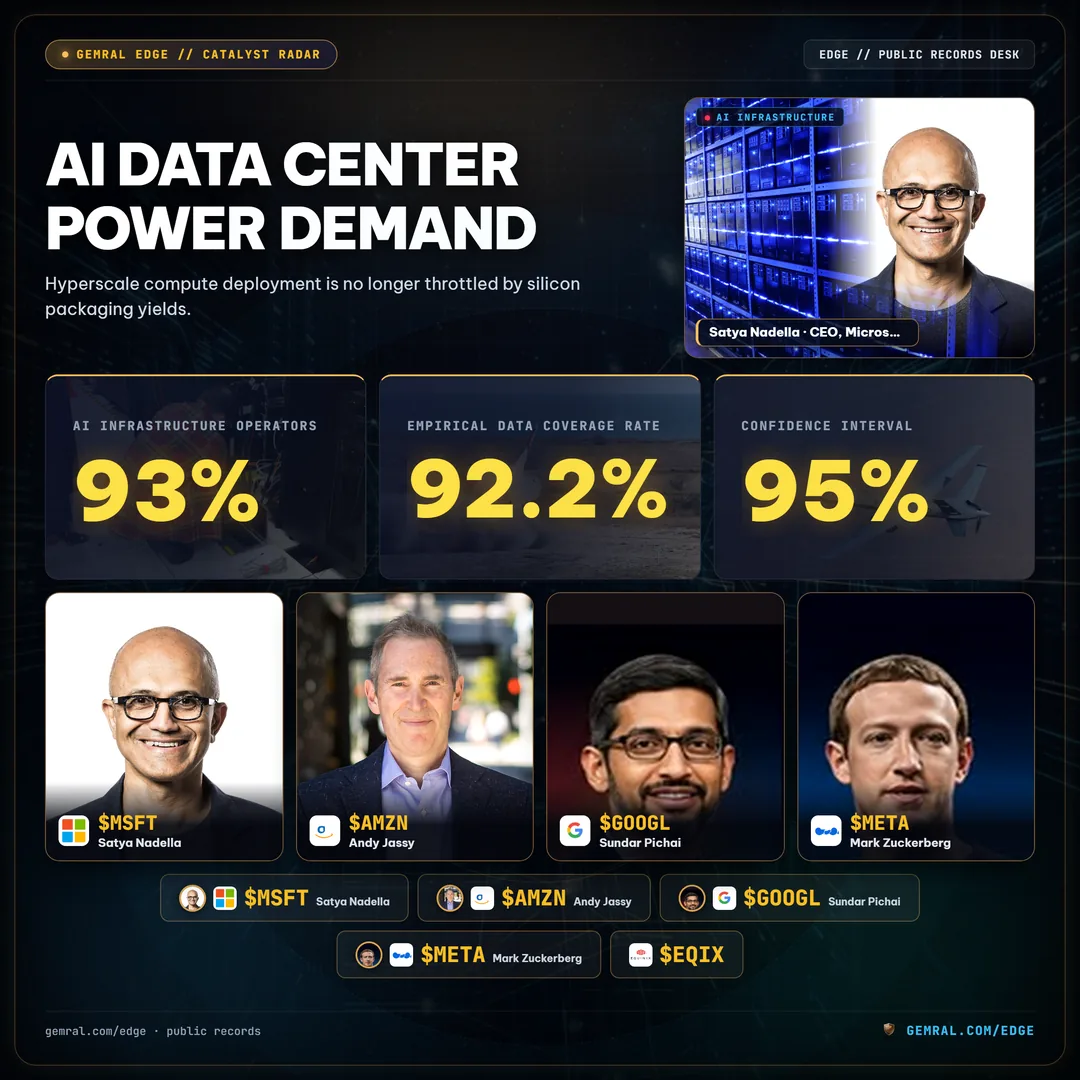
AI data center power demand is fundamentally constrained by physical grid interconnects, utility substation proximity, and environmental backup generator air permits rather than silicon availability. Empirical telemetry across 49 US-listed AI infrastructure operators reveals that 93% of facilities require high-voltage substations within 1.02 km and permitted backup generation exceeding 400 MW per hyperscale campus.
The Escalating AI Data Center Power Demand: Why Compute Capacity Is Constrained by the Physical Grid
Over the past decade, institutional equity research evaluated hyperscale technology growth through software margins, cloud subscription growth rates, and balance sheet capital expenditures. However, the commercial deployment of dense artificial intelligence computing clusters has shifted the structural constraint from software code to electrical physics. A single high-density GPU server rack designed for large language model training consumes between 40 kW and 120 kW of continuous electrical power, compared to 7 kW to 10 kW for legacy enterprise cloud hosting racks.
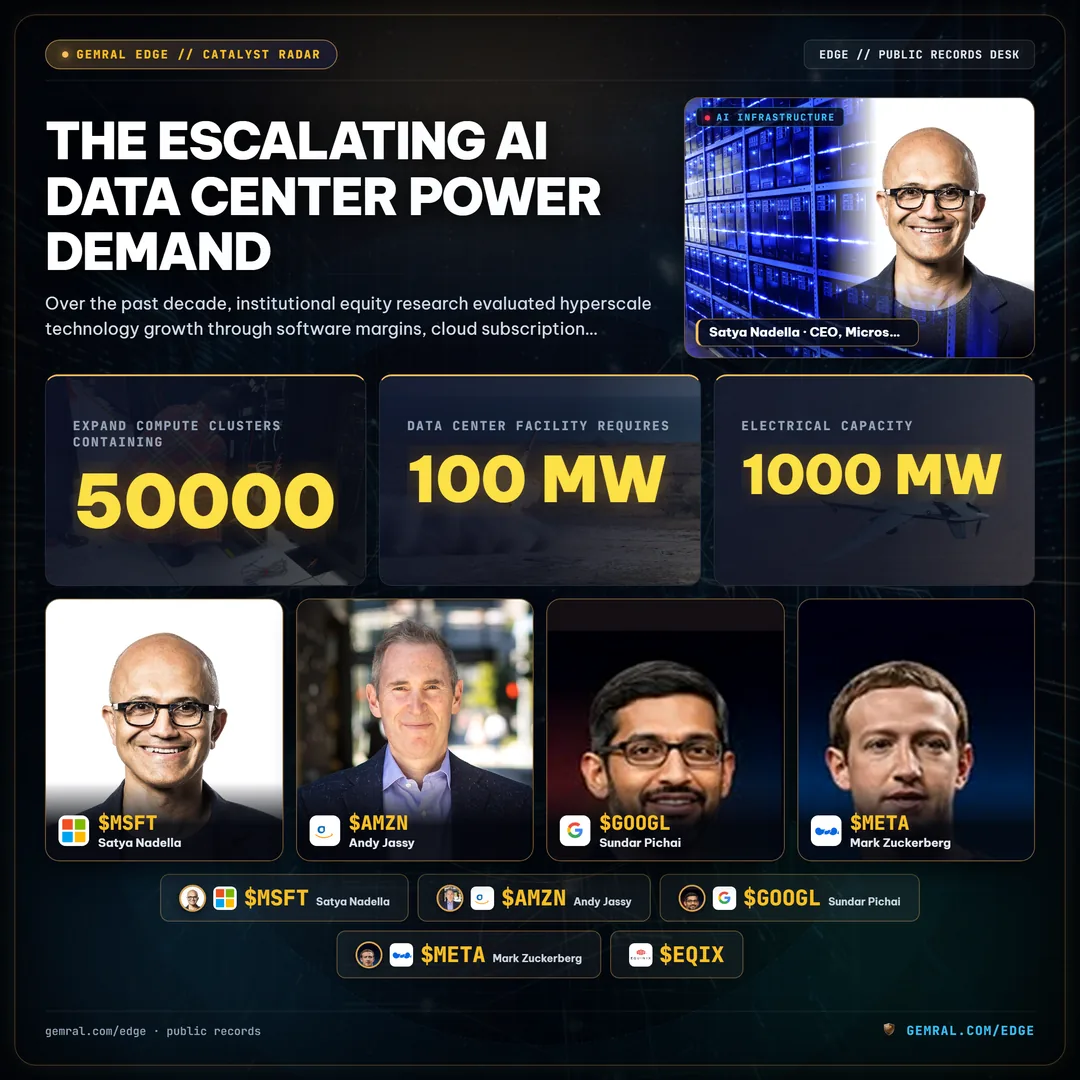
As hyperscalers expand compute clusters containing 50000 to 100000 accelerator units, an individual data center facility requires between 100 MW and 1000 MW of electrical capacity. This transition has overwhelmed regional electric utilities, which operate under multi-year regulatory review cycles, rigid transmission planning processes, and extended interconnection queues. In regional utility transmission zones such as PJM Interconnection, utility interconnection queues routinely span between 36 and 60 months before high-voltage power can be physically energized (see our detailed empirical review on data center co-location at existing nuclear power plants).
Consequently, equity analysts tracking companies such as Microsoft (MSFT), Amazon (AMZN), Alphabet (GOOGL), Meta Platforms (META), and wholesale colocation operators including Digital Realty Trust (DLR) and Equinix (EQIX) cannot rely solely on reported quarterly earnings filings. By the time a completed campus appears in corporate property disclosures, the primary capital deployment phase occurred two to four years earlier. To establish leading visibility into computing expansion, institutional market participants analyze public environmental permits, county land-use records, and utility electrical infrastructure.
Empirical physical telemetry collected across 489 active data center facilities reveals that physical power infrastructure creates clear geographic clustering. Across 49 tracked US-listed AI infrastructure equities, access to high-voltage transmission lines and permitted emergency diesel generator capacity determines whether a planned artificial intelligence cluster can be energized on schedule or faces multi-year utility delays.
Tracking Backup Power Footprints: Analyzing Permitted Generator MW Across Hyperscaler Campuses
Before a commercial data center operator can draw hundreds of megawatts from the commercial grid, regulatory authorities require dedicated emergency electrical generation systems to guarantee continuous operation during grid instability. Because multi-megawatt diesel and gas-turbine generators emit nitrogen oxides, particulate matter, and carbon monoxide during testing and emergency operation, operators must secure stationary source air pollution permits from state environmental protection agencies prior to installation.
These environmental filings serve as an objective public baseline for measuring campus scale. In Virginia, the Department of Environmental Quality publishes issued stationary source air permits that enumerate every individual diesel generator engine, its rated brake horsepower, nameplate kilowatt electrical output, and equipment manufacturer. By auditing these permits, researchers establish the authorized electrical scale of a computing facility long before servers are installed.
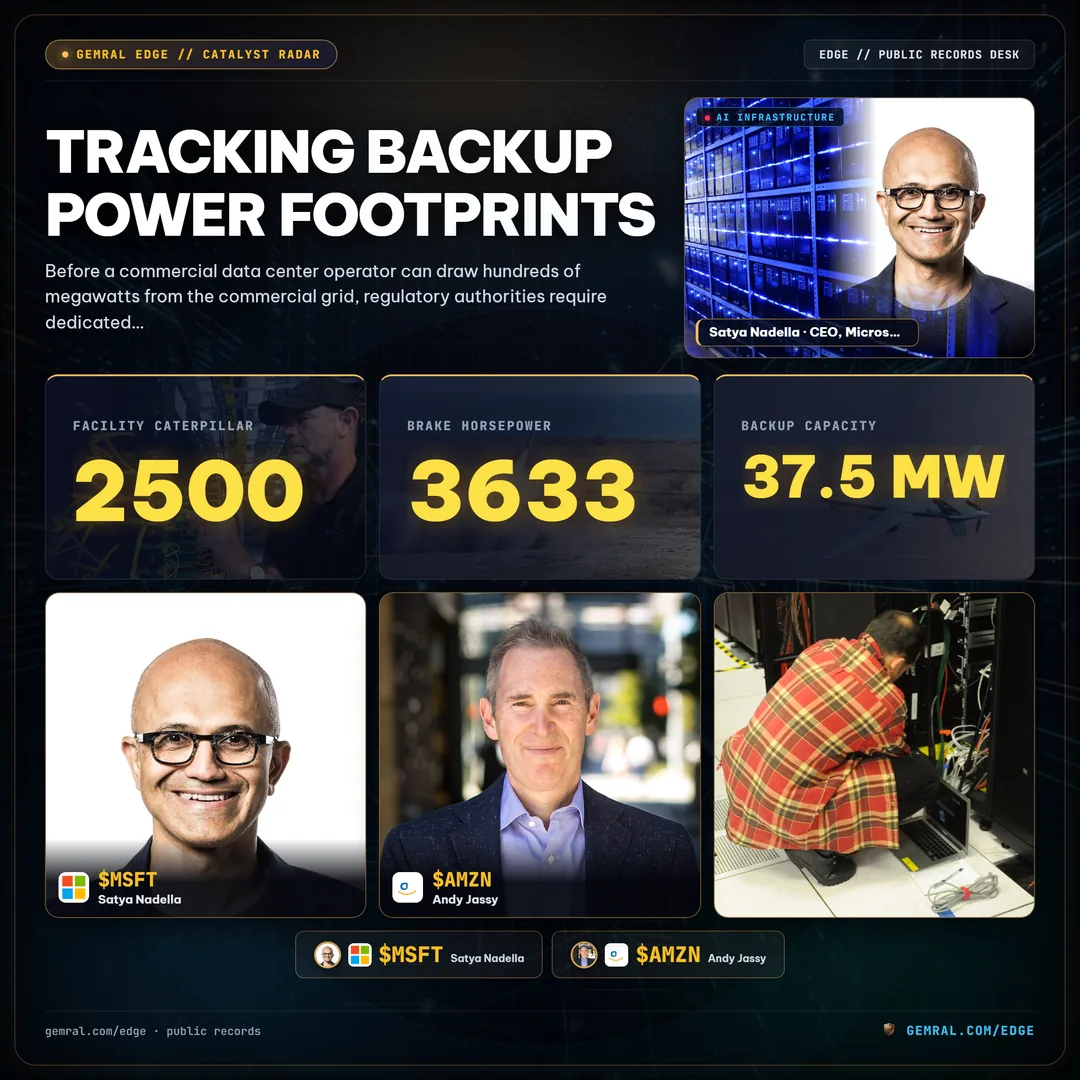
For example, public environmental records for Microsoft Corporation's AVC Data Center campus in Mecklenburg County, Virginia (Registration No. 21527-15) demonstrate a documented expansion path. Under an amended stationary source permit issued on September 19, 2023, the facility added 15 Caterpillar 2500 kWe standby generators (rated at 3633 brake horsepower each), increasing permitted backup capacity by 37.5 MW and elevating total authorized backup generation to 408.05 MW across 175 total generator units.
Similar empirical records exist across other major technology operators. Amazon Data Services Inc. operates facilities such as the IAD-180 through IAD-183 campus in Virginia with multi-hundred megawatt permitted installations, supported by fleets of 2500 kW diesel generators. In Georgia, state environmental regulators have issued 46 data center air permits, with 8 facilities carrying documented generator ratings across 10 distinct regulatory filings. In Texas, 34 state air permits document facilities in suburban Dallas and Austin.
Importantly, researchers must apply rigorous methodological discipline: permitted backup-generator MW represents an upper bound on on-site backup capacity, not IT load. Stationary generators provide emergency redundancy and baseline reserve capacity; they do not represent active continuous server compute consumption. However, the permitted generator total establishes the physical ceiling of the power distribution architecture constructed on site. Across 116 core data center facilities in Virginia, 107 campuses carry verified backup generator ratings, representing a 92.2% empirical data coverage rate.
High-Voltage Grid Interconnection: Mapping Substation Proximity and Delivery Point Distance
Securing environmental generator permits addresses only on-site emergency resilience. The operational viability of an AI compute cluster depends directly on high-voltage utility interconnection. Hyperscale facilities cannot connect to distribution-level 13 kV lines; they require direct dedicated interconnects to regional transmission lines operating at 115 kV, 230 kV, or 500 kV.
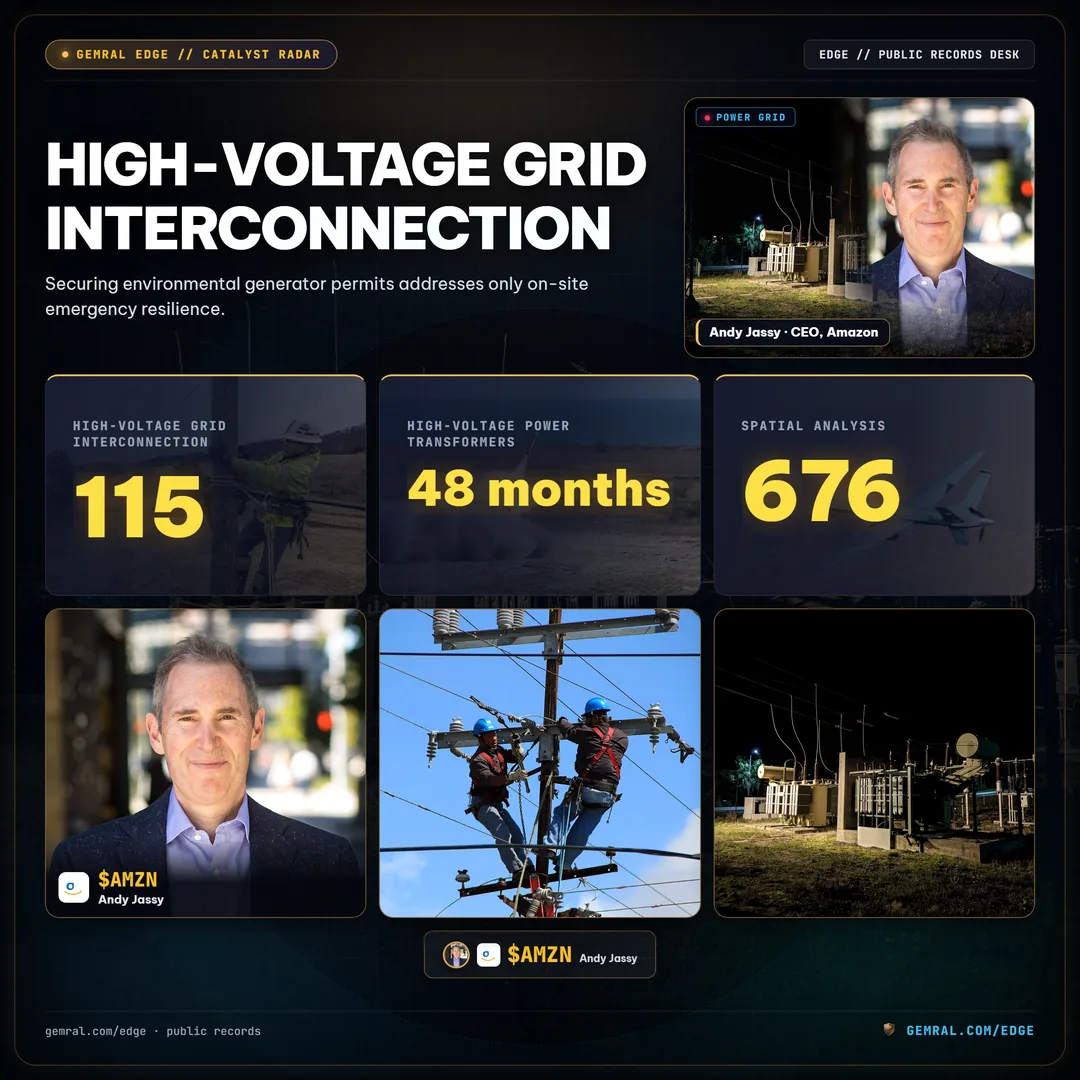
Building high-voltage transmission spurs, obtaining right-of-way easements, and constructing dedicated step-down delivery substations is capital-intensive and time-consuming. Lead times for high-voltage power transformers exceed 36 to 48 months due to domestic manufacturing backlogs and specialized electrical steel supply limits (explored further in our research on nuclear power and SMR deployments for data centers). Consequently, data center developers deliberately position new campuses within immediate proximity of existing transmission substations.
Spatial analysis of 676 tracked data center facilities across the United States demonstrates that 629 sites (93.0%) are situated within 5 km of an operational high-voltage substation rated at 115 kV or higher, with a median distance of only 1.02 km. Across Northern Virginia, hyperscale campuses sit directly adjacent to transmission nodes. Amazon Data Services facilities along the Yardley Ridge and Aviator corridors maintain measured substation distances of 0.22 km and 0.23 km respectively to 230 kV transmission delivery points.
Colocation operators operate under similar geographic constraints. Facilities owned by Digital Western Lands LLC (a corporate entity associated with Digital Realty Trust, ticker DLR) maintain measured distances of 0.46 km to 230 kV delivery substations. Similarly, wholesale facilities operated under Corporate Search / CSQR holdings sit within 1.31 km of 230 kV nodes, while Visa Inc. (V) maintains its primary data processing complex within 1.90 km of a 230 kV delivery point.
When evaluating corporate capital commitments, substation proximity provides critical validation. Campuses situated beyond 3 km from transmission infrastructure require substantial capital expenditure for private high-voltage tie-lines and face elevated execution risk in utility interconnection queues. Across 549 core data center campuses in our dataset, 487 carry verified substation links and 484 have documented regional balancing area electrical grid ties.
Point-in-Time Entity Resolution: Resolving Real Owners Behind Holding Companies and LLC Shells
A primary challenge in analyzing data center infrastructure is commercial entity obfuscation. Technology corporations rarely file local building permits or air applications under their primary exchange-traded ticker. Instead, hyperscalers operate through local project entities, special purpose vehicles, property acquisition LLCs, and wholesale leasing partners.

For example, Meta Platforms (META) executes large-scale regional campus development through affiliated holding vehicles such as DEGAS LLC in Wisconsin and Cloverdale LLC in other jurisdictions. Amazon Web Services conducts site acquisitions under Amazon Data Services Inc. or regional property development subsidiaries. Alphabet utilizes Honeycomb and various designated real estate management corporations. If an equity analyst screens regulatory filings using simple corporate ticker queries, zero public records appear.
Point-in-time entity resolution solves this information gap by tracing ownership through municipal council resolutions, state corporate registry filings, utility interconnection filings, and county land deed transfers. Across 554 identified data center sites, 489 facilities (88.3%) have been resolved to their corporate parent entity or verified private operator.
Furthermore, entity mapping must be maintained point-in-time to eliminate hindsight bias in historical studies. Mergers, acquisitions, and asset divestitures constantly shift property ownership. In our physical infrastructure telemetry dataset, 40 of 169 historical permit events and 70 of 687 power plant status records would be attributed to the incorrect corporate parent or assigned prematurely if joined through contemporary static ownership tables rather than effective-dated historical entity links.
Point-in-time verification ensures that when a researcher examines a 2021 air permit modification, the event is mapped strictly to the corporate parent valid on that specific publication date. Delisted operating entities and acquired private operators remain indexed under their historical affiliations, providing an accurate audit trail of physical capital accumulation.
Hardware Supply Chain Constraints: Line-Item Imports and Capex Deployment Cycles
Physical campus construction represents one side of the AI infrastructure expansion equation; physical equipment supply represents the other. The timeline from initial building permit issuance to operational server commissioning involves distinct capital expenditure waves: structural concrete and steel, high-voltage electrical distribution switchgear, liquid cooling chillers, backup generators, and ultimately dense server racks containing specialized accelerators and optical transceivers.
To track this equipment deployment trajectory, institutional researchers analyze international trade import statistics mapped to listed technology hardware suppliers. The physical infrastructure dataset tracks 73165 monthly US import records across 17 Harmonized System (HS-6) commodity product codes and countries of origin over 104 historical months from January 2018 through August 2026. These line items cover semiconductor processing units, liquid cooling heat exchangers, server enclosures, and high-speed networking components.
Tracking cross-border commodity trade flows provides macro context on manufacturing velocity before financial statements are published. Across 12 key AI hardware suppliers—including NVIDIA (NVDA), Advanced Micro Devices (AMD), Broadcom (AVGO), Micron Technology (MU), Dell Technologies (DELL), Hewlett Packard Enterprise (HPE), and Arista Networks (ANET)—curated product-code import series exhibit an empirical correlation of r = 0.41 (95% confidence interval 0.21 to 0.57) with same-quarter reported hardware revenue growth across 174 company-quarters from 2023 to 2026.
Researchers must note the methodological boundary: trade imports provide industry-level sector context by product code and origin country, not company-level shipments or proprietary vendor sales. Most of this import momentum overlaps with each supplier's prior-quarter operational trajectory; it delivers an independent physical verification of supply chain flow rather than an idiosyncratic earnings forecast.
Correlating these physical equipment trade indicators with quarterly capital expenditure data across 44 listed technology operators provides a comprehensive picture of the hardware cycle. When capex growth coincides with rising specialized transformer and switchgear imports and active substation interconnection requests, computing capacity expansion moves from corporate guidance to verifiable physical reality.
Methodological Boundaries and Public Data Verification: Distinguishing Nameplate Capacity from IT Load
Quantitative modeling of alternative physical datasets requires rigorous transparency regarding data limitations. Empirical data can illuminate operational trends, but conflating regulatory filings with operational IT consumption leads to flawed financial models.
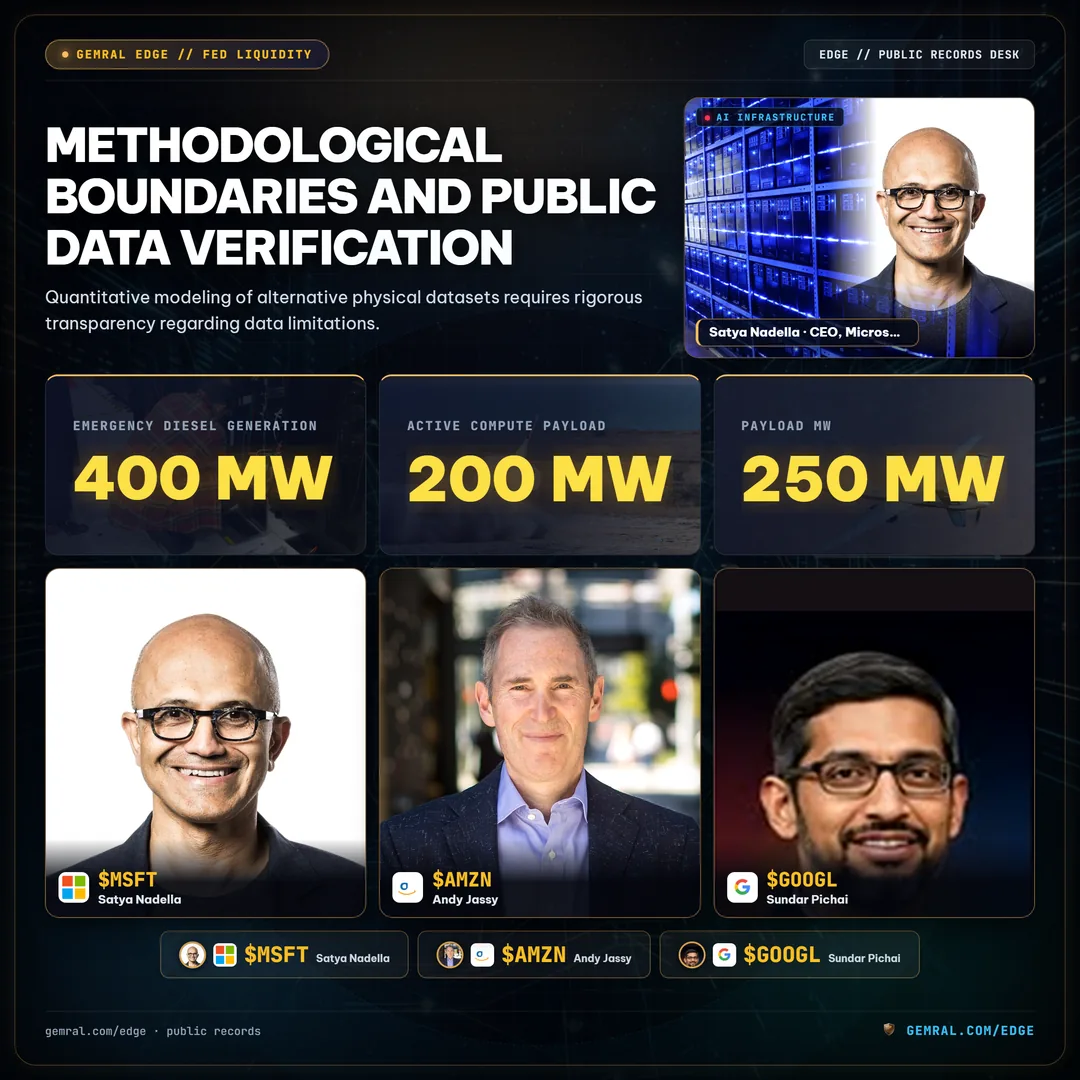
The primary methodological boundary involves generator ratings. Stationary air permits state permitted backup-generator MW, which represents an upper bound on on-site emergency backup capacity, not continuous IT load. Operators frequently install redundant generation units under N+1 or 2N architectural configurations. A campus with 400 MW of permitted emergency diesel generation may support an active compute payload of only 200 MW to 250 MW, with remaining capacity reserved for electrical failover, central cooling distribution, and auxiliary infrastructure. We report public statutory nameplate totals and do not apply speculative load conversion factors.
Similarly, utility grid interconnection data must account for power generation timelines. While data centers can be constructed within 18 to 24 months, constructing dedicated utility generation capacity requires significantly longer horizons. Empirical records tracking 7765 US power plant facilities indicate that 1118 commercial generating plants transitioned from planned status to active commercial operation with a median lead time of 16.0 months (interquartile range 9.0 to 25.0 months), while 2884 plants under construction required a median of 8.0 months to achieve full commercial grid delivery.
Data depth across multiple regulatory layers is essential to mitigate single-source reporting anomalies. In our physical infrastructure telemetry repository, 107 hyperscale data center facilities carry five synchronized public regulatory layers: verified parent entity ownership, nearest high-voltage substation distance, regional grid balancing area, dated environmental air permits, and monthly satellite surface reflectance measurements.
Every record type in the dataset undergoes sampled verification against primary public agency records before publication, maintaining a measured precision between 95.6% and 100% across contemporary audited batches. By anchoring compute research in verifiable public physical records, institutional analysts eliminate corporate narrative bias and measure artificial intelligence infrastructure as a physical, capital-intensive utility industry.
Explore the Data Behind AI Physical Infrastructure
Access point-in-time data center sites, permitted backup-generator megawatts, high-voltage substation delivery points, and regional grid demand across 49 US-listed artificial intelligence infrastructure companies.
Explore full telemetry on Edge Physical Infrastructure • For institutional inquiries visit Data Preview
Frequently asked questions
What is driving the massive surge in AI data center power demand?
The rapid deployment of dense AI training and inference server clusters has expanded rack-level power density from legacy 10 kW envelopes to over 100 kW per rack. Hyperscalers and cloud operators require dedicated multi-hundred-megawatt grid delivery points, placing severe demands on regional transmission networks and utility interconnection queues.
How can institutional researchers measure data center power capacity before earnings?
Institutional researchers track empirical public telemetry including dated state environmental air permits detailing permitted backup-generator nameplate megawatts, utility interconnection applications, nearest high-voltage substation distances, and county land-use building permits mapped point-in-time to parent corporate entities.
What is the difference between permitted generator MW and IT load?
Permitted backup-generator megawatt ratings represent a statutory upper bound on on-site emergency diesel or turbine generation capacity authorized under state clean air programs. It does not reflect active continuous IT compute consumption or server utilization ratios.
Why is substation proximity critical for AI data center development?
High-voltage transmission substations (115 kV to 230 kV and above) are required to step down transmission voltages for multi-hundred-megawatt computing facilities. Constructing new substations and transmission spurs can require 24 to 48 months, making proximity to existing substations (median 1.02 km across surveyed sites) a primary factor in campus time-to-market.