Senator Stock Trades This Month: 35 Disclosed Trades From 6 Senators
Six senators filed 35 trade disclosures between Sept. 10 and Oct. 10, 2026. Together the filings cover $1,239,035 to $2,985,000 in transactions, because Senate rules report each trade as a dollar band rather than an exact amount. That is the month's record of senator stock trades in our dataset, and one filer accounts for 16 of the 35 entries.
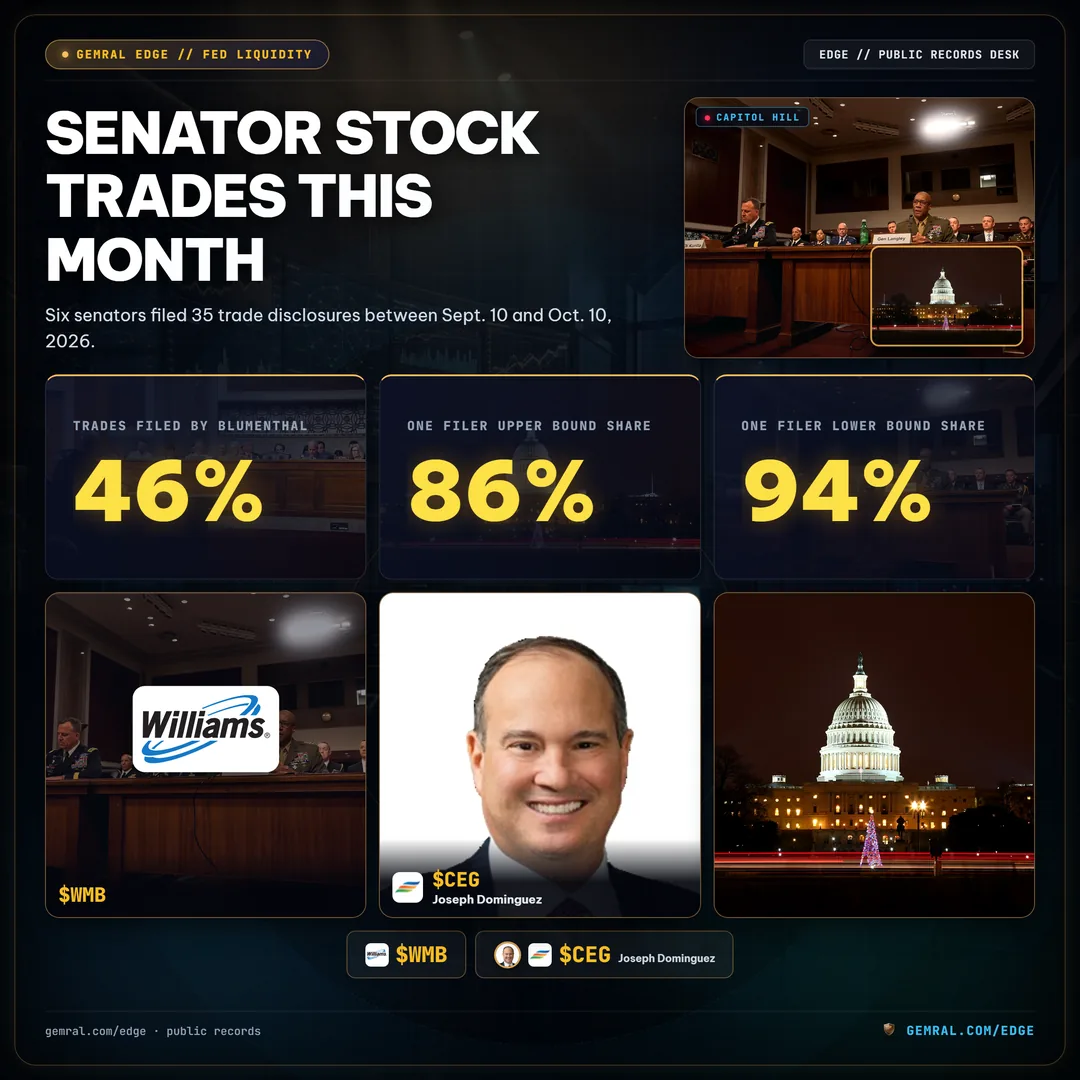
Of the 35 trades, 20 are purchases and 15 are sales. Only 14 of the 35 carry a ticker. The other 21 carry none in the dataset: 16 are private limited liability companies and 5 are bonds or listed stocks recorded by name only. This report breaks the month down by senator, by holding type, and by how long each filing took to reach the public.
Can Senators Trade Stocks? What the STOCK Act Requires
Yes. Senators are allowed to own and trade securities, and the STOCK Act of 2012 confirmed that insider-trading law applies to members of Congress. In practice the act works through disclosure: a senator reports each covered trade in a periodic transaction report. That filing is the only reason senator stock trades are public data at all, and it is why every figure in this report describes a filing, not the trade at the moment it happened. For enforcement history see STOCK Act violations, fines, and enforcement, and for the legislative debate see the congressional stock trading ban bill.
How to See Senator Stock Trades Yourself
The primary source is the Senate's electronic financial disclosure database, where each periodic transaction report is posted as a filing. Reading it directly means searching by senator and report type, opening each report, and copying every row into your own table. Amounts arrive as bands, and holdings such as private LLCs have no ticker, so the copied table needs cleanup before it can be compared across senators.
What Stocks Are Senators Buying and Selling: The 14 Ticker Trades
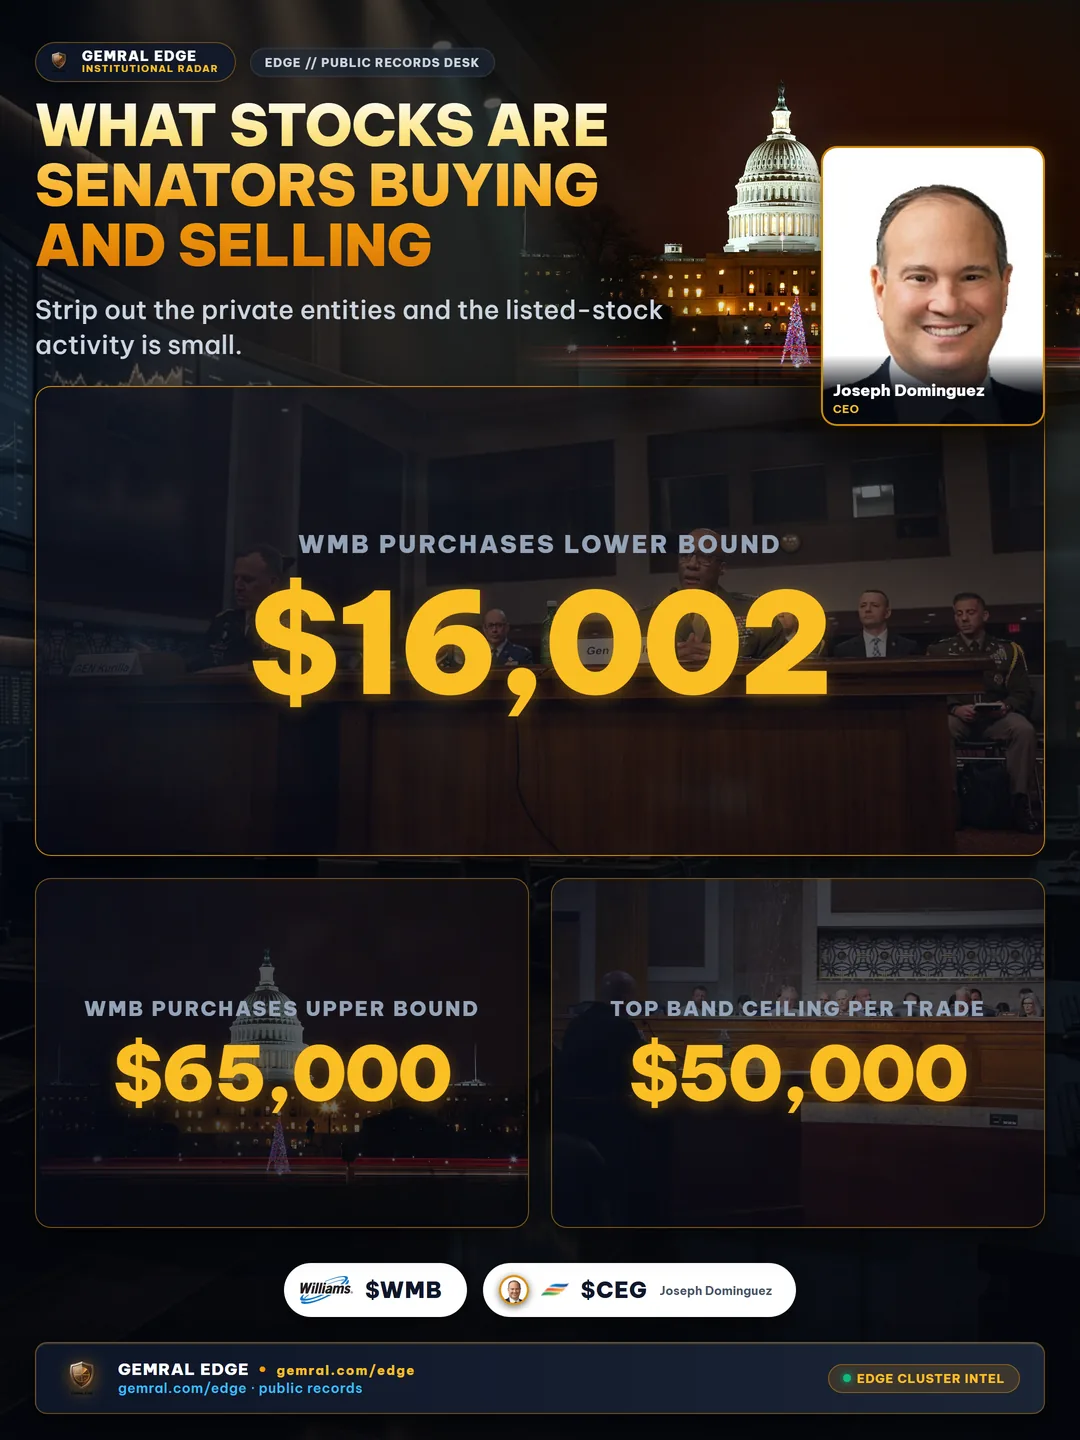
Listed-stock activity in these filings is small. Fourteen filings carry a ticker, spread over 13 symbols, and every one is in the lowest two bands. Senator Boozman filed 9 of them, Senator Whitehouse filed 3, and Senator Armstrong filed 2. The only symbol with more than one trade is Williams Companies (WMB), with two purchases by Armstrong worth $16,002 to $65,000 combined. The largest single bands in the group, $15,001 to $50,000, are a JPMorgan Chase (JPM) sale by Whitehouse and a Westwood Quality SmallCap Fund (WWSYX) sale by Boozman.
| Ticker | Holding | Senator | Side | Trades | Reported Value Range |
|---|---|---|---|---|---|
| WMB | Williams Companies | Armstrong | Purchase | 2 | $16,002 to $65,000 |
| JPM | JPMorgan Chase | Whitehouse | Sale | 1 | $15,001 to $50,000 |
| WWSYX | Westwood Quality SmallCap Fund | Boozman | Sale | 1 | $15,001 to $50,000 |
| JNJ | Johnson & Johnson | Boozman | Sale | 1 | $1,001 to $15,000 |
| IVV | iShares Core S&P 500 ETF | Boozman | Sale | 1 | $1,001 to $15,000 |
| CEG | Constellation Energy | Boozman | Sale | 1 | $1,001 to $15,000 |
| V | Visa | Whitehouse | Sale | 1 | $1,001 to $15,000 |
| ADI | Analog Devices | Whitehouse | Sale | 1 | $1,001 to $15,000 |
| FSLR | First Solar | Boozman | Purchase | 1 | $1,001 to $15,000 |
| OTIS | Otis Worldwide | Boozman | Purchase | 1 | $1,001 to $15,000 |
| SPYM | Tradr 2X Long SPY Monthly ETF | Boozman | Purchase | 1 | $1,001 to $15,000 |
| IJR | iShares Core S&P Small-Cap ETF | Boozman | Purchase | 1 | $1,001 to $15,000 |
| AVUV | Avantis U.S. Small Cap Value ETF | Boozman | Purchase | 1 | $1,001 to $15,000 |
Whitehouse and King filed only sales (3 and 1). Fetterman filed only purchases (2). Nothing in these filings explains why a trade was made, and this report does not infer a reason.
Why 21 of 35 Trades Have No Ticker
A ticker-based tracker will miss 60% of the month. Of the 35 entries, 21 carry no ticker in the dataset. Sixteen of those are the three private LLCs described below. The other 5 are two Dell corporate bond purchases by Fetterman and three sales of listed stocks (AvalonBay once, Electronic Arts twice) that are recorded by name only. Any screen that filters on ticker symbols quietly drops private entities, bond holdings, and listed stocks recorded without a symbol.
That matters for anyone building a watchlist from senator stock trades. A ticker-only screen would have shown 14 trades this month, and the largest single filer by dollar range would not appear in it at all.
Who Filed the Most Senator Stock Trades: Six Names, 35 Trades
Disclosure activity was concentrated in a very small group. Senator Richard Blumenthal (D-CT) filed 16 trades, or 46% of the month. Senator John Boozman (R-AR) filed 9 trades, Senator Alan Armstrong (R-OK) filed 4, Senator Sheldon Whitehouse (D-RI) filed 3, Senator John Fetterman (D-PA) filed 2, and Senator Angus King (I-ME) filed 1.
| Senator | Trades | Buys / Sells | Reported Value Range | Avg Filing Lag |
|---|---|---|---|---|
| Richard Blumenthal (D-CT) | 16 | 11 / 5 | $1,164,016 to $2,560,000 | 31.3 days |
| John Boozman (R-AR) | 9 | 5 / 4 | $23,009 to $170,000 | 22.3 days |
| Alan Armstrong (R-OK) | 4 | 2 / 2 | $18,004 to $95,000 | 33.8 days |
| Sheldon Whitehouse (D-RI) | 3 | 0 / 3 | $17,003 to $80,000 | 27.0 days |
| John Fetterman (D-PA) | 2 | 2 / 0 | $2,002 to $30,000 | 21.5 days |
| Angus King (I-ME) | 1 | 0 / 1 | $15,001 to $50,000 | 40.0 days |
One Filer Holds 86% of the Reported Dollar Ceiling
Blumenthal's 16 trades carry a reported range of $1,164,016 to $2,560,000. Against the month's totals, that is 94% of the lower bound and 86% of the upper bound. The remaining five senators together filed 19 trades worth $75,019 to $425,000. Any headline figure for senator stock trades this month is therefore mostly a figure about one filer.
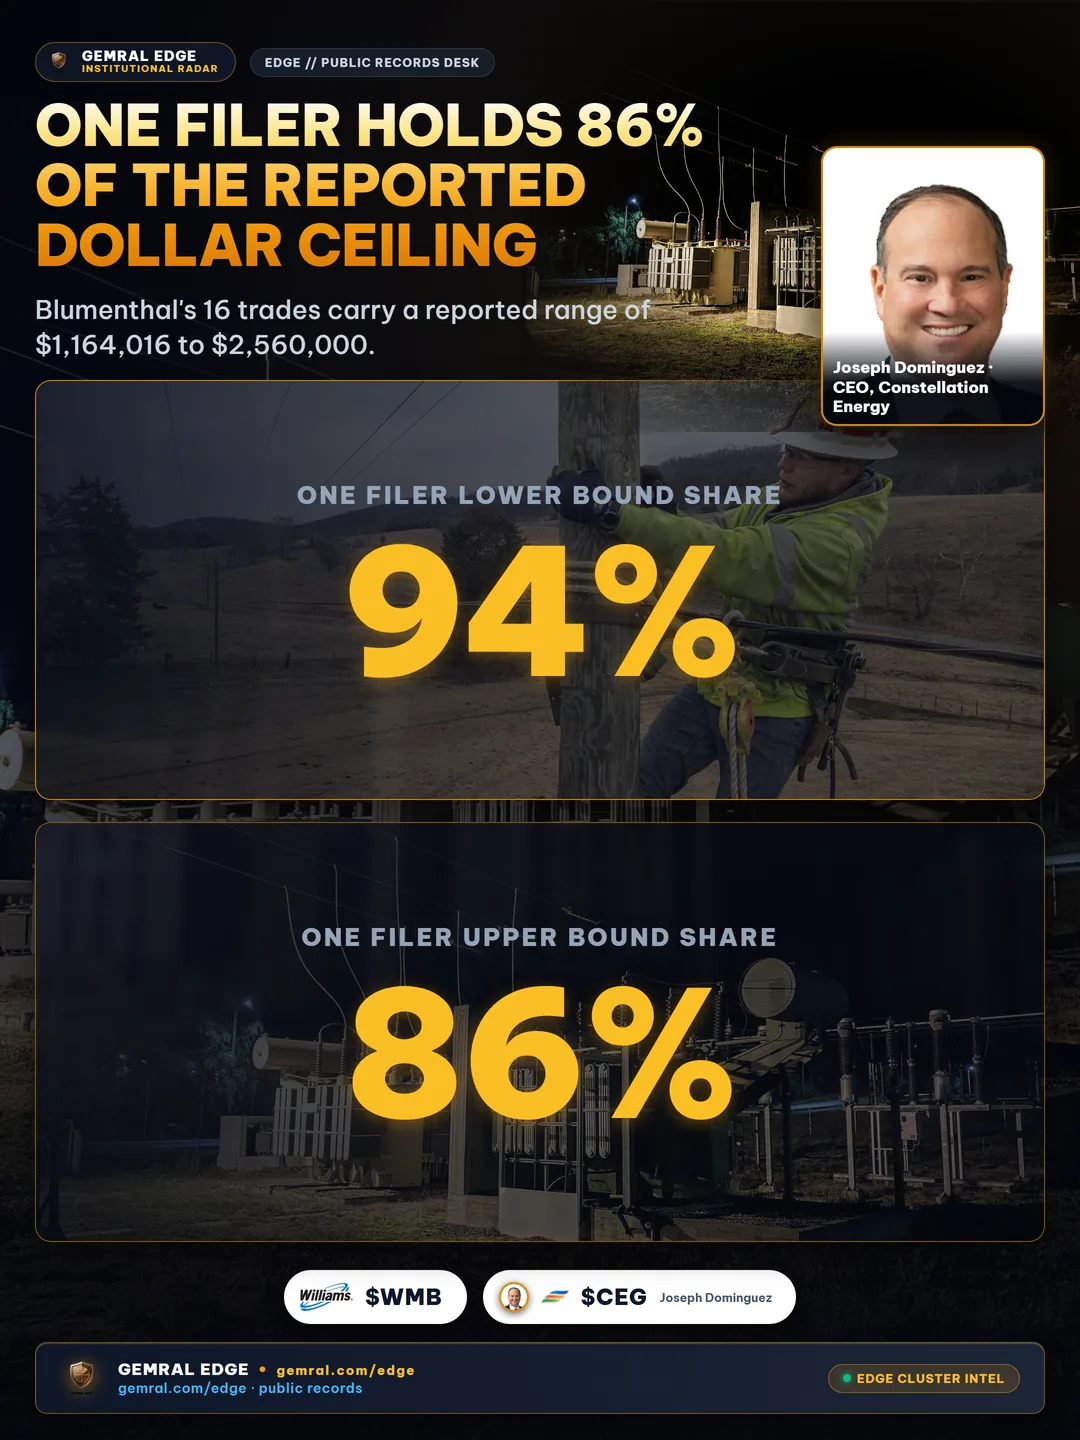
The 16 entries sit in three private entities, not in listed companies. MH Built to Last LLC accounts for 9 trades (4 buys, 5 sales) worth $483,009 to $1,095,000. Days Between LLC accounts for 3 trades, all purchases, worth $365,003 to $800,000. Not Fade Away LLC accounts for 4 trades, all purchases, worth $316,004 to $665,000. The trade counts of the three entities add up to 16 and their value ranges add up exactly to Blumenthal's totals.
| Entity | Trades | Buys / Sells | Reported Value Range |
|---|---|---|---|
| MH Built to Last LLC | 9 | 4 / 5 | $483,009 to $1,095,000 |
| Days Between LLC | 3 | 3 / 0 | $365,003 to $800,000 |
| Not Fade Away LLC | 4 | 4 / 0 | $316,004 to $665,000 |
Filing Lag: 28.6 Days on Average, None Past 45
The STOCK Act of 2012 requires a senator to file within 30 days of learning about a trade, and no later than 45 days after the trade date. Across the 35 filings, the shortest gap between trade date and public disclosure was 15 days and the longest was 44 days. The average was 28.6 days. Fifteen of the 35 filings, or 43%, took longer than 30 days, and none took longer than 45.
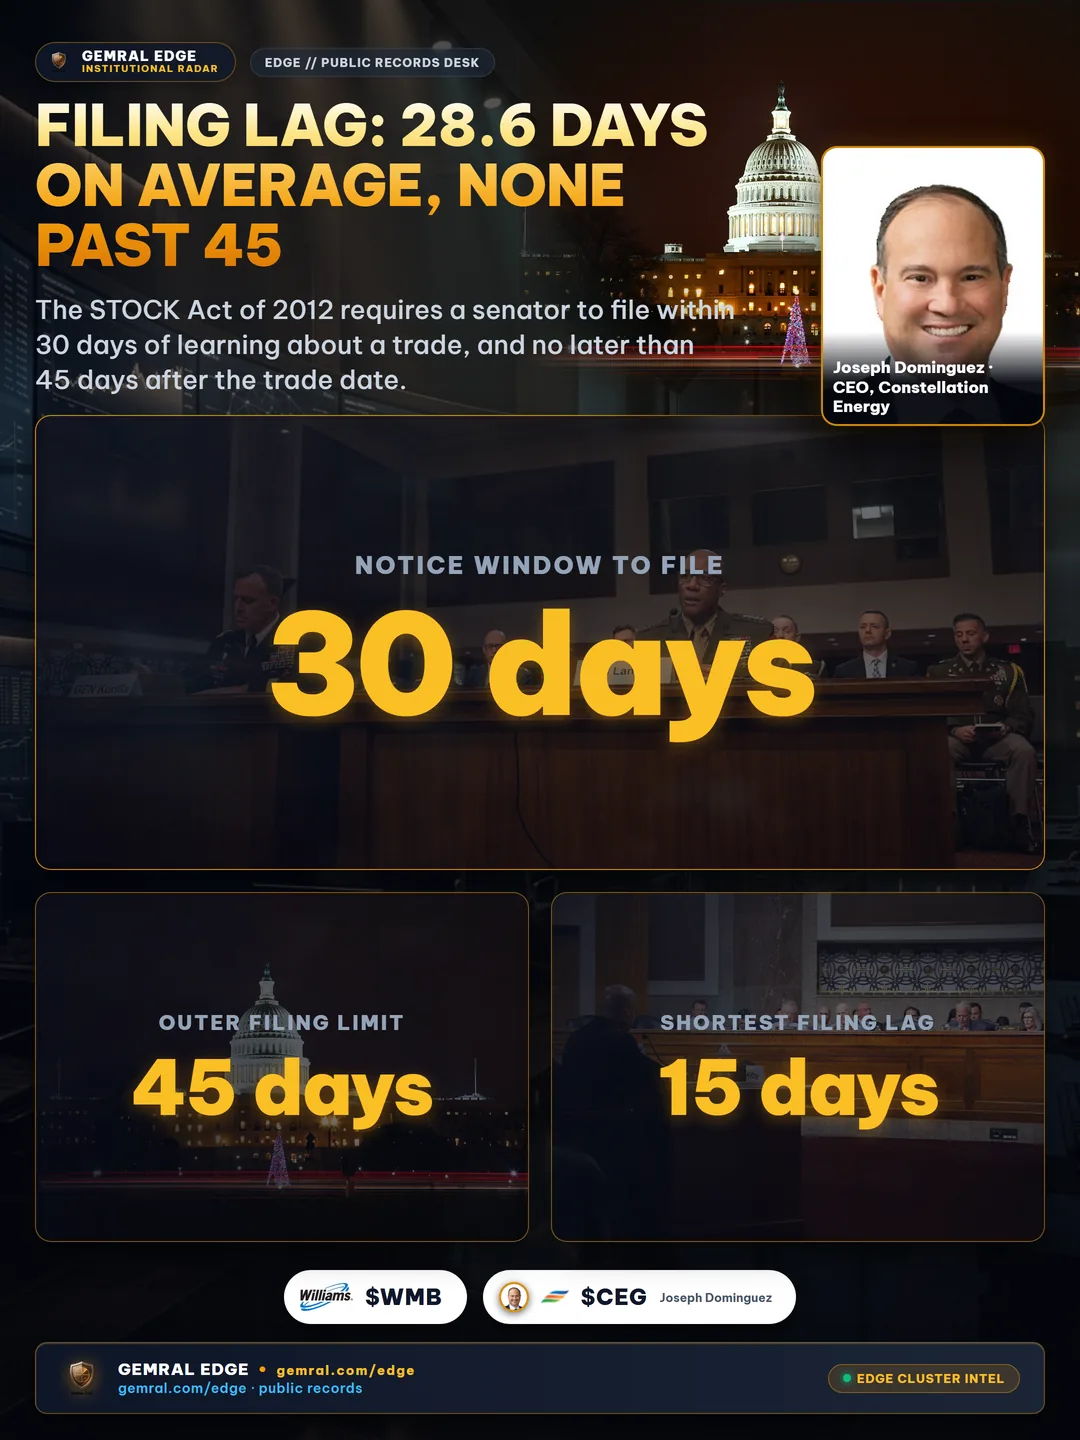
Every trade in this report was already between 15 and 44 days old when it became public. These filings describe positions taken weeks earlier, so they work as a record of past activity and not as a timing signal.
How to Read These Numbers
Senate filings do not give exact dollar amounts. Each trade is reported in a statutory band such as $1,001 to $15,000 or $250,001 to $500,000. This report sums the lower edge and the upper edge of each band separately, which is why every total appears as a range: $1,239,035 to $2,985,000 for the full month. The true total lies somewhere inside that range, and the range is wide because the bands are wide.
The counts are exact for the filings in our dataset. Trade counts, buy and sell counts, and filing lags come directly from the filed dates and sides. The analysis covers filings whose disclosure date falls from Sept. 10 through Oct. 10, 2026, and uses disclosure date, not trade date, to assign a trade to the month. Live Senate and House disclosure feeds are tracked on the Gemral Edge congressional radar, and a single-ticker example of how one filing is written up is the INTC congressional buys story.
Disclaimer: Public data · not investment advice. All figures in this report come from public periodic transaction reports filed under the Stop Trading on Congressional Knowledge (STOCK) Act of 2012. This report is published for research and educational purposes and does not recommend buying, selling, or holding any security.
Frequently asked questions
How many senator stock trades were disclosed this month?
Six senators disclosed 35 trades between Sept. 10 and Oct. 10, 2026: 20 purchases and 15 sales, with a combined reported value of $1,239,035 to $2,985,000. Counts are by disclosure date.
Which senator filed the most trades this month?
Richard Blumenthal (D-CT) filed 16 of the 35 trades, or 46%, all through three private LLCs. John Boozman (R-AR) filed 9, Alan Armstrong (R-OK) 4, Sheldon Whitehouse (D-RI) 3, John Fetterman (D-PA) 2, and Angus King (I-ME) 1.
How long does it take for a senator's stock trade to become public?
In this month's 35 filings the shortest gap between trade date and disclosure was 15 days, the longest was 44 days, and the average was 28.6 days. None took longer than 45 days.