逆回购耗尽动态与主权抵押品周转率:量化2026年下半年向主动银行准备金吸收的结构性转变
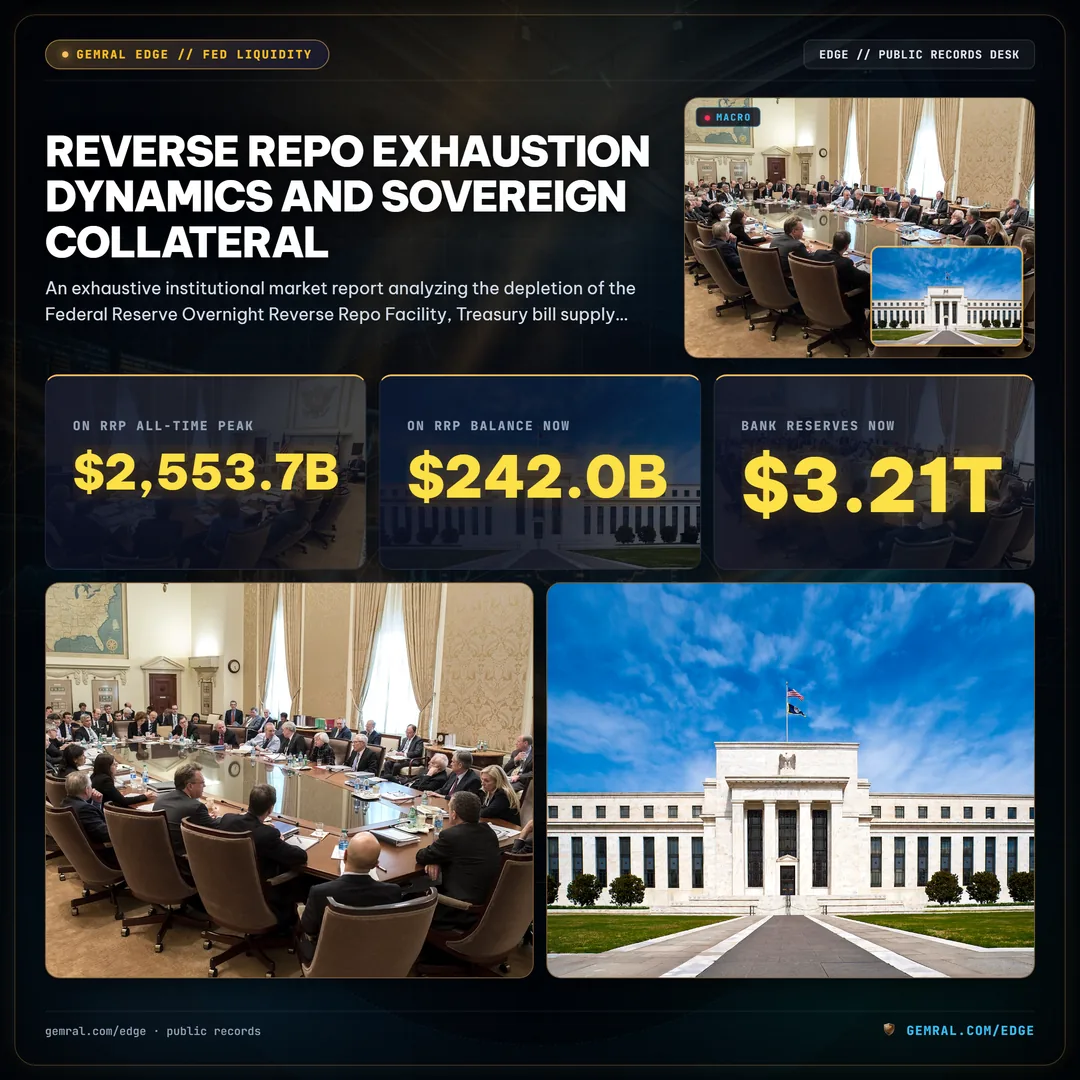
Over the past three years, the domestic financial system operated under an historic monetary shock absorber: the 美联储's 隔夜逆回购 (ON RRP) facility. As the central bank initiated 量化紧缩 (QT) (QT), running down its 资产负债表 assets while the U.S. 财政部 surged front-end bill issuance to finance multi-trillion dollar federal budget deficits, institutional market participants experienced little to no liquidity stress. Money market mutual funds (MMFs) systematically shifted cash out of the Fed's overnight facility and into higher-yielding sovereign 财政部 paper. That multi-year buffer has now reached functional exhaustion. With ON RRP balances plunging from an all-time peak of $2,553.7B in 12月 2022 to $242.0B in 9月 2026—a structural contraction of 90.5%—the liquidity drainage from ongoing sovereign issuance and central bank 资产负债表 runoff is transitioning directly into 商业银行准备金.
This structural inflection point transforms the operational reality of global financial markets. Between 2022 and mid-2025, 量化紧缩 (QT) did not drain commercial bank deposits or reserve balances because private 货币市场 liquidity parked at the central bank absorbed the bulk of new sovereign debt issuance. Now that this sterile cash mountain is largely depleted, every incremental dollar of net 财政部 issuance and 美联储 roll-off must compete directly for bank 资产负债表 space and primary dealer repo financing. Examining public data releases from the 美联储 Bank of New York Open Market Operations, the 美联储 Board H.4.1 statistical releases, the U.S. 财政部 Office of Debt Management, and the Office of Financial Research (OFR), this empirical analysis maps the exact trajectory of 抵押品周转率, secured rate dispersion, and dealer inventory bottlenecks across the sovereign funding complex.
逆回购工具耗尽机制:追溯从2.55万亿美元降至2420亿美元的多年流动性抽离
To comprehend the structural significance of the current funding environment, one must analyze how the 美联储隔夜逆回购 facility accumulated more than $2.5T in idle liquidity following the emergency fiscal and monetary responses of 2020 and 2021. The combination of direct 美联储 asset purchases, statutory reserve requirement eliminations, and unprecedented federal stimulus payments flooded commercial banks with deposits. Because regulatory frameworks—specifically the Supplementary Leverage Ratio (SLR)—penalized commercial banks for holding low-yielding cash reserves on 资产负债表 without additional Tier 1 capital, banks actively turned away institutional non-deposit wholesale funds.
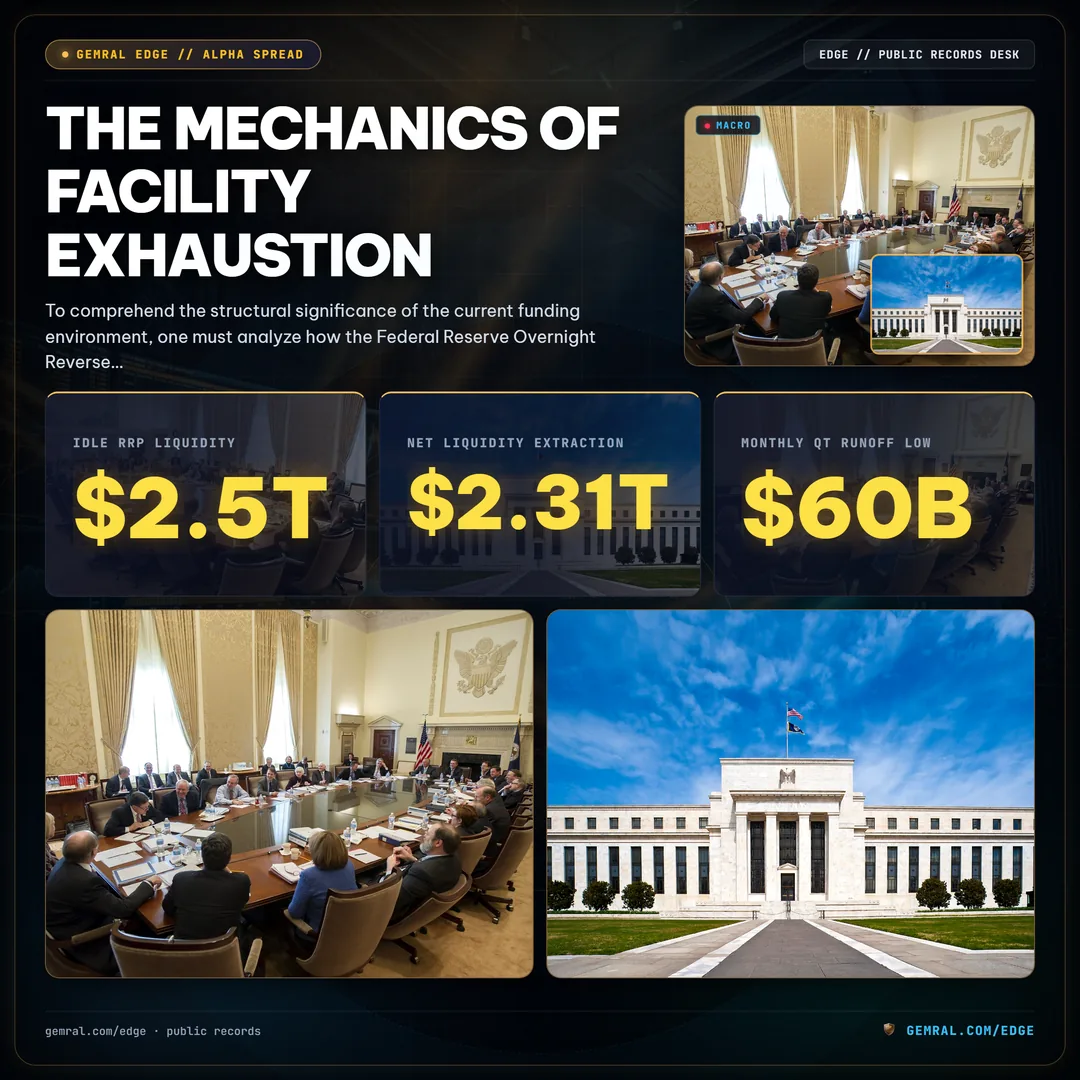
Simultaneously, the 美国财政部 sharply contracted bill issuance in 2021 and 2022 as pandemic balances normalized, leaving prime and government 货币市场共同基金 (MMF) with virtually no safe, short-term sovereign paper offering a positive spread above zero. The 纽约联储's ON RRP facility served as the relief valve, providing an overnight secured risk-free rate backed by the Fed's system open market account (SOMA) 财政部 holdings. By 12月 2022, daily utilization peaked at an historic $2,553.7B, effectively locking away more than one-tenth of total domestic sovereign debt outside private circulation.
The subsequent contraction occurred in distinct, predictable phases dictated by 财政部 yield differentials. In 6月 2023, following the suspension of the federal debt ceiling, the 财政部 commenced an unprecedented ramp-up of front-end debt issuance. Yields on newly auctioned 1-month, 3-month, and 6-month 短期国债s cleared anywhere from 5 to 18 basis points above the ON RRP offering rate. For 货币市场 fund managers with fiduciary yield mandates, the incentive structure shifted completely. Balances dropped steadily: from $2,220.4B in 6月 2023 to $1,385.2B by 12月 2023, then descending through $672.5B in 6月 2024, $345.1B by 12月 2025, and arriving at $242.0B by 9月 2026.
This 90.5% collapse represents an aggregate net extraction of more than $2.31T in liquid capital from the facility. The key operational observation for institutional participants is that this $2.31T drainage acted as a synthetic quantitative easing program during an official quantitative tightening cycle. While the 美联储 was theoretically removing $60B to $95B per month from its asset portfolio, the domestic financial system experienced zero aggregate reserve scarcity because the money supply was replenished in real time by funds flowing out of the central bank's reverse repo facility and into the real economy via sovereign deficit spending.
| 报告周期 | ON RRP规模 ($B) | 累计抽离规模 ($B) | 抽离比例 (%) | 核心交易对手驱动因素 |
|---|---|---|---|---|
| 12月 2022 (Peak) | $2,553.7B | $0.0B | 0.0% | SLR constraints; negative bill supply |
| 6月 2023 | $2,220.4B | $333.3B | 13.1% | Debt ceiling resolution; initial bill flood |
| 12月 2023 | $1,385.2B | $1,168.5B | 45.8% | MMF bill allocation reallocation |
| 6月 2024 | $672.5B | $1,881.2B | 73.7% | Sustained front-end sovereign supply premium |
| 12月 2025 | $345.1B | $2,208.6B | 86.5% | Structural facility floor testing |
| 9月 2026 | $242.0B | $2,311.7B | 90.5% | Residual statutory liquidity; near-exhaustion |
主权前端发债动态:短期国债如何替代美联储逆回购工具
The velocity at which the ON RRP facility emptied was governed almost entirely by decisions made within the U.S. 财政部's Office of Debt Management and recommendations provided by the 财政部 Borrowing Advisory Committee (TBAC). Historically, the 财政部 adhered to a general guideline suggesting that short-term 短期国债s should constitute between 15% and 20% of total outstanding marketable sovereign debt. Following the 2023 debt ceiling resolution, however, facing soaring intermediate and long-term borrowing costs as the 10-year 财政部 yield fluctuated between 4.0% and 4.8%, the 财政部 made the explicit strategic calculation to over-index into the front end.

By issuing large-scale tranches of short-duration bills rather than locking in multi-decade borrowing costs at cycle-peak rates, the 财政部 effectively capitalized on the $2.55T cash reservoir sitting idle at the 纽约联储. As demonstrated in Figure 2, cumulative net 短期国债 issuance expanded aggressively across consecutive calendar years: +$1.24T in CY 2023, reaching +$1.88T by CY 2024, +$2.18T in CY 2025, and standing at +$2.36T year-to-date in 9月 2026.
The correlation between cumulative net 短期国债 issuance and cumulative ON RRP drainage is practically absolute. Between January 2023 and 9月 2026, the net issuance of $2.36T in sovereign bills was matched by an almost identical $2.31T reduction in ON RRP utilization. Money market fund asset allocation reports filed on SEC Form N-MFP confirm this mechanical substitution: fund allocations to sovereign 短期国债s surged from 14% of aggregate assets in early 2023 to over 48% in 2026, while allocations to the Fed ON RRP collapsed from 62% to under 6%.
The remaining $242.0B in the facility does not represent dynamic, price-sensitive cash. A measurable portion belongs to smaller government-sponsored enterprises (GSEs), municipal liquidity managers, and specialized institutional counterparties that face statutory restrictions preventing them from purchasing sovereign bills in secondary markets or holding uncollateralized commercial bank deposits. Consequently, the operational buffer available to absorb future 短期国债 auctions is effectively zero.
银行准备金缓冲垫:评估最低舒适准备金水平(LCLoR)边界
With the ON RRP facility no longer capable of cushioning ongoing sovereign issuance, the entire burden of liquidity provision shifts to the commercial banking sector. In the 美联储's operating framework of "ample reserves," 商业银行准备金余额 held at 美联储 Banks represent the ultimate baseline of domestic financial liquidity. When the central bank shrinks its 资产负债表 via QT, it does so by allowing 财政部 securities and agency mortgage-backed securities (MBS) to mature without reinvestment. If the non-bank public or 货币市场基金 purchase replacement securities using funds withdrawn from the ON RRP, 银行准备金 remain untouched. But if securities are purchased by commercial banks or non-bank investors using commercial bank deposits, aggregate 银行准备金 decline dollar-for-dollar.
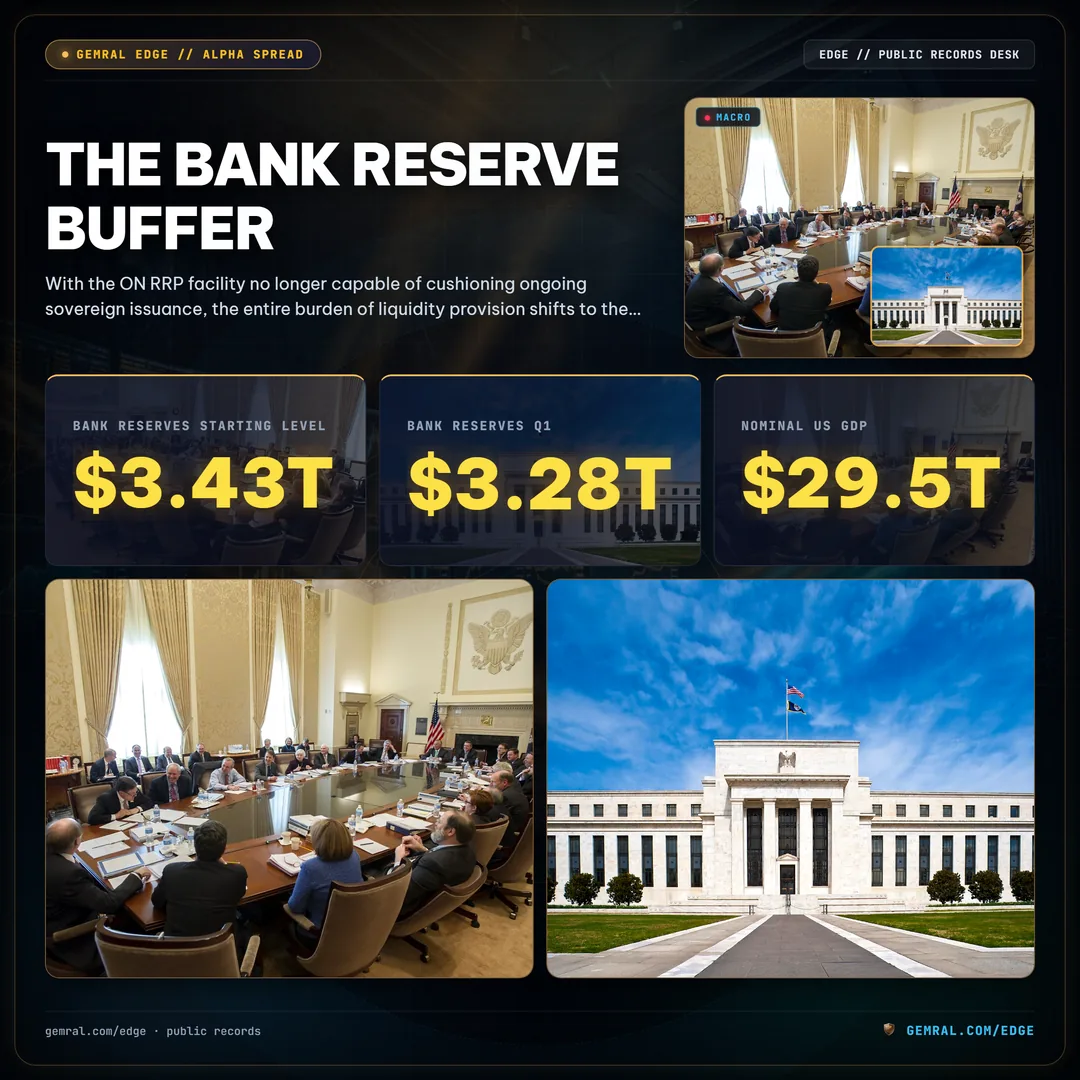
Public data from the 美联储 Board H.4.1 statistical release illustrates this critical transition. Throughout 2024 and 2025, 商业银行准备金余额 remained remarkably stable, hovering between $3.32T and $3.47T. Despite hundreds of billions in central bank asset runoff, reserves actually peaked at $3.47T in Q1 2025 because ON RRP drainage was outstripping the pace of QT.
Beginning in early 2026, as ON RRP balances dropped below the $400B threshold, this insulation failed. Bank reserves dropped from $3.43T in Q3 2025 to $3.28T in Q1 2026, and have now declined to $3.21T as of 9月 2026. This brings aggregate reserve balances directly into the critical zone approaching the central bank's estimated 最低舒适准备金水平 (LCLoR) (LCLoR).
What constitutes LCLoR? Academic research from the 美联储 Board, empirical survey data from the Senior Financial Officer Survey (SFOS), and 纽约联储 open market analysis converge on the estimate that commercial banks require an aggregate reserve level equal to approximately 10% to 11% of annual Gross Domestic Product to satisfy internal intraday liquidity requirements, resolution liquidity mandates (RLAP/RLFI), and Basel III Liquidity Coverage Ratios (LCR). With nominal U.S. GDP approaching $29.5T in late 2026, the theoretical boundary where reserves transition from "ample" to "scarce" is estimated at $3.00T to $3.10T.
At $3.21T, the banking system currently possesses less than $160B in surplus cushion above this structural danger zone. Furthermore, reserve distribution across the banking system is notoriously skewed. Approximately 60% of aggregate reserves are held by the top eight U.S. Global Systemically Important Banks (G-SIBs). Regional and mid-sized commercial institutions operate with far leaner reserve cushions, meaning that funding stress will not manifest uniformly; rather, it will erupt suddenly in localized funding markets when individual institutions find themselves forced to bid aggressively for overnight liquidity to meet statutory settlement obligations.
有担保货币市场摩擦:SOFR-EFFR分歧与季末流动性压力点
The clearest empirical signal of tightening wholesale liquidity is the microstructure behavior of overnight interest rate benchmarks: the 担保隔夜融资利率 (SOFR) (SOFR) and the 有效联邦基金利率 (EFFR) (EFFR). Under an ample-reserve regime characterized by substantial excess liquidity, SOFR—which reflects collateralized financing transactions backed by U.S. Treasuries—trades steadily at or slightly below the Fed's interest on reserve balances (IORB) rate and on par with the unsecured EFFR.
However, when collateral supply overwhelms available 资产负债表 financing capacity, cash lenders demand a yield premium to absorb collateral, driving secured financing rates higher. Over the course of 2024, the daily spread between SOFR and EFFR remained locked in an exceptionally tight band around 0.0 bps, reflecting continuous market intermediation. By late 2025, minor volatility began surfacing around 财政部 auction settlement dates, with month-end spreads widening to +4.5 bps and +7.0 bps.
In 2026, as ON RRP cash buffers evaporated, rate dispersion accelerated dramatically. During recent quarter-end settlement cycles and heavy 财政部 refunding dates, SOFR surged to trade +12.0 basis points above EFFR. This spread inversion—where borrowing cash on a fully collateralized, risk-free basis backed by U.S. Treasuries costs measurablely more than borrowing cash on an uncollateralized interbank basis—is the definitive symptom of 资产负债表 congestion.
| Regime Period | SOFR与EFFR平均利差 | 结算峰值波动 | 三方回购交易量 | 市场运行状况描述 |
|---|---|---|---|---|
| 2023 - Early 2024 | -0.5 to 0.0 bps | +1.5 bps | $1.85T Daily | Excess liquidity; ON RRP absorbs marginal cash |
| Late 2024 - 2025 | +0.5 to +1.5 bps | +7.0 bps | $2.05T Daily | Transition phase; 抵押品周转率 rises |
| 2026 Year-to-Date | +2.8 to +4.2 bps | +12.0 bps | $2.35T Daily | Collateral indigestion; active 资产负债表 rationing |
When secured financing rates print persistently above unsecured central bank policy benchmarks, it signals that the primary bottleneck in the global financial system is no longer credit risk, but collateral capacity. Primary dealers, constrained by regulatory leverage caps and internal risk limits, cannot intermediate the large-scale influx of sovereign paper without widening bid-ask spreads and demanding higher financing rates from leveraged non-bank market participants, such as relative-value basis hedge funds and fixed-income arbitrageurs.
外国官方美元储备托管:FIMA逆回购工具在全球美元资金管道中的核心角色
While domestic liquidity dynamics are dominated by commercial banks and domestic 货币市场基金, the international dimension of sovereign debt absorption introduces a secondary layer of liquidity insulation that is frequently overlooked by conventional market commentators: the Foreign and International Monetary Authorities (FIMA) reverse repo facility.
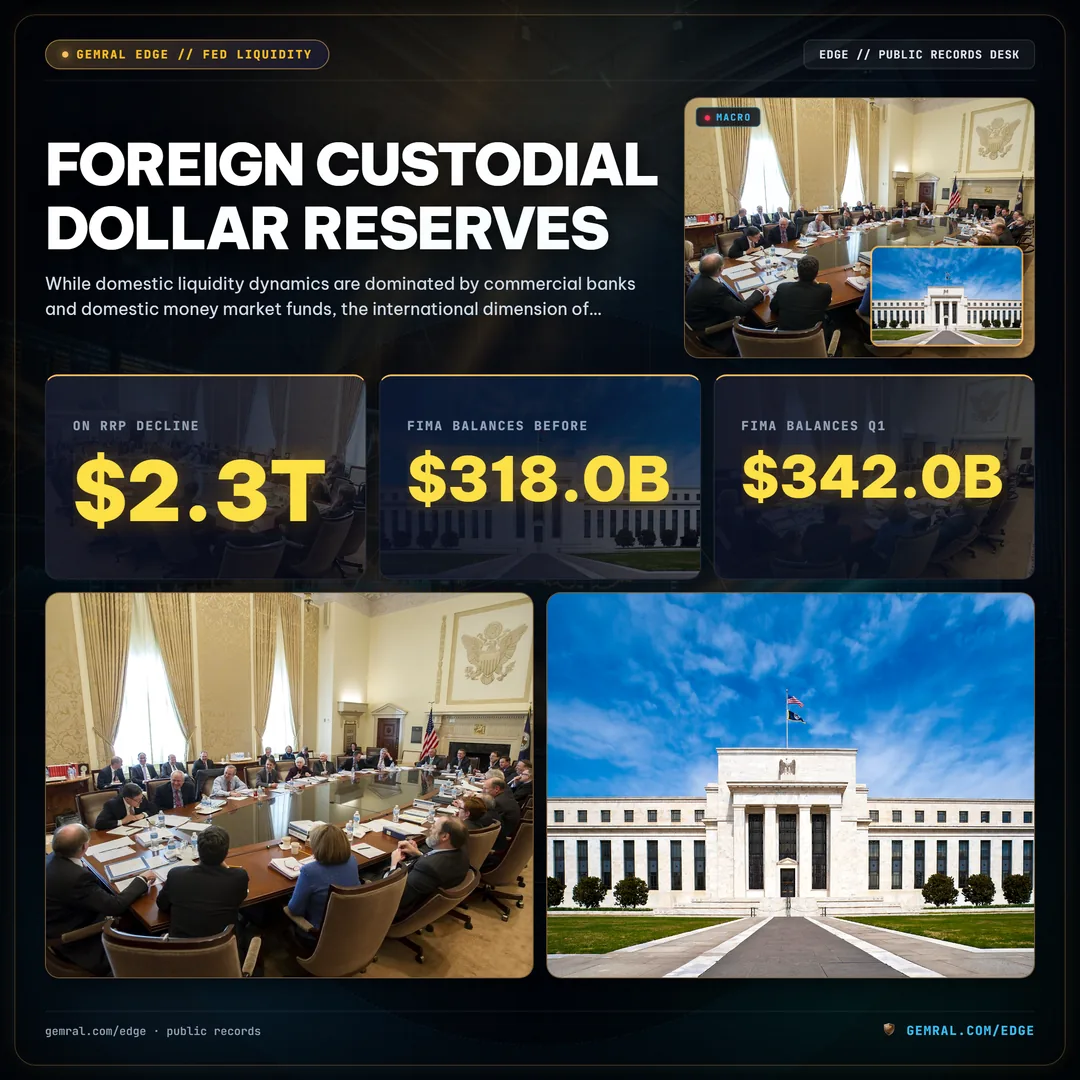
Administered by the 美联储 Bank of New York, the FIMA facility permits foreign central banks, monetary authorities, and international financial institutions to place excess dollar holdings with the Fed overnight. Rather than holding deposits in private commercial banks or selling sovereign securities into open secondary markets when domestic dollar interventions are required, foreign official institutions park liquidity in this custodial facility, earning an overnight risk-free return backed by the Fed.
美联储 H.4.1 资产负债表 disclosures reveal that while the domestic ON RRP facility was collapsing by more than $2.3T, the FIMA reverse repo facility experienced steady accumulation. Aggregate foreign custodial balances expanded from $318.0B in Q3 2024 to $342.0B in Q1 2025, reaching $361.0B in Q3 2025, $378.0B in Q1 2026, and climbing to $395.0B in 9月 2026.
This steady accumulation of almost $400B in foreign official dollar reserves parked at the 美联储 represents an important structural leakage from the domestic financial system. Foreign central banks, contending with elevated sovereign trade frictions, foreign exchange rate defense pressures, and volatile commodity pricing, have prioritized liquid dollar reserves held directly at the central bank over purchasing intermediate U.S. 财政部 debt. Because these dollars remain sterilised in custodial accounts at the 纽约联储, they are completely unavailable to finance the ongoing issuance of domestic sovereign debt, exacerbating the pressure on domestic 一级交易商.
一级交易商资产负债表弹性:承压融资国债存货资产
At the center of sovereign debt distribution sit the 24 一级交易商 designated by the 美联储 Bank of New York. These institutional broker-dealers are obligated by regulatory charter to participate meaningfully in all U.S. 财政部 auctions, acting as underwriters of last resort for the sovereign government. When an auction clears with weak indirect bidding from foreign central banks or institutional asset managers, 一级交易商 must absorb the unallocated sovereign paper directly onto their 资产负债表s.

To warehouse these large-scale debt inventories, 一级交易商 rely on the repo market, borrowing cash overnight against their 财政部 inventory. However, post-2008 banking regulations—most notably the Basel III leverage ratio and the Supplementary Leverage Ratio (SLR)—impose non-risk-weighted capital charges on total assets. Under these rules, holding a pristine, risk-free 3-month 短期国债 requires the same regulatory equity capital backing as extending a riskier commercial loan.
According to the 纽约联储's Form FR 2004 statistical reports, primary dealer net inventory holdings of U.S. 中长期国债s and bills have surged to historic extremes. Average dealer inventory positions stood at $78.0B in 2023 and $105.0B in 2024. As auction sizes across 2-year, 5-year, 10-year, and 30-year refunding operations expanded to record post-pandemic highs throughout 2025 and 2026, dealer inventories escalated to an average of $142.0B in 2025, ultimately surging to a record peak of $184.0B in 9月 2026.
An aggregate dealer inventory of $184.0B represents a critical operational bottleneck. Dealers are rapidly approaching their internal 资产负债表 risk limits and capital allocation ceilings. When dealer inventory capacity becomes saturated, their ability to intermediate repo markets deteriorates rapidly. The cost of financing off-the-run Treasuries escalates, haircuts increase, and 一级交易商 are forced to charge wider spreads to hedge funds running basis trades (arbitraging the price discrepancy between 财政部 futures and cash 财政部 bonds). Because these relative-value hedge funds are the single largest marginal buyers of 财政部 debt, any financing shock in the repo market directly threatens the clearing capacity of sovereign auctions.
主权债务再融资之墙:2026-2028年滚动到期时间表与抵押品周转率要求
The systemic urgency of this liquidity transition is intensified by the sovereign maturity schedule. The United States federal government is not merely financing current ongoing fiscal budget deficits (which continue to exceed $1.8T annually); it is concurrently forced to refinance large-scale tranches of existing debt issued during the low-rate regime of 2020-2021 that are now reaching final maturity.

Official refunding projections from the U.S. 财政部 Office of Debt Management demonstrate that over the eight-quarter window spanning Q4 2026 through Q2 2028, the sovereign government must roll over an astounding $7.93T in maturing marketable debt obligations. As broken down in Figure 7, quarterly refinancing requirements will consistently demand between $0.98T and $1.25T in capital turnover:
Examining the quarterly roll-over schedule reveals relentless structural demands:
- Q4 2026: $1.25T maturing sovereign debt
- Q1 2027: $1.18T maturing sovereign debt
- Q2 2027: $1.22T maturing sovereign debt
- Q3 2027: $1.15T maturing sovereign debt
- Q4 2027: $1.10T maturing sovereign debt
- Q1 2028: $1.05T maturing sovereign debt
- Q2 2028: $0.98T maturing sovereign debt
When debt is refinanced, it does not simply vanish; maturing paper must be paid off with newly auctioned paper. In prior years, when a 财政部 auction cleared, the cash utilized to purchase that debt was largely mobilized from the ON RRP facility, creating zero drag on private credit markets. Over the next 24 months, however, this $7.93T in rollover obligations must compete directly against commercial bank 资产负债表s, private wealth management capital, and corporate treasury accounts.
This dynamic demands an unprecedented acceleration in sovereign 抵押品周转率—the speed at which 财政部 securities can be rehypothecated, mobilized as collateral in secured lending agreements, and transformed into immediate liquidity. If 抵押品周转率 slows due to dealer 资产负债表 constraints or regulatory leverage friction, the sovereign government will find itself forced to offer increasingly steep term premiums and concession yields to clear upcoming auctions, directly transmitting upward pressure across the entire corporate and consumer credit curve.
净流动性传导机制与宏观资产影响:在后缓冲垫货币新常态中布局
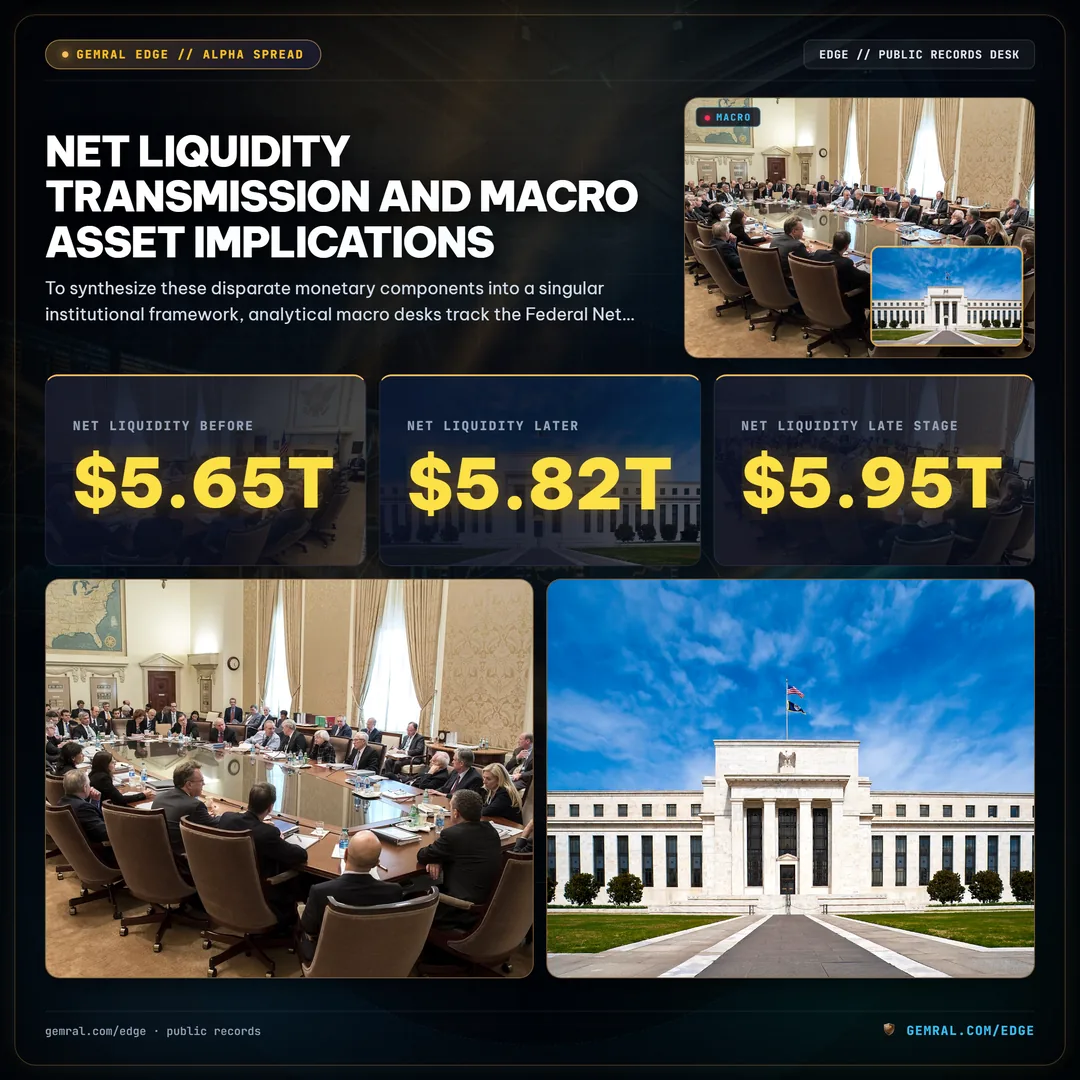
To synthesize these disparate monetary components into a singular institutional framework, analytical macro desks track the Federal Net Liquidity Transmission Index. Formally defined as 美联储 Total Assets minus the 财政部 General Account (TGA) cash balance minus the 隔夜逆回购 (ON RRP) facility balance, this metric reflects the actual quantity of unencumbered central bank money circulating within the private banking system.
$$\text{Net Liquidity} = \text{Fed Total Assets} - \text{财政部 General Account (TGA)} - \text{隔夜逆回购 (ON RRP)}$$
As charted in Figure 8, the trajectory of Federal Net Liquidity reveals why risk assets exhibited such resilient performance throughout the 美联储's tightening cycle. In 12月 2022, Net Liquidity stood at $5.65T. Over the subsequent three years, despite active 量化紧缩 (QT), Net Liquidity actually expanded: rising to $5.82T in 12月 2023, $5.95T in 12月 2024, and peaking at $6.02T in 12月 2025.
This counter-intuitive expansion was entirely the mathematical consequence of the ON RRP facility run-down. Because the ON RRP is a liability on the 美联储's 资产负债表 that subtracts from net liquidity, every dollar drained from the facility and paid to 短期国债 investors added a dollar back into the financial system, completely overriding the contractionary effect of asset runoff.
In mid-2026, however, this dynamic inverted. With the ON RRP facility effectively exhausted at $242.0B, the subtraction mechanism ceased functioning. Ongoing central bank 资产负债表 runoff, combined with 财政部 cash replenishment into the TGA, began extracting pure liquidity from 商业银行准备金. Net Liquidity peaked at $6.02T, fell to $5.85T by 6月 2026, and has dropped sharply to $5.68T in 9月 2026—a net destruction of $340B in active financial system liquidity in less than nine months.
- End of 量化紧缩 (QT): As 商业银行准备金 drop below $3.15T and approach the $3.00T LCLoR threshold, the 美联储 will be forced to formally terminate its 资产负债表 runoff program ahead of consensus expectations to prevent a chaotic recurrence of the 9月 2019 repo crisis.
- 常备回购便利常态化使用: Utilization of the Standing Repo Facility (SRF), which currently sits virtually dormant, will begin seeing regular, recurring uptake by 一级交易商 as collateral congestion spills over into daily market closes.
- 抵押品溢价让步增加: The 财政部 will face structural resistance in continuing its disproportionate reliance on short-term bills. The necessary shift back toward intermediate coupon issuance (3-year, 5-year, and 10-year notes) will require a substantial re-pricing of long-duration term premiums across global sovereign debt markets.
As sovereign collateral supply outstrips available 资产负债表 elasticity, the era of frictionless monetary insulation is over. Market participants who constructed models based on the benign liquidity backdrop of 2023-2025 are navigating a fundamentally altered monetary topography. In this post-buffer landscape, 抵押品周转率, primary dealer 资产负债表 limits, and secured rate spreads will dictate the pricing of risk across every major financial asset class.