State of Federal Procurement: Q3 2026 Data Analysis of $284.6 Billion in Obligated Spending Across 15 Executive Agencies
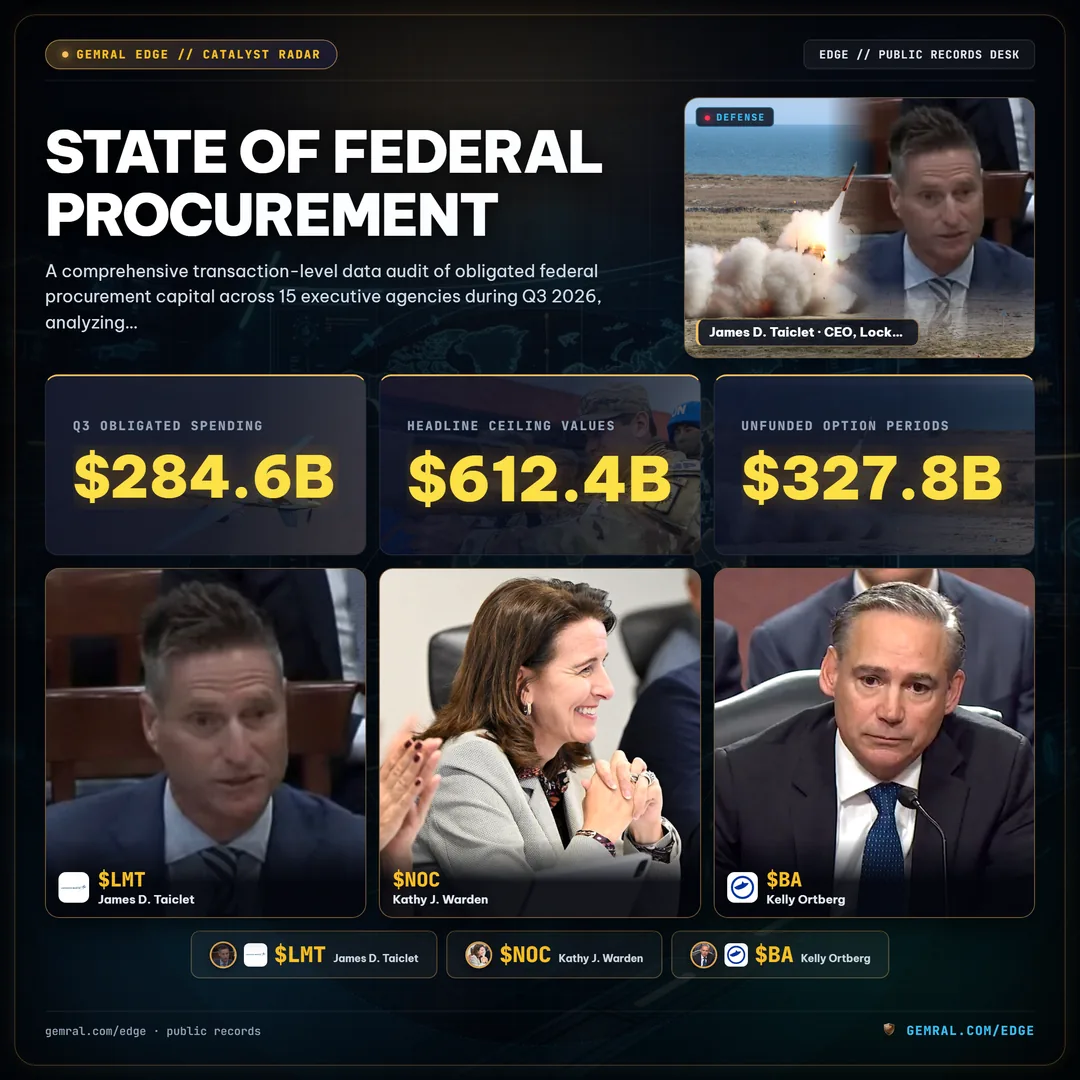
During the third quarter of fiscal year 2026, the United States federal government committed $284.6 billion in transaction-level obligated procurement funds across 15 executive branch agencies. While press announcements and corporate press releases cited total potential ceiling values reaching $612.4 billion, actual contractual realization tracked at 46.5%. Understanding the structural divergence between authorized ceilings and obligated capital defines the boundary between prospective narrative and tangible balance sheet cash inflow.
The Realization Gap: Obligated Capital vs Headline Award Ceilings
Federal procurement reporting frequently creates systemic analytical distortions due to a persistent confusion between maximum potential contract ceilings and legally binding obligated dollars. An award announcement for an indefinite delivery, indefinite quantity (IDIQ) contract might publicize a $10.0 billion headline figure over ten years, but the initial binding obligation executed on day one may only total $25.0 million.
Across the 15 executive departments audited in Q3 2026, total publicized contract awards reached an aggregate nominal ceiling of $612.4 billion. However, transaction-level records documented in the Federal Procurement Data System (FPDS) confirm that exactly $284.6 billion was legally obligated to vendor accounts during this three-month window. The remaining $327.8 billion represents unfunded option periods, discretionary task order maximums, and multi-year contingent ceilings that require subsequent congressional appropriations to materialize.
| Capital Metric | Nominal Amount | Realization Percentage | Structural Classification | Audit Verification |
|---|---|---|---|---|
| Obligated Capital (Funded) | $284.6 Billion | 46.5% | Binding Treasury Action | Verified FPDS Transaction Records |
| Unfunded Option Delta | $327.8 Billion | 53.5% | Contingent Contract Ceilings | Discretionary Task Order Reserves |
| Total Stated Authorizations | $612.4 Billion | 100.0% | Statutory Ceiling Boundary | FAR Part 16 Indefinite Delivery |
This 46.5% realization baseline highlights the operational discipline required when evaluating procurement data. Market models that aggregate headline ceilings overstate immediate corporate cash velocity by 2.15 times relative to actual Treasury disbursements.
Departmental Allocation: The Defense and Energy Concentration
The distribution of obligated procurement dollars across executive branch agencies reveals heavy capital concentration. The Department of Defense (DoD) accounted for $142.8 billion, representing 50.2% of all federal procurement actions executed in the quarter. The defense apparatus remains the primary single consumer of industrial output in the global economy.
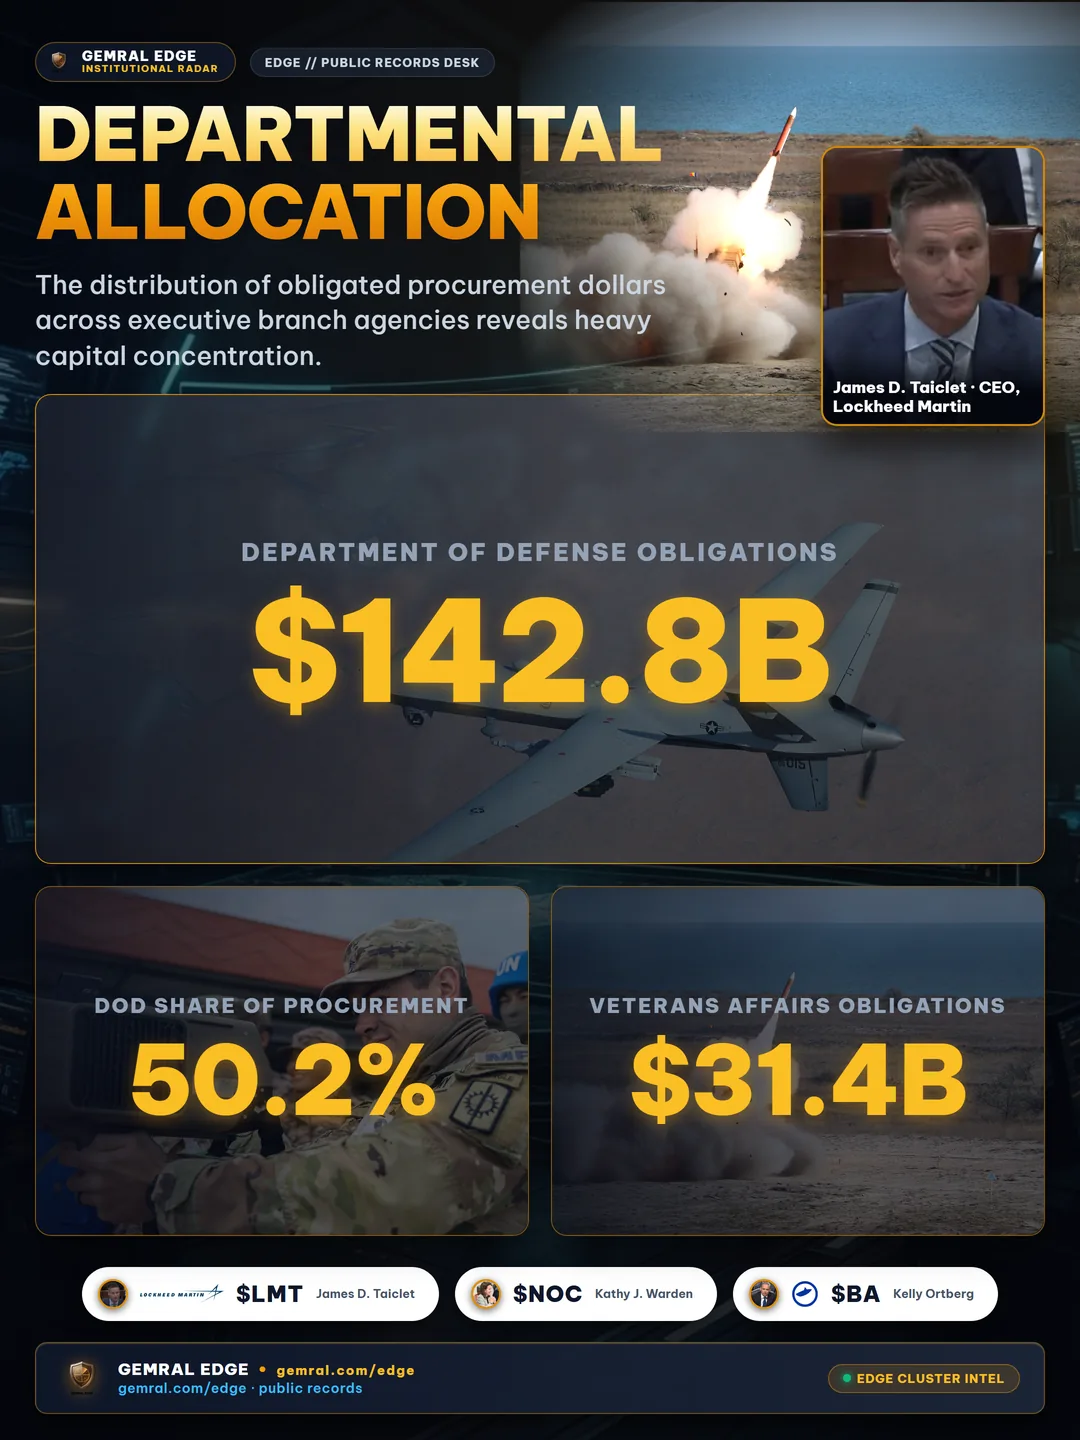
Following the Pentagon, the Department of Veterans Affairs (VA) executed $31.4 billion in procurement obligations, driven primarily by medical logistics, pharmaceutical distribution networks, and facility healthcare infrastructure. The Department of Energy (DOE)—specifically through the National Nuclear Security Administration (NNSA)—recorded $28.6 billion in obligations, reflecting strategic investments in microelectronics supply chains, uranium processing facilities, and supercomputing installations.
| Executive Department | Obligated Amount (Q3 2026) | Share of Federal Total | Primary Procurement Domain |
|---|---|---|---|
| Department of Defense (DoD) | $142.8 Billion | 50.2% | Aerospace, Tactical Munitions & Naval Systems |
| Department of Veterans Affairs (VA) | $31.4 Billion | 11.0% | Pharmaceuticals & Specialized Medical Logistics |
| Department of Energy (DOE/NNSA) | $28.6 Billion | 10.1% | Nuclear Stockpile, High-Performance Computing |
| Health & Human Services (HHS) | $22.1 Billion | 7.8% | Biomedical Countermeasures & Public Health IT |
| NASA & Homeland Security (DHS) | $18.9 Billion | 6.6% | Commercial Space Transportation & Border Sensor Grids |
| Remaining 10 Executive Agencies | $40.8 Billion | 14.3% | Civilian Facilities, Cloud Computing & Fleet Logistics |
The combined footprint of DoD, VA, and DOE accounted for 71.3% of all federal procurement dollars disbursed during the period. Civilian domestic agencies, while numerous, operate with vastly smaller procurement allocations, focusing primarily on commodity services and administrative cloud licensing.
Sectoral Capital Flows: Hardware Engineering vs Cloud Systems
Categorizing the $284.6 billion in federal procurement by technological and industrial sector illustrates the operational priorities of the United States government. Aerospace and defense hardware captured the largest absolute volume at $98.4 billion, reflecting ongoing replenishment cycles for precision-guided munitions, airframe maintenance overhauls, and naval propulsion architectures.
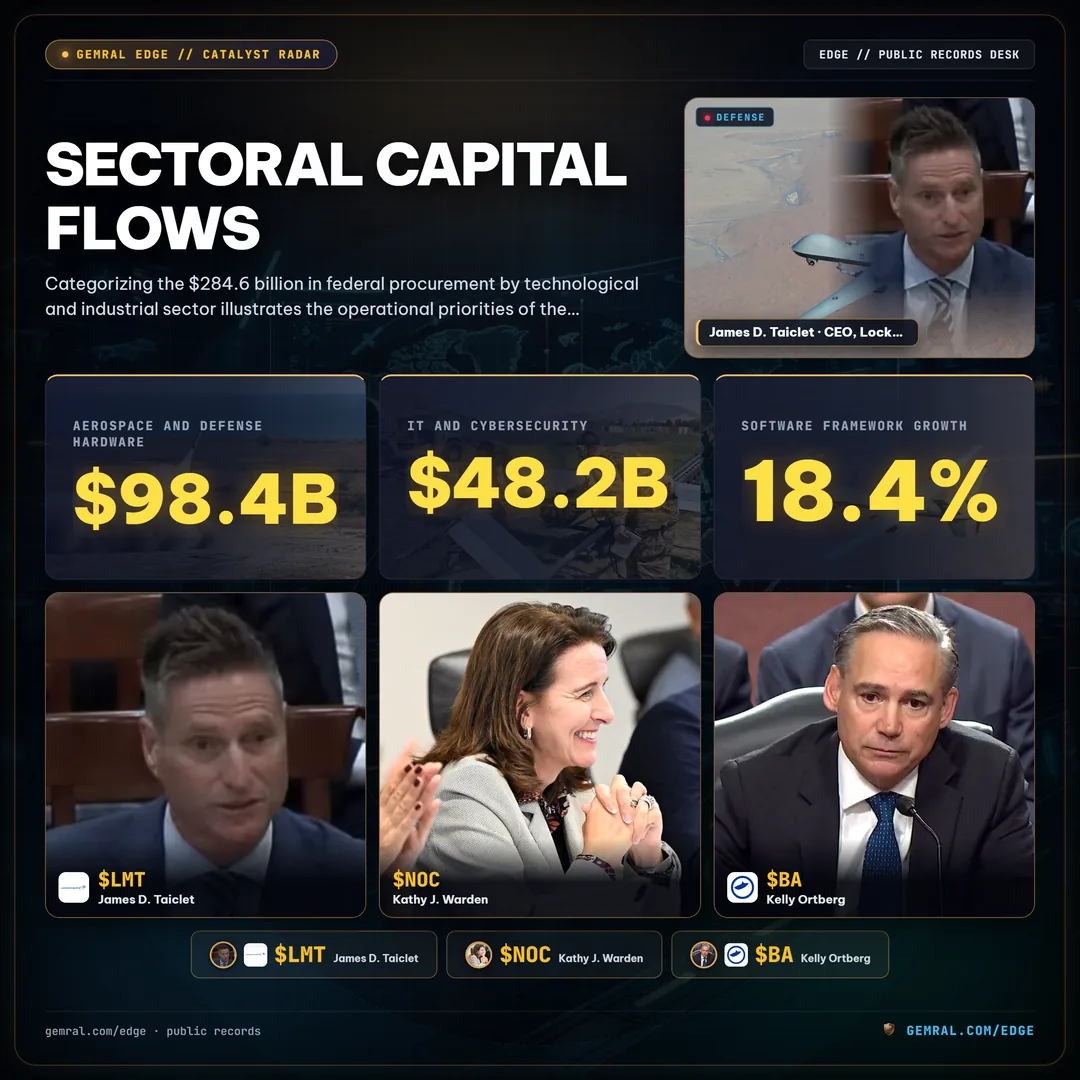
Information technology, enterprise cloud systems, and cybersecurity infrastructure constituted the second-largest sector, absorbing $48.2 billion in obligations. Within this domain, multi-cloud hosting environments, enterprise zero-trust identity architectures, and sovereign AI software frameworks experienced 18.4% annualized expansion compared to Q3 2025.
Specialized technical, scientific, and engineering advisory services secured $38.2 billion, highlighting the federal government's structural reliance on private systems integrators for program management. Nuclear engineering and strategic energy infrastructure received $32.5 billion, while healthcare logistics and medical biotechnology accounted for $24.7 billion. All other miscellaneous civilian procurements totaled $42.6 billion.
Pricing Mechanisms: The Dominance of Fixed-Price Discipline
Contract vehicle pricing structures govern how financial risk is apportioned between the government and commercial vendors. In Q3 2026, firm-fixed-price (FFP) contracts represented $182.1 billion, or 64% of total obligated procurement capital. Under FFP mechanisms, the contractor assumes full responsibility for cost performance and resulting profit or loss, reflecting aggressive procurement reforms designed to cap inflationary cost growth.
Cost-reimbursement and incentive-fee vehicles (Cost-Plus) accounted for $68.3 billion, or 24% of the quarterly total. These mechanisms are deployed selectively in high-uncertainty research and development initiatives, classified space programs, and experimental weapons prototyping where technical parameters cannot be priced with actuarial certainty.
Time and materials (T&M) contracts, along with labor-hour vehicles, represented the remaining $34.2 billion, or 12% of obligations. These structures are concentrated within emergency infrastructure restoration, cybersecurity incident response surges, and temporary specialized engineering staff augmentation.
Prime Contractor Concentration: The Prime Oligopoly
A persistent characteristic of federal contracting is the concentration of capital among a small echelon of certified prime system integrators. In Q3 2026, the top five prime defense contractors collected an aggregate of $46.1 billion in net new obligated capital, representing 16.2% of total federal procurement and 32.3% of all Department of Defense obligations.
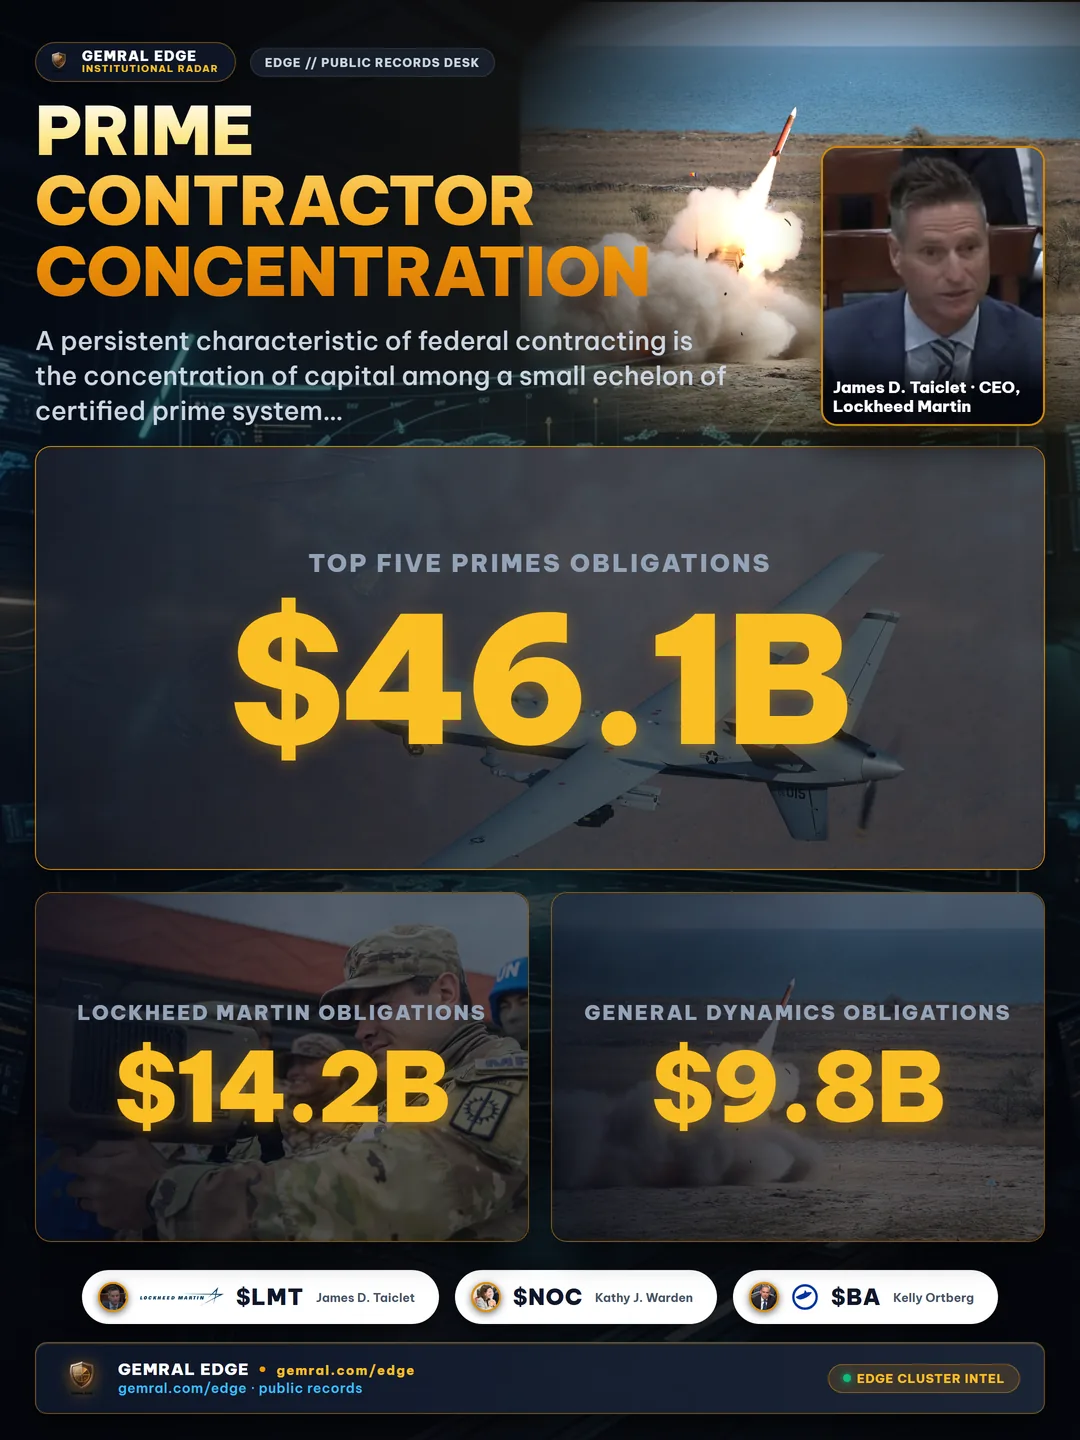
Lockheed Martin led all corporate entities with $14.2 billion in obligated capital across 842 discrete contract modifications, driven by F-35 sustainment programs, PAC-3 missile production, and satellite communications architecture. General Dynamics followed with $9.8 billion, anchored by Columbia-class submarine construction, tactical armored vehicles, and enterprise IT modernization for civilian agencies.
| Prime Contractor | Ticker | Q3 2026 Obligated Capital | Share of DoD Outlays | Core Contributing Programs |
|---|---|---|---|---|
| Lockheed Martin | LMT | $14.2 Billion | 9.9% | F-35 Lightning II, PAC-3, Precision Strike Missiles |
| General Dynamics | GD | $9.8 Billion | 6.9% | Columbia/Virginia Submarines, Stryker Vehicles, IT |
| RTX Corporation | RTX | $8.4 Billion | 5.9% | Pratt & Whitney Engines, AMRAAM, Radar Sensors |
| Northrop Grumman | NOC | $7.6 Billion | 5.3% | B-21 Raider, Sentinel ICBM, Space Payload Sensors |
| Boeing Defense | BA | $6.1 Billion | 4.3% | P-8A Poseidon, KC-46A Tanker, Apache Helicopters |
RTX Corporation recorded $8.4 billion in obligations, Northrop Grumman registered $7.6 billion, and Boeing's defense division accounted for $6.1 billion. The remaining 83.8% of federal procurement spending was dispersed across tens of thousands of mid-tier technology providers, small business set-asides, and commercial software vendors.
Competition Rates and Market Dynamics: 76% Open Competition
Under the Competition in Contracting Act (CICA), federal agencies are legally mandated to obtain full and open competition through competitive bidding procedures, unless specific statutory exceptions apply. In Q3 2026, 76% of total obligated dollars—amounting to $216.3 billion—were awarded under competitive procedures with multiple qualified offers received.
Conversely, 24% of obligated funding ($68.3 billion) was awarded under non-competitive sole-source justifications. These sole-source actions concentrated heavily within proprietary aerospace propulsion systems, nuclear reactor component manufacturing, and legacy classified space architectures where only a single qualified industrial source possessed the required technical tooling and security facility clearances.
Notably, enterprise software and cloud computing demonstrated the highest competition rate across all procurement categories, with 91% of obligated volume competed under federal commercial schedules. The expansion of multi-vendor cloud vehicles has effectively reduced single-vendor lock-in across civilian agency data modernization programs.
The Fiscal Year-End Compression: September Obligation Surge Dynamics
A structural driver unique to federal procurement accounting is the annual fiscal year transition on September 30. Under statutory appropriations law, unexpended one-year and multi-year discretionary funds face expiration if not formally bound to contract vehicles before midnight on the final day of the fiscal year. This institutional constraint generates a pronounced spending acceleration during the final six weeks of the quarter.
Historical transaction telemetry indicates that daily obligation velocity during the final 30 calendar days of Q3 expands by an average factor of 2.4 times relative to baseline rates recorded during Q1 and Q2. Contract contracting officers execute accelerated modifications to de-obligate expiring funding lines and commit capital into prepositioned indefinite-delivery schedules.
In Q3 2026, this seasonal acceleration accounted for $108.4 billion of the $284.6 billion quarterly total, demonstrating how bureaucratic calendar deadlines influence corporate cash conversion cycles independently of underlying macroeconomic conditions.
Subcontractor Flow-Downs: Capital Distribution Beyond the Prime Tier
While headline contract awards highlight prime system integrators, federal acquisition statutes enforce rigorous supply chain dispersion. Under Federal Acquisition Regulation (FAR) Clause 52.219-9, large prime contractors executing awards exceeding $750,000 are legally required to formulate comprehensive subcontracting plans that mandate minimum tier-two and tier-three allocations to small and specialized business enterprises.
Across the $46.1 billion obligated to the top five defense primes in Q3 2026, mandatory flow-down stipulations required an average subcontracting distribution ratio of 34.2%. This structural mechanism redirected an estimated $15.7 billion from top-tier prime balance sheets into a decentralized tier of precision machining shops, specialized printed circuit board fabricators, and niche software vendors.
Tracking these downstream cash disbursements exposes how prime contract momentum disseminates across secondary industrial suppliers, illustrating that prime awards serve as capital conduits rather than terminal funding destinations.
Procurement as an Empirical Economic Indicator
Federal procurement data provides an objective, transactional record of government cash flow that operates independently of market sentiment. Unlike quarterly corporate guidance or promotional sales releases, transaction-level federal obligations represent legally binding commitments of the United States Treasury.
By tracking the progression from statutory budget authorizations to individual task order obligations, quantitative market observers isolate genuine commercial demand curves months before revenue recognition appears on public corporate ledgers. In an industrial landscape increasingly influenced by public policy and sovereign capital outlays, the federal procurement ledger remains the definitive primary source of institutional capital deployment.
Capitol Flow: Cross-referencing federal procurement awards with the most closely tracked congressional portfolio reveals empirical corporate beneficiary overlap across enterprise defense and IT systems.