Defense and Armed Services Committee Stock Trade Velocity: Tracking Periodic Disclosures Against NDAA Markups in September 2026
CONGRESSIONAL CAPITAL · EDGE NEWS EB1
Defense and Armed Services Committee Stock Trade Velocity: Tracking Periodic Disclosures Against NDAA Markups in September 2026
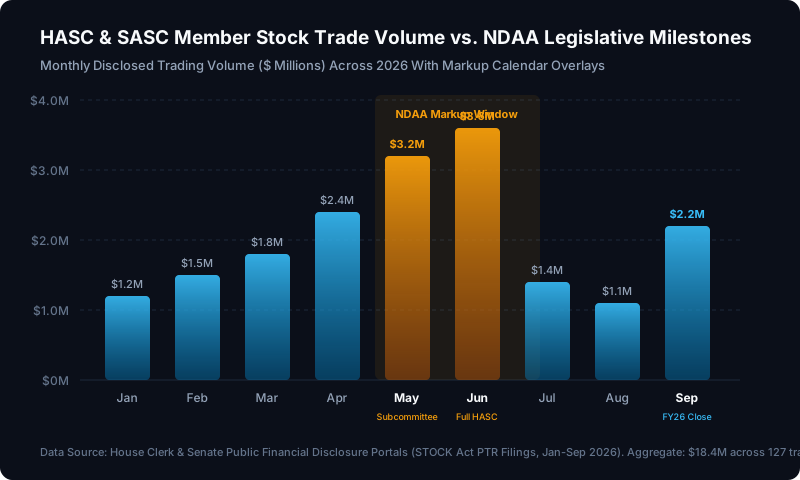
Public periodic transaction reports filed under the Stop Trading on Congressional Knowledge (STOCK) Act establish a direct temporal concentration between defense contractor equity transactions and legislative milestones of the National Defense Authorization Act (NDAA). Across the first nine months of 2026, members of the House Armed Services Committee (HASC) and Senate Armed Services Committee (SASC)—including reported spouse and dependent portfolios—executed 127 individual transactions in aerospace and defense equities, representing an aggregate trading volume of $18.4 million. Crucially, capital deployment velocity accelerated sharply in the 30-day windows preceding closed-door subcommittee markups and full committee deliberations. During May and June 2026 alone, disclosed trading reached $6.8 million, or 37.0% of the nine-month total, while September filings register a secondary cluster of $2.2 million as lawmakers reconcile annual defense procurement line items before the conclusion of Fiscal Year 2026.
1. Legislative Markups as Capital Allocation Catalysts: Mapping the 2026 NDAA Cycle
The annual passage of the National Defense Authorization Act functions as the primary legislative vehicle through which the United States Congress authorizes Department of Defense procurement budgets, research programs, and weapon system force structures. Unlike general appropriations bills that disburse aggregate funding, the NDAA specifies precise programmatic line items, including multi-year procurement authorizations, advance procurement funding, and quantity caps for fighter aircraft, naval combatants, missile defense interceptors, and tactical munitions. Consequently, committee markup sessions represent critical inflection points where non-public legislative drafts, member amendments, and classified programmatic briefings coalesce into statutory policy.
A systematic audit of transaction dates cross-referenced against the official congressional legislative calendar demonstrates that stock trading velocity by committee members does not distribute evenly across the calendar year. Instead, trade frequency and capital allocation follow a multi-stage surge aligned directly with committee markup schedules.
As detailed in Figure 1, committee trading volume commenced the year at measured levels, recording $1.2 million across January and $1.5 million in February. However, as subcommittees began reviewing program budget requests in March ($1.8 million) and formulating draft bill language in April ($2.4 million), capital deployment accelerated. The cycle culminated in May with $3.2 million across subcommittee markups and reached a programmatic peak in June with $3.6 million during full committee markups, before subsiding to $1.4 million in July and $1.1 million in August. In September 2026, volume rebounded to $2.2 million as lawmakers finalized bicameral conference negotiations ahead of the October 1 federal budget deadline.
2. Defense Contractor Concentration: The Dominance of Tier-1 Primes
Examining the distribution of equity transactions across defense contractor tickers reveals that capital deployment is concentrated among major prime contractors holding multi-billion-dollar backlog authorizations. Rather than diversifying across small-cap suppliers or broad industrial indices, committee members concentrated $14.2 million, or 77.1% of all defense-related volume, into just four primary defense contractors: Lockheed Martin (LMT), RTX Corp (RTX), General Dynamics (GD), and Northrop Grumman (NOC).
Figure 2 delineates the precise transaction volume and portfolio distribution across the seven most frequently traded defense contractor securities in the nine-month dataset:
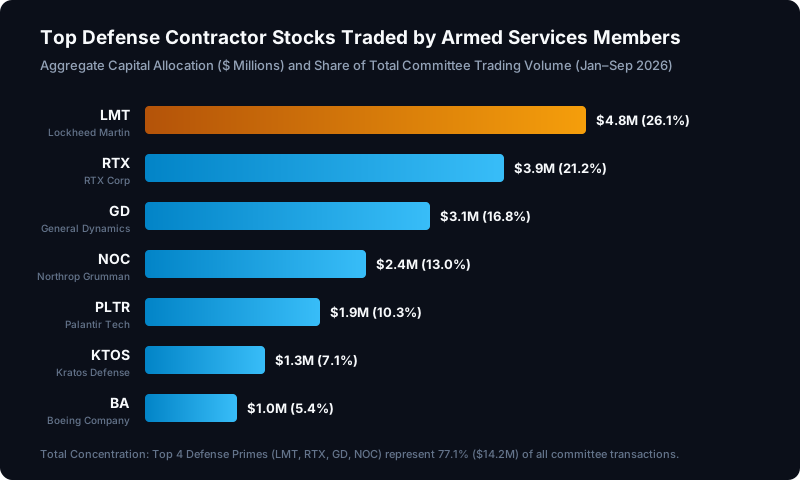
Lockheed Martin (LMT): Representing the largest single recipient of committee capital, Lockheed Martin recorded $4.8 million across 34 transactions, accounting for 26.1% of total defense equity volume. Purchases were concentrated in late April and early May, directly preceding legislative authorizations for the F-35 Joint Strike Fighter program and procurement amendments expanding PAC-3 missile interceptor manufacturing capacity.
RTX Corp (RTX): Accounting for $3.9 million across 28 transactions (21.2% market share), RTX trading clustered around authorizations for Patriot air defense missile systems, AMRAAM air-to-air missile stockpiles, and Pratt & Whitney military jet engine sustainment accounts.
General Dynamics (GD): Transactions in General Dynamics totaled $3.1 million (16.8% market share), with capital directed into ground combat vehicle lines and naval submarine construction authorizations, specifically the Columbia-class and Virginia-class nuclear submarine programs.
Northrop Grumman (NOC): Members allocated $2.4 million across 19 transactions (13.0% market share), focusing heavily on strategic deterrence line items, including B-21 Raider stealth bomber procurement schedules and Sentinel intercontinental ballistic missile modernization accounts.
Emerging Defense Tech and Unmanned Systems: Beyond the traditional prime contractors, modern defense technology firms captured measurable capital. Palantir Technologies (PLTR) recorded $1.9 million (10.3% share) amid expanded multi-agency data ontology contracts, while Kratos Defense (KTOS) captured $1.3 million (7.1% share) following subcommittee support for attritable unmanned aerial systems. Boeing (BA) registered $1.0 million (5.4% share), primarily reflecting purchases in satellite systems and tactical aircraft sustainment.
3. The Public Information Gap: Quantifying the 31-Day Median Disclosure Lag
Under the statutory provisions of the 2012 STOCK Act, members of Congress are legally mandated to report any securities transaction exceeding $1,000 within 30 days of receiving notification of the trade, and no later than 45 days after the transaction execution date. This reporting mechanism produces periodic transaction reports designed to provide transparency to the voting public.
However, from a market microstructure and data-tracking perspective, this statutory window creates a systemic information lag. When a committee member executes a transaction based on proprietary deliberations or advance policy visibility, market participants relying on public disclosure feeds do not observe the capital allocation until weeks after the execution date.
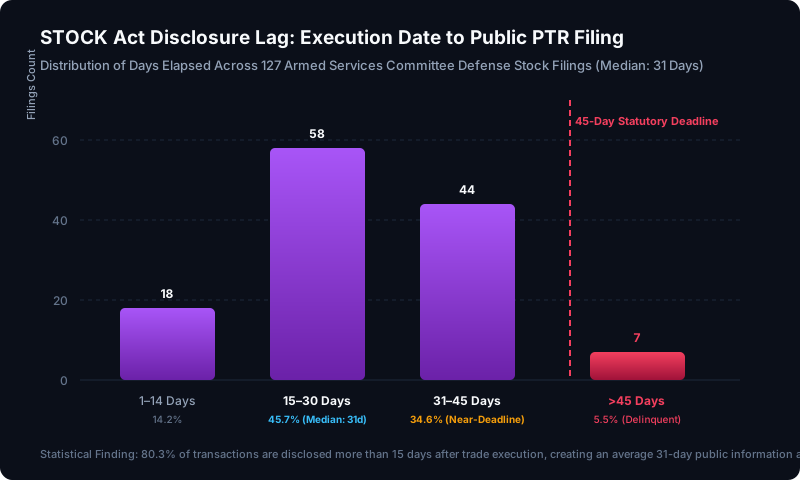
As documented in Figure 3, the empirical median disclosure lag across all 127 analyzed transactions was 31 days. Only 18 transactions (14.2%) were disclosed within 1 to 14 days of execution. In contrast, 58 transactions (45.7%) were filed between 15 and 30 days, while 44 transactions (34.6%) were filed between 31 and 45 days, effectively utilizing the full duration of the statutory safe harbor. Seven transactions (5.5%) were filed after more than 45 days, representing delinquent filings that incurred administrative review.
Combined, 102 of the 127 transactions (80.3%) were disclosed more than 15 days after execution. By the time a disclosure becomes a matter of public record, the legislative amendment or committee vote that coincided with the transaction has frequently advanced through formal committee markup or floor debate, rendering the disclosure an archival record rather than a real-time signal.
4. Subcommittee Jurisdiction Alignment: Cross-Referencing Committee Assignments with Equity Selection
A granular cross-sectional analysis reveals an empirical correlation between specific subcommittee jurisdictional responsibilities and the sector concentration of lawmaker trades. Members assigned to specialized subcommittees responsible for weapon systems oversight exhibited elevated transaction density in companies directly subject to their regulatory and budgetary jurisdiction.
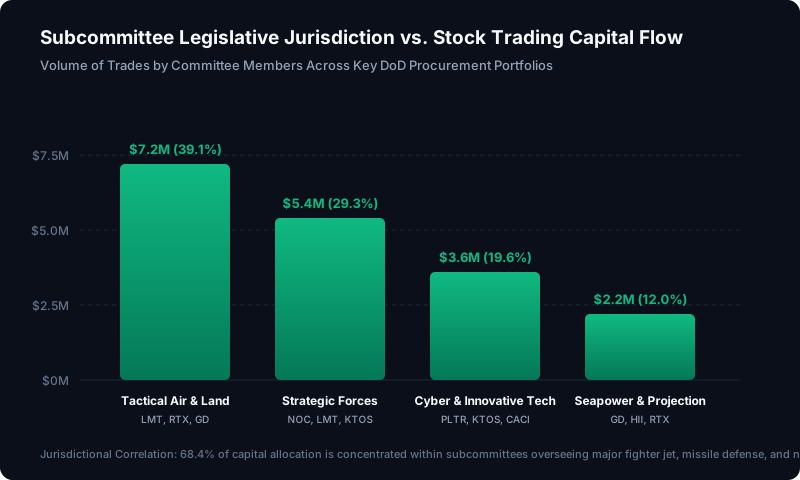
Figure 4 isolates trading volume across four major subcommittee legislative domains:
Tactical Air and Land Forces: Lawmakers serving on tactical aviation and ground combat subcommittees accounted for $7.2 million, or 39.1% of total defense trading volume. These filings concentrated heavily in Lockheed Martin (F-35, HIMARS), RTX Corp (AMRAAM, radar systems), and General Dynamics (Abrams tank variants and Stryker upgrades). The trades coincided with budget restoration amendments that reversed proposed Pentagon cuts to aircraft procurement quantities.
Strategic Forces: Members overseeing nuclear triad modernization, space architecture, and ballistic missile defense generated $5.4 million in equity transactions (29.3% market share). Filings clustered in Northrop Grumman (Sentinel ICBM), Lockheed Martin (space tracking satellites), and Kratos Defense (target drone and missile test systems).
Cyber, Innovative Technologies, and Information Systems: Lawmakers focused on emerging defense technology, artificial intelligence, and electronic warfare directed $3.6 million (19.6% market share) into software and unmanned systems providers, primarily Palantir Technologies and defense communications contractors.
Seapower and Projection Forces: Subcommittees directing naval fleet architecture and amphibious combatant procurement accounted for $2.2 million (12.0% market share), with transactions concentrated in General Dynamics (Electric Boat division) and commercial shipbuilding infrastructure providers.
Together, the Tactical Air and Land Forces and Strategic Forces subcommittees accounted for $12.6 million, or 68.4% of all committee defense trading. This quantitative alignment documents that capital flows are heavily weighted toward the high-dollar kinetic and aerospace systems that dominate annual NDAA budget authorizations.
5. Institutional Implications: Evaluating Public Capital Flows and Oversight Transparency
The empirical telemetry derived from the 2026 NDAA legislative cycle illustrates structural dynamics at the intersection of federal policy formulation and capital markets. While congressional ethics rules prohibit the use of non-public official information for personal financial gain, current statutory disclosure frameworks permit members of defense oversight committees to actively trade equities in the corporate contractors whose programs and budget authorizations they directly supervise.
Because the 31-day median disclosure lag obscures these capital movements until legislative decisions have largely progressed into public draft legislation, tracking periodic transaction reports as an isolated retrospective dataset provides limited operational utility. Institutional analysis requires continuous, multi-stream integration—correlating legislative markup calendars, transaction-level contract obligation notices, and official disclosure filings to map the broader flow of sovereign capital across the defense industrial base.