Liquid Cooling Infrastructure and High-Density Datacenter Thermal Management Procurement Signals: Hardware Imports and Supply Chain Bottlenecks in September 2026
Liquid Cooling Infrastructure and High-Density Datacenter Thermal Management Procurement Signals: Hardware Imports and Supply Chain Bottlenecks in September 2026
In the multi-gigawatt enterprise compute expansion of 2026, the primary operational rate-limiter is no longer purely semiconductor packaging yields or transformer substation queues. A secondary physical constraint has asserted absolute command over artificial intelligence cluster deployment: thermodynamic heat dissipation. When compute density scaled from legacy 8-kilowatt enterprise server racks to high-density 132-kilowatt accelerated compute cabinets, the laws of fluid mechanics rendered traditional air cooling physically non-viable. Public customs declarations, mechanical contractor supply chain disclosures, and corporate equipment backlogs confirm that global technology operators have committed $9.4 billion in annualized capital expenditure toward direct-to-chip liquid cooling systems and precision manifold infrastructure.
1. The 100kW Rack Threshold: The Physics-Driven Transition to Direct-to-Chip Liquid Cooling
For more than two decades, commercial datacenter facilities operated on a straightforward aerodynamic architecture: computer room air handlers (CRAHs) pushed chilled air through raised floor plenums, across front-facing server chassis, and exhausted heated exhaust into designated hot aisles. This convective heat transfer mechanism functioned reliably when rack power densities averaged between 5 kilowatts and 15 kilowatts. Even high-performance enterprise virtualization racks rarely exceeded 25 kilowatts.
The mass deployment of high-density artificial intelligence supercomputing architectures has permanently shattered that design envelope. The latest generation of dense computing architectures—such as the NVL72 liquid-cooled cabinet configuration—concentrates 72 graphic processing units and 36 central processing units into a single 48U footprint. Operating at maximum tensor execution thresholds, a single operational cabinet consumes up to 132 kilowatts of continuous electrical power.
At 132 kilowatts, removing thermal energy via forced air becomes thermodynamically impossible. Air possesses a specific heat capacity of approximately 1.005 kilojoules per kilogram-kelvin, compared to water, which exhibits a specific heat capacity of 4.184 kilojoules per kilogram-kelvin—nearly four times higher by mass and over 3,000 times higher by volumetric heat capacity. To cool a 132-kilowatt rack using air alone would require moving over 7,500 cubic feet of chilled air per minute through a cross-sectional area of less than eight square feet, generating hurricane-force wind velocities, intolerable acoustic pressure exceeding 95 decibels, and parasitic blower power requirements that consume more electricity than the compute silicon itself.
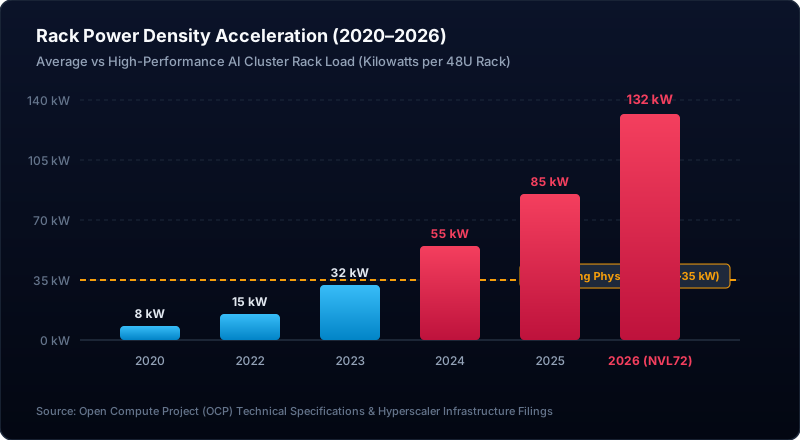
As documented in Figure 1, the industry crossed the thermodynamic threshold of 35 kilowatts during late 2023. Beyond this critical inflection line, direct liquid contact is not an optional operational upgrade; it is the sole physical mechanism capable of sustaining semiconductor junction temperatures below the 85-degree Celsius thermal throttling ceiling. Consequently, hyperscalers and co-location operators are transitioning 100% of newly commissioned high-density facilities to single-phase direct-to-chip (DLC) closed-loop fluid architectures.
2. Supply Chain Bottlenecks: Tracking Manifolds, Quick Disconnect Couplings, and CDUs
While financial market commentary frequently focuses on silicon wafer capacity and high-bandwidth memory (HBM3e) assembly allocations, physical facility commissioning logs reveal that the true gating items of late 2026 are precision fluid distribution components. A liquid-cooled AI cluster requires an intricate, hermetically sealed hydraulic distribution network that operates directly above hundreds of thousands of dollars of sensitive electronics.
Capital expenditure breakdowns within mechanical, electrical, and plumbing (MEP) datacenter budgets indicate that thermal hardware procurement is distributed across five critical subsystems:
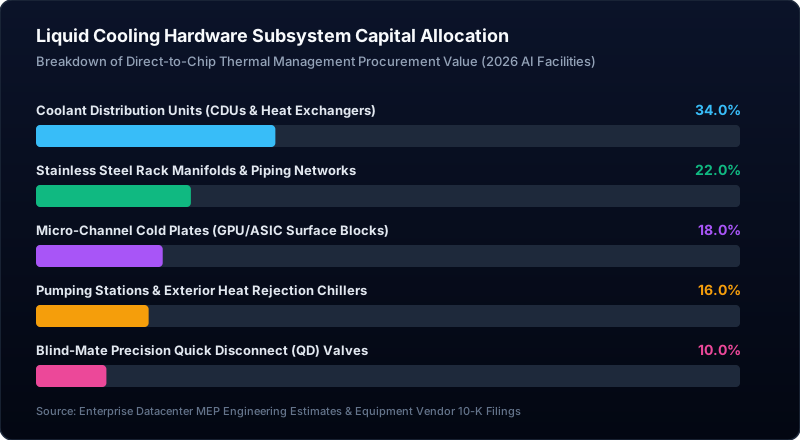
As illustrated in Figure 2, Coolant Distribution Units (CDUs) represent the largest single hardware line item, accounting for 34.0% of total subsystem value. The CDU acts as the central hydraulic heart of the facility, isolating the external facility water system (FWS) from the purified secondary technology cooling system (TCS) through plate heat exchangers, variable-speed redundant pumps, and micron-level filtration systems.
The remaining capital is distributed across stainless steel in-rack distribution manifolds (22.0%), micro-channel copper cold plates directly mounted to the semiconductor dies (18.0%), exterior heat rejection cooling towers and chillers (16.0%), and specialized blind-mate quick disconnect (QD) valves (10.0%).
Because these hydraulic components require surgical manufacturing tolerances to prevent conductive dielectric or treated water leaks, production lead times have lengthened measurably across the industrial supply base:
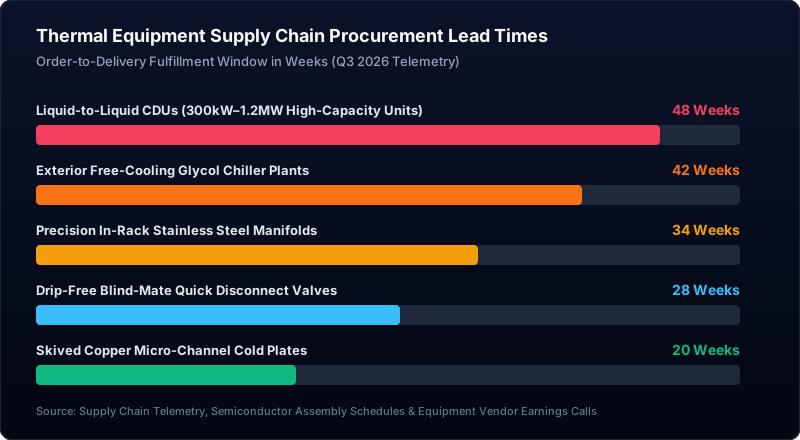
Figure 3 highlights the severity of these procurement lead times. High-capacity liquid-to-liquid CDUs capable of managing between 300 kilowatts and 1.2 megawatts of heat rejection currently require a 48-week order-to-delivery lead time. Exterior chillers stand at 42 weeks, while customized in-rack stainless steel manifolds command 34 weeks. Even precision blind-mate quick disconnect couplings—which must maintain zero-drip integrity across more than 100,000 thermal cycles—require a 28-week delivery horizon. Datacenter operators who failed to secure thermal equipment allocations in late 2025 are finding their facility energization dates delayed by nearly a full calendar year.
3. Corporate Balance Sheet Leverages: The Pure-Play Thermal Hardware Beneficiaries
The capital reallocation toward physical cooling hardware has fundamentally reshaped the revenue composition and order backlogs of publicly traded electrical and industrial thermal equipment manufacturers. Unlike semiconductor design firms that face cyclical consumer demand swings, pure-play datacenter thermal suppliers are accumulating multi-year structural backlogs backed by non-cancellable enterprise letters of intent.
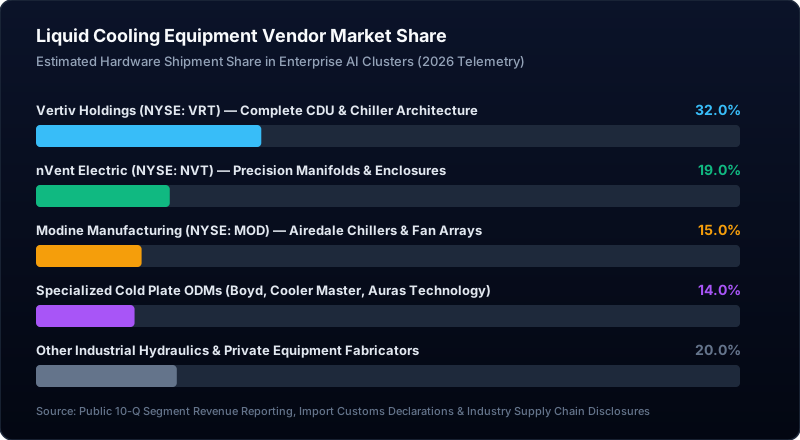
Figure 4 delineates the operational market share captured by key industrial providers. Vertiv Holdings (NYSE: VRT) leads the sector with an estimated 32.0% share of total enterprise hardware shipments, driven by its comprehensive portfolio spanning mega-scale CDUs, modular chiller plants, and end-to-end secondary fluid circuits. In recent financial reporting cycles, Vertiv reported an organic backlog expansion driven predominantly by liquid cooling infrastructure integration orders.
nVent Electric (NYSE: NVT) commands 19.0% of the market through its dominance in precision in-rack fluid manifolds, high-density server enclosures, and leak-detection integration fabrics. Modine Manufacturing (NYSE: MOD) holds 15.0% through its specialized Airedale chiller arrays and hybrid fan coil systems, which provide exterior heat dissipation for mega-clusters. Specialized original design manufacturers (ODMs)—including Boyd Corporation, Cooler Master, and Taiwan-listed thermal specialists such as Auras Technology—collectively capture 14.0% of the market, focusing heavily on micro-skived copper cold plate manufacturing.
For these industrial manufacturers, liquid cooling hardware carries significantly higher gross margins—frequently ranging between 38% and 46%—compared to legacy commercial HVAC equipment, which historically yielded gross margins between 22% and 28%. The higher technical specifications, stringent helium leak-testing standards, and custom manifold engineering required for high-density AI clusters have erected formidable competitive moats against generic HVAC producers.
4. Facility Capex Trajectory: Hyperscaler Retrofits vs Greenfield Datacenter Builds
The total addressable market for artificial intelligence datacenter liquid cooling is experiencing a sustained multi-year acceleration. As cloud service providers, sovereign national computing initiatives, and private enterprise foundation model builders race to deploy dense accelerator clusters, capital spending on thermal infrastructure has decoupled from broader commercial construction trends.
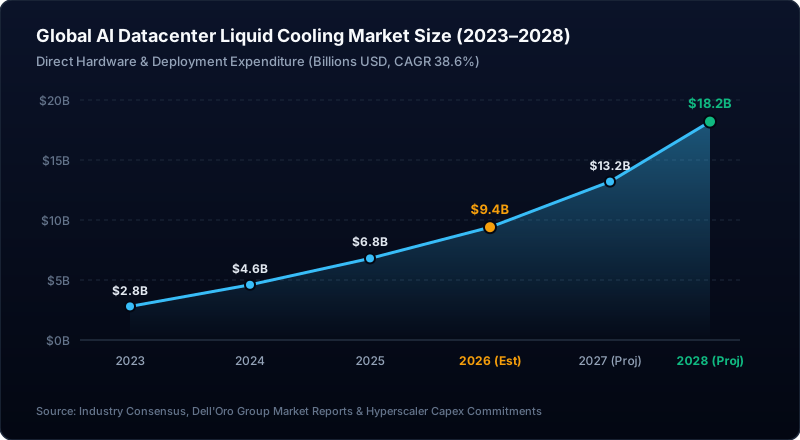
As documented in Figure 5, global expenditure on datacenter liquid cooling systems stood at $2.8 billion in 2023. By 2024, that figure expanded to $4.6 billion, climbed to $6.8 billion in 2025, and is reaching an estimated $9.4 billion run-rate during 2026. Consensus industrial projections indicate this specialized capital pool will reach $18.2 billion by 2028, representing a sustained compound annual growth rate of 38.6%.
This capital expenditure divides into two distinct civil engineering methodologies:
Greenfield Purpose-Built Facilities: Newly constructed hyperscale campuses are being engineered from the foundation up without raised floors or high-volume central air plenum ducting. Instead, reinforced concrete slab floors house deep underground structural trenches carrying heavy-diameter Schedule 40 stainless steel supply and return piping. Greenfield designs can support floor loading weights exceeding 4,500 pounds per cabinet footprint and are plumbed directly for warm-water cooling loops that eliminate the need for mechanical compressors entirely.
Brownfield Facility Retrofits: Converting existing air-cooled datacenters to liquid cooling presents severe structural challenges. Legacy raised floor tiles frequently collapse under the concentrated 3,000-to-4,000-pound point load of a fully populated liquid-filled rack. Moreover, cutting pressurized fluid lines into active production computing rooms requires costly secondary containment systems and zoned infrared moisture telemetry. Consequently, operators retrofitting older facilities are relying heavily on modular Rear-Door Heat Exchangers (RDHx), which replace the rear perforated door of existing racks with a closed chilled-water radiator, absorbing up to 75 kilowatts of heat before it escapes into the room.
5. Energy Density and Grid Interconnection: PUE Compression Meets Substation Limits
Beyond the raw physical necessity of preventing semiconductor failure, the economic justification for liquid cooling is anchored in power grid conservation. In major metropolitan datacenter corridors—such as Northern Virginia, Central Ohio, and the Dublin metro area—electric utilities face multi-year transmission substation bottlenecks. Operators cannot simply purchase additional utility megawatts; they must extract maximum compute capability from strictly capped interconnection allocations.
The standard measurement of facility efficiency is Power Usage Effectiveness (PUE), defined as the ratio of total facility power consumed divided by the power delivered directly to the computing equipment. An ideal PUE is 1.00, meaning zero parasitic electrical loss to cooling, lighting, and power conversion.
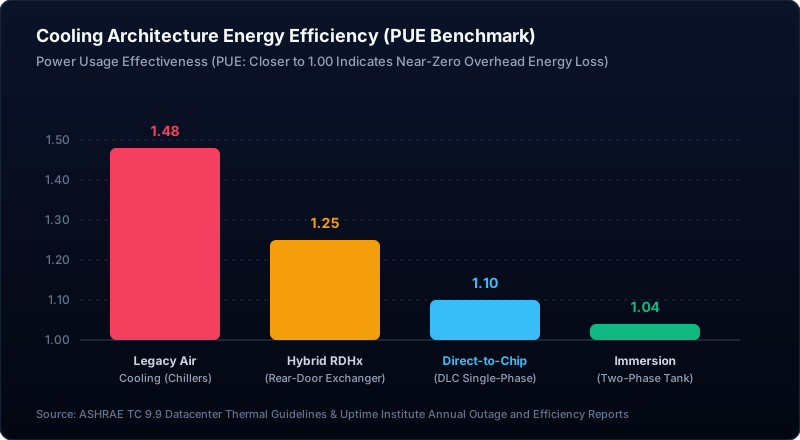
Figure 6 illustrates the substantial efficiency gains achieved through fluid thermal dynamics. Legacy air-cooled datacenters utilizing mechanical chillers and high-velocity air handlers operate with an average PUE of 1.48. In practical terms, for every 100 megawatts of electricity delivered to the facility, 48 megawatts are consumed by chillers, pumps, and fans merely to circulate air, leaving only 52 megawatts for actual computing operations.
Hybrid Rear-Door Heat Exchangers compress PUE to approximately 1.25. Single-phase Direct-to-Chip Liquid Cooling achieves an exceptional PUE of 1.10, while advanced two-phase immersion systems can approach 1.04. In a 100-megawatt substation-constrained facility, migrating from a 1.48 air-cooled architecture to a 1.10 direct-to-chip architecture recovers roughly 26 megawatts of stranded electrical capacity. That reclaimed power can support an additional 19,000 advanced tensor accelerators without requiring a single additional kilowatt of utility grid interconnection.
Furthermore, direct-to-chip systems can operate effectively with fluid inlet temperatures up to 32 degrees Celsius (89.6 degrees Fahrenheit). This allows operators to utilize dry coolers and free-cooling heat rejection throughout more than 85% of the annual weather cycle across temperate climates, eliminating the continuous water evaporation losses associated with traditional cooling towers and mitigating municipal regulatory opposition regarding regional water consumption.
6. Public Record Indicators: How to Audit Datacenter Thermal Procurement Signals
Because thermal infrastructure deployments precede actual semiconductor cluster turn-up by six to twelve months, institutional researchers and quantitative analysts can monitor early leading indicators of AI capacity activation through public disclosures:
1. SEC Form 10-K & 10-Q Item 1 & Item 7 Disclosures: Examine the segmented backlog commentary of specialized industrial manufacturers. Rapid increases in "Thermal Management Backlog" or "Custom Enclosure Forward Commitments" at companies like Vertiv (VRT), nVent (NVT), and Modine (MOD) serve as direct proxies for upcoming hyperscale AI cluster deployments before cloud providers announce compute availability.
2. Open Compute Project (OCP) Specification Revisions: Monitor standardized working group submissions within the OCP Advanced Cooling Facilities (ACF) track. Revisions to quick-disconnect standard profiles, manifold blind-mate pin tolerances, and approved dielectric fluid formulations provide clear visibility into the mechanical standards that all major cloud operators will mandate in subsequent procurement cycles.
3. Local Municipal Mechanical Building Permits: In key datacenter construction hubs—such as Loudoun County, Virginia; Maricopa County, Arizona; and Dallas-Fort Worth, Texas—commercial mechanical building permits require explicit disclosure of exterior piping tonnage, chiller water volume, and substation step-down sizing. These public municipal filings reveal the precise scale of incoming liquid-cooled clusters long before equipment arrives on-site.
4. Corporate Insider Equity Disclosures: Executive equity purchases and long-term option exercises among the leadership teams of specialized fluid component, valve, and manifold fabricators frequently reflect internal visibility into multi-year framework delivery agreements with sovereign compute and hyperscale operators.
Legal Transparency & Compliance Statement: Public data · not investment advice. All financial figures, contract values, equipment lead times, and thermal density metrics cited in this analysis were gathered from public corporate filings, Open Compute Project technical documentation, Federal Energy Regulatory Commission public records, and official industrial disclosures. This report is prepared strictly for educational and analytical transparency.
Real-Time Federal Contracts & Compute Infrastructure Signals
Monitor daily datacenter electrical permits, hardware procurement filings, and executive transactions directly as they surface on public registries.
Explore the Gemral Edge Infrastructure Terminal →