NVDA Earnings Date: Schedule & Expected Move
NVDA Earnings Date: Schedule, Expected Move, and Historical Volatility
Market participants across equities, derivatives, and macro funds intensely track the official nvda earnings date, as quarterly financial results from the dominant AI infrastructure provider serve as a primary catalyst for global tech valuations. To monitor catalyst velocity and options positioning ahead of major reporting windows, institutional traders rely on the high-momentum catalyst stocks radar to track public disclosures against derivatives pricing models.
As the bellwether of enterprise computing and accelerated hardware architectures, Nvidia Corporation (NASDAQ: NVDA) commands substantial market weight across the S&P 500 and Nasdaq 100 indices. When the nvda earnings date approaches, implied volatility (IV) across short-dated options contracts experiences rapid expansion, pricing in binary upside or downside price adjustments. Understanding how the earnings calendar is established, how market makers derive implied expected moves, and how historical price gaps compare to post-earnings reality is essential for managing risk around these high-momentum event windows.
1. The Nvidia Earnings Calendar: Timing and Release Mechanics
Unlike companies with traditional calendar fiscal years ending in December, Nvidia operates on a fiscal year that concludes on the final Sunday of January. Consequently, its quarterly reporting schedule follows an offset calendar cycle:
| Fiscal Period | Reporting Quarter | Typical Earnings Release Window | Primary Revenue Focus |
|---|---|---|---|
| Q1 Fiscal Year | February to April | Late May (After-Market Close) | Hyperscaler Capex Deployments |
| Q2 Fiscal Year | May to July | Late August (After-Market Close) | Enterprise Architecture Transitions |
| Q3 Fiscal Year | August to October | Mid to Late November (After-Market Close) | Global Sovereign AI Commitments |
| Q4 / Full Year | November to January | Late February (After-Market Close) | Annual Datacenter Guidance |
The company officially discloses its quarterly financial release via SEC Form 8-K filings and investor relations press releases approximately three to four weeks before the scheduled date. Financial reports are released immediately following the close of regular US market trading at 4:00 PM Eastern Time, followed by an executive management conference call and webcast at 5:00 PM Eastern Time. Quantitative trading desks closely monitor the precise publication timestamp on the SEC EDGAR system, as algorithmic parsers extract headline revenue, adjusted gross margins, and forward-looking datacenter guidance within milliseconds of transmission to execute cross-asset index and single-stock rebalancing orders.
2. Deriving the Options-Implied Expected Move
Options market makers do not guess how much a stock will move on its nvda earnings date; they price expected volatility directly into the premium of at-the-money (ATM) straddles expiring immediately after the event.
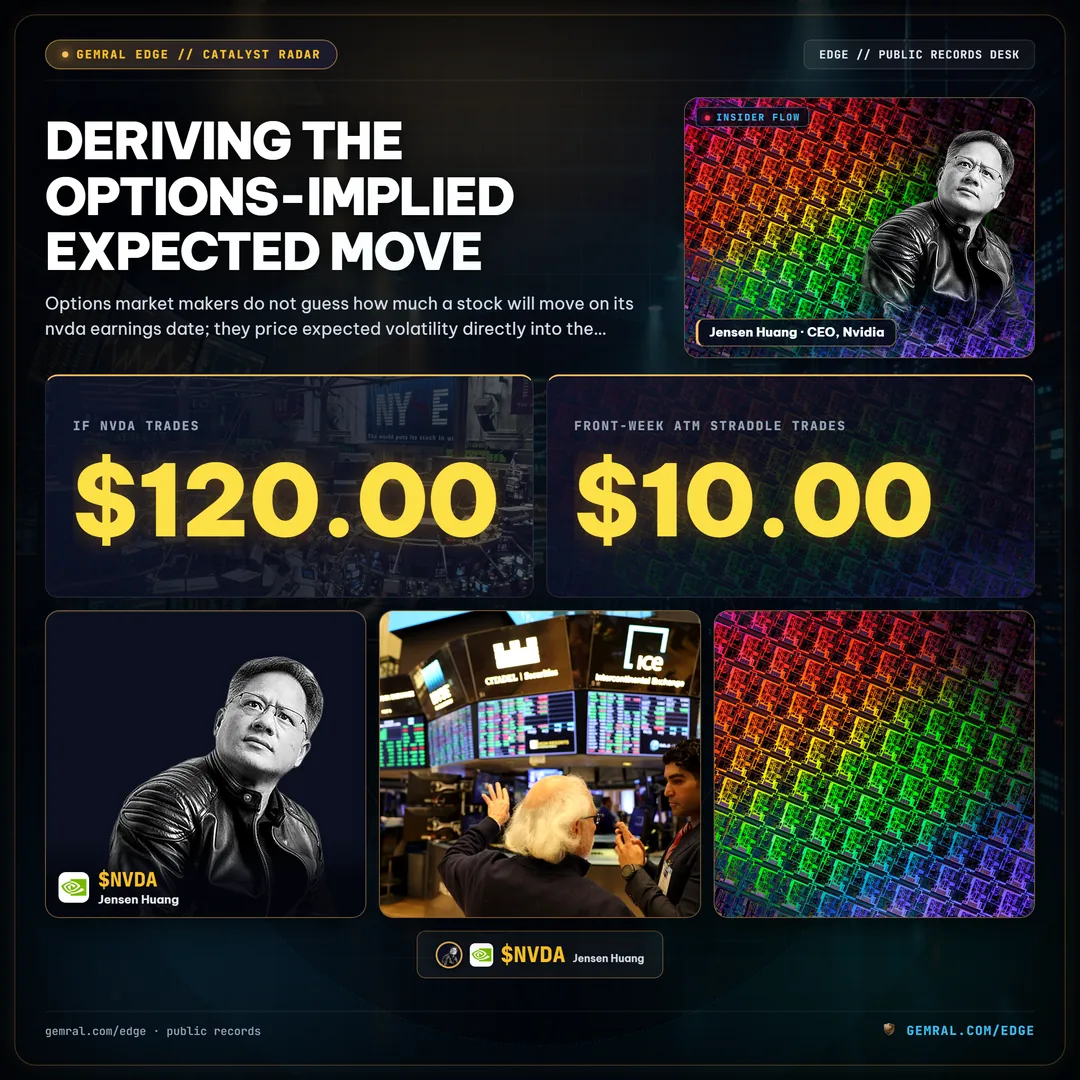
Traders calculate the implied expected move using the standard market-maker formula: multiplying the combined price of the ATM call and ATM put options by approximately 0.85 (or calculating the ATM straddle price divided by the stock's pre-earnings price). For example, if NVDA trades at $120.00 immediately prior to the earnings release and the front-week ATM straddle trades at $10.00, the options market prices an expected move of approximately ±8.3% ($10.00 / $120.00). If the post-earnings price move exceeds this range, straddle buyers profit; if the actual gap is narrower, implied volatility collapses and premium sellers capture the decay.
Beyond the raw expected move calculation, options flow reveals institutional skew. When the demand for upside out-of-the-money (OTM) calls significantly exceeds that for downside protection puts, the volatility smile exhibits positive skew, signaling aggressive call buying from retail and institutional accounts. Conversely, heavy put-buying skew reflects defensive portfolio hedging against supply chain bottlenecks or hyperscaler capital expenditure moderation across global markets.
3. Historical Earnings Volatility: Expectations vs Reality
Examining historical price reactions reveals how frequently Nvidia has beaten or missed options-market expectations. Over the past twelve quarters, the company's actual post-earnings price reactions have demonstrated distinct asymmetric dynamics:

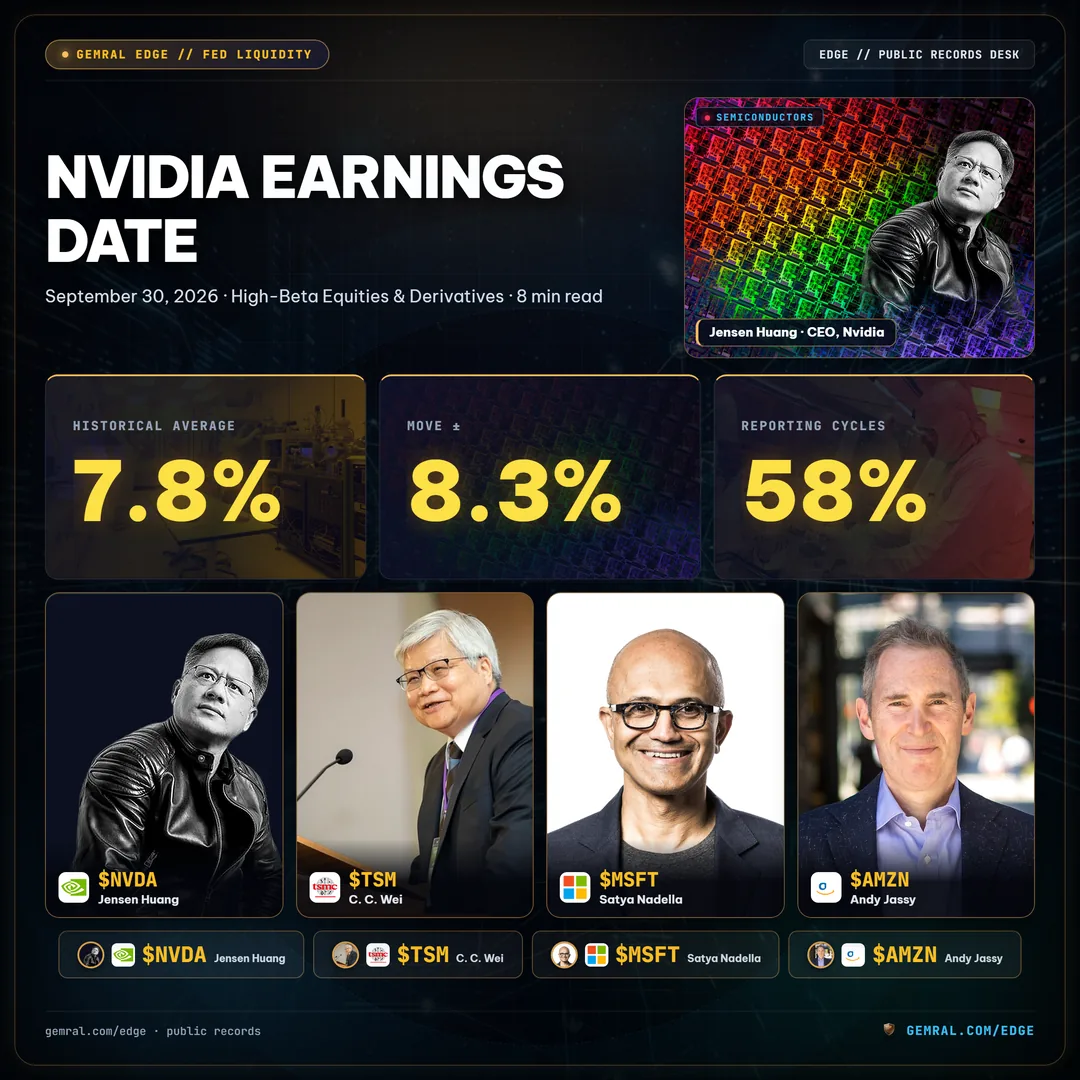
- Actual Move vs Implied Move: Historically, Nvidia's actual absolute one-day post-earnings price reaction has exceeded the market-implied move in approximately 58% of reporting cycles, reflecting persistent institutional underestimation of datacenter revenue growth during enterprise AI hardware buildouts.
- Post-Earnings Volatility Crush: Front-week implied volatility typically plunges from over 85% immediately prior to the announcement to under 40% on the morning following the release. This rapid compression makes outright call or put purchases vulnerable to theta decay even if the directional trend is correct.
- Multi-Day Momentum Continuation: When Nvidia beats revenue guidance by more than 10%, the initial earnings gap has historically exhibited strong multi-day price continuation, as institutional funds execute multi-day re-weighting programs to increase allocation benchmarks.
Furthermore, quantitative research on Post-Earnings Announcement Drift (PEAD) highlights that high-momentum technology stocks like Nvidia do not absorb earnings surprises in a single trading session. Instead, large-cap asset managers frequently take 3 to 10 trading days to accumulate or distribute millions of shares without creating excessive market impact. Consequently, observing volume-weighted average price (VWAP) stability on Day 2 and Day 3 post-earnings provides far higher statistical edge than guessing the initial overnight reaction.
4. Risk Management Rules for Catalyst Windows
Navigating the high-stakes environment surrounding the nvda earnings date requires structured quantitative discipline rather than speculative gambles. Professional market participants apply three core risk management principles:

First, avoid unhedged directional options purchases in the final 48 hours before reporting, when short-dated implied volatility frequently exceeds 85%. Elevated implied volatility inflates option premiums, requiring outsized stock movements simply to break even.
Second, audit supplier and customer earnings releases across 4 major cloud hyperscalers that report prior to Nvidia. Quarterly disclosures from major contract semiconductor foundries (such as TSMC), memory suppliers (SK Hynix, Micron), and hyperscaler cloud operators (Microsoft, Google, Amazon) provide transaction-level telemetry on server rack deployments weeks before Nvidia reports.
Third, monitor congressional and corporate insider disclosures leading into the quiet period. Public filings submitted within 45 days under the STOCK Act reveal whether lawmakers on technology and intelligence committees adjusted high-beta semiconductor holdings ahead of key regulatory and catalyst deadlines.
Regulatory & Investment Disclaimer: Public data · not investment advice. All financial calendar dates, options calculations, and historical volatility statistics are derived from public market data and SEC regulatory filings. Options trading involves substantial risk and is not suitable for all investors.