Bitcoin Liquidation Price Calculator: Leverage Ratios and Margin Buffers

Bitcoin Liquidation Price Calculator: Leverage Ratios and Margin Buffers
Prior to entering any leveraged position in digital asset perpetual markets, calculating your precise bitcoin liquidation price is an essential mathematical prerequisite to protect trading capital. To track macro liquidation clusters and evaluate market-wide collateral vulnerability across major exchanges, derivatives analysts rely on the crypto liquidation heatmap radar, auditing order flow and margin depth in real time.
In cryptocurrency futures trading, the liquidation price represents the exact market valuation at which an open position equity is completely exhausted by maintenance margin requirements, triggering automatic forced closure by the exchange matching engine. Too many retail participants rely on approximate mental arithmetic or generic exchange sliders without understanding how maintenance margin tiers, continuous funding debits, and exchange insurance fees alter the true bankruptcy threshold. This quantitative guide breaks down the exact mathematical derivation of the bitcoin liquidation price across standard leverage multipliers.
1. The Mathematical Formula for Liquidation Price
The exact formula utilized by tier-1 cryptocurrency exchange matching engines to determine your bitcoin liquidation price depends on trade direction (long vs short) and the maintenance margin rate ($MMR$):
For an isolated Long position:
P_liq_long = P_entry × [1 - (1 / Leverage) + MMR]
For an isolated Short position:
P_liq_short = P_entry × [1 + (1 / Leverage) - MMR]
Where $P_{entry}$ represents execution price, $ ext{Leverage}$ is the chosen leverage factor (e.g., 10 for 10x leverage), and $ ext{MMR}$ is the exchange maintenance margin rate (typically 0.40% to 0.50% for standard Bitcoin contract tiers under $250,000). For a $10,000 long trade at $65,000 using 10x leverage, the liquidation price is exactly $58,825.00, representing an adverse decline of just 9.50%.
Furthermore, quantitative analysis of market liquidity reveals why high leverage ratios present structural challenges beyond simple volatility. When trading at 20x or 50x leverage, the margin requirement is so narrow that standard bid-ask spread expansion during high-volatility news releases can trigger liquidation before a directional breakout even completes. Cryptocurrency derivatives exchanges utilize automated clearing houses that do not wait for human intervention; as soon as the calculated Mark Price touches the maintenance threshold, your position is liquidated regardless of whether price immediately reverses in your favor.
2. Liquidation Price Comparison Table Across Leverage Multipliers
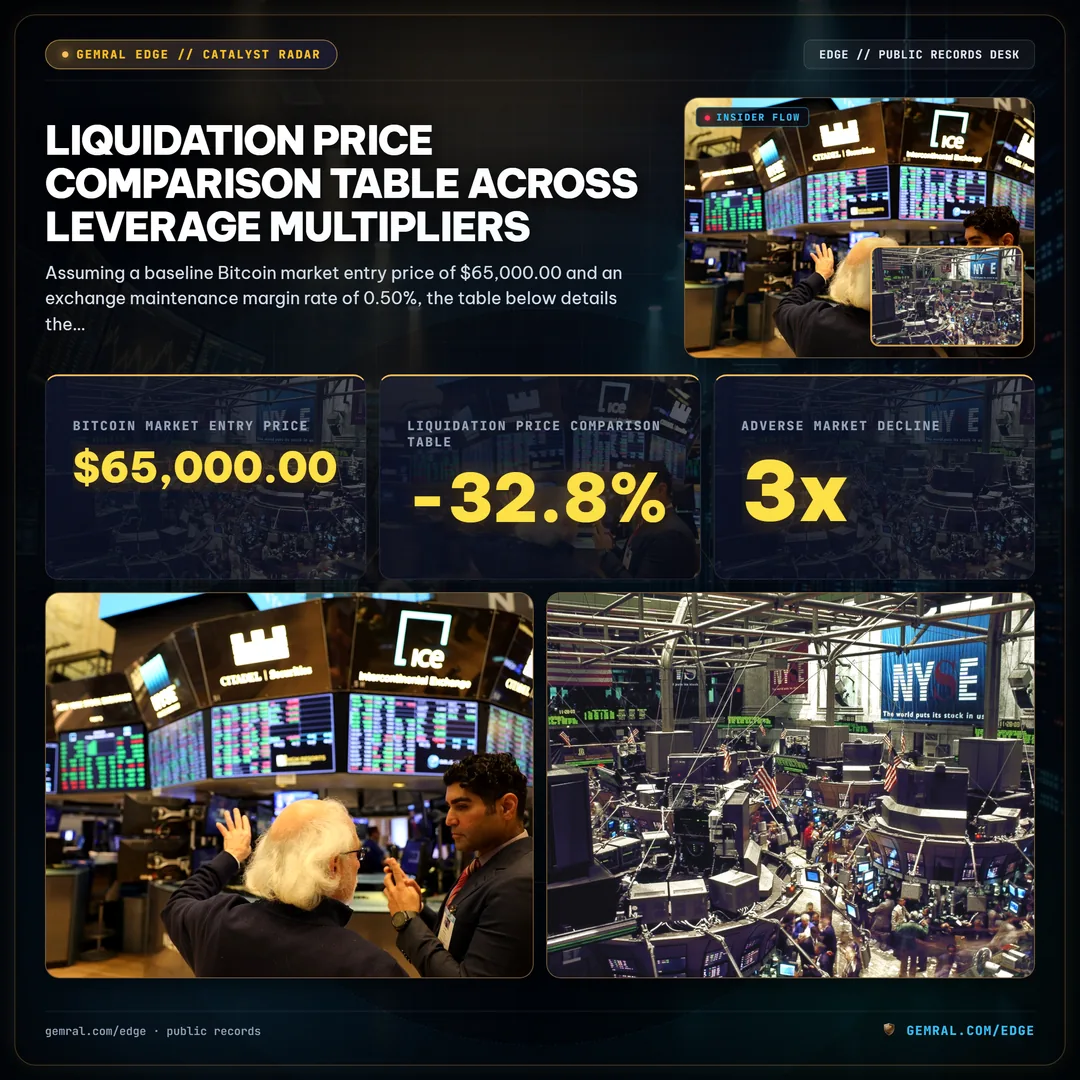
Assuming a baseline Bitcoin market entry price of $65,000.00 and an exchange maintenance margin rate of 0.50%, the table below details the exact liquidation thresholds and required price movements across common leverage tiers:
| Leverage Ratio | Long Liquidation Price ($) | Adverse Drop to Long Liq (%) | Short Liquidation Price ($) | Adverse Rise to Short Liq (%) |
|---|---|---|---|---|
| 3x | $43,658.33 | -32.83% | $86,341.67 | +32.83% |
| 5x | $52,325.00 | -19.50% | $77,675.00 | +19.50% |
| 10x | $58,825.00 | -9.50% | $71,175.00 | +9.50% |
| 20x | $62,075.00 | -4.50% | $67,925.00 | +4.50% |
| 50x | $64,025.00 | -1.50% | $65,975.00 | +1.50% |
| 100x | $64,675.00 | -0.50% | $65,325.00 | +0.50% |
The mathematical reality is stark: leverage exceeding 10x is mathematically hostile for swing traders. At 50x leverage, an everyday intraday price wick of just 1.50% results in complete position loss, even if the primary macro thesis proves correct over subsequent days.
In addition to tiered schedules, market participants must continuously track funding rate velocity. In bull markets with extreme speculative greed, annual funding costs can exceed 50% to 100% APR. Holding a high-leverage long position for several weeks in an overheated market bleeds capital continuously through 8-hour funding debits. Each funding deduction effectively raises your liquidation price, meaning that a position that originally possessed a comfortable 15% safety buffer may see that buffer shrink to less than 5% over a single monthly holding period.
3. Dynamic Variables That Shift Your Liquidation Threshold
Your calculated bitcoin liquidation price is not static; several dynamic factors actively shift your liquidation threshold closer to prevailing market prices over time:

Traders must audit the dynamic mechanics that erode margin buffers:
1. Cumulative Funding Fee Debits: When maintaining an open perpetual position against extreme funding rates, the exchange debits funding payments every 8 hours. Continuous funding fee deductions steadily deplete position equity, migrating your liquidation price closer to spot price.
2. Maintenance Margin Tier Escalation: Derivatives platforms operate tiered margin schedules. If a trader scales position size past certain thresholds (e.g., exceeding $250,000 or $1,000,000 in notional exposure), the required maintenance margin rate jumps from 0.50% to 1.00% or 1.50%, instantly shifting the liquidation price.
3. Cross Margin Portfolio Drag: Under cross margin configurations, unrealized drawdowns across secondary altcoin positions directly drain the unified collateral pool, prematurely pushing your Bitcoin position toward its liquidation price.
A resilient risk-management framework also incorporates volatility-adjusted position sizing based on the Average True Range (ATR). Rather than risking a fixed dollar amount across disparate market regimes, professional traders reduce leverage multipliers when 14-day Bitcoin ATR expands, ensuring that normal daily volatility swings cannot reach the liquidation barrier. By combining dynamic ATR-based position sizing, hard stop-losses, and conservative leverage caps, quantitative traders build an institutional shield that permanently removes forced liquidation from their risk profiles.
4. Volatility Buffer Engineering: Structuring Resilient Margin
Institutional quantitative traders structure a minimum 25% volatility buffer between their entry price and their calculated bitcoin liquidation price. By maintaining a buffer that exceeds historical 30-day maximum drawdowns, positions remain insulated from stop-hunting market sweeps.
Furthermore, setting a hard stop-loss order well before the liquidation price ensures that, if market structure breaks, the position is liquidated voluntarily with minimal losses, rather than surrendering trading capital and liquidation penalties to the exchange insurance fund.
By combining conservative leverage multipliers below 5x, establishing dedicated isolated margin accounts, and auditing real-time liquidation heatmaps, traders transform margin management from an emotional hazard into a robust mathematical edge.
Regulatory & Investment Disclaimer: Public data · not investment advice. All liquidation calculations, formulas, and margin schedules are derived from public documentation published by major derivatives exchanges under standard contract specifications.