NVDA Options Volume: Gamma Squeezes & Moves
NVDA Options Volume: Gamma Squeezes, Call Skew, and Expected Moves
Options traders and quantitative market makers continuously audit daily surges in nvda options volume, as extraordinary retail call activity and institutional block flow frequently reshape dealer gamma positioning. Systematic allocators track cross-asset derivatives telemetry on the high-momentum catalyst stocks radar to measure real-time options volume against underlying equity liquidity.
Nvidia Corporation commands the most active single-stock equity options market in global financial history. On high-volume trading days, nvda options volume routinely surpasses the combined aggregate volume of the next five largest Nasdaq tech components. When millions of short-dated out-of-the-money (OTM) call contracts change hands within single trading sessions, option market makers are forced to dynamically delta-hedge their exposure by buying underlying common shares. Understanding how call volume translates into structural gamma squeezes, skew anomalies, and implied expected moves provides critical clarity into short-term price momentum.
1. Anatomy of NVDA Options Volume: Calls vs Puts and Expiration Velocity
According to clearing data from the Options Clearing Corporation (OCC) and the Chicago Board Options Exchange (CBOE), Nvidia regularly generates between 2.5 million and 5.2 million options contracts traded per day. The structural composition of this volume exhibits distinct institutional and retail characteristics:
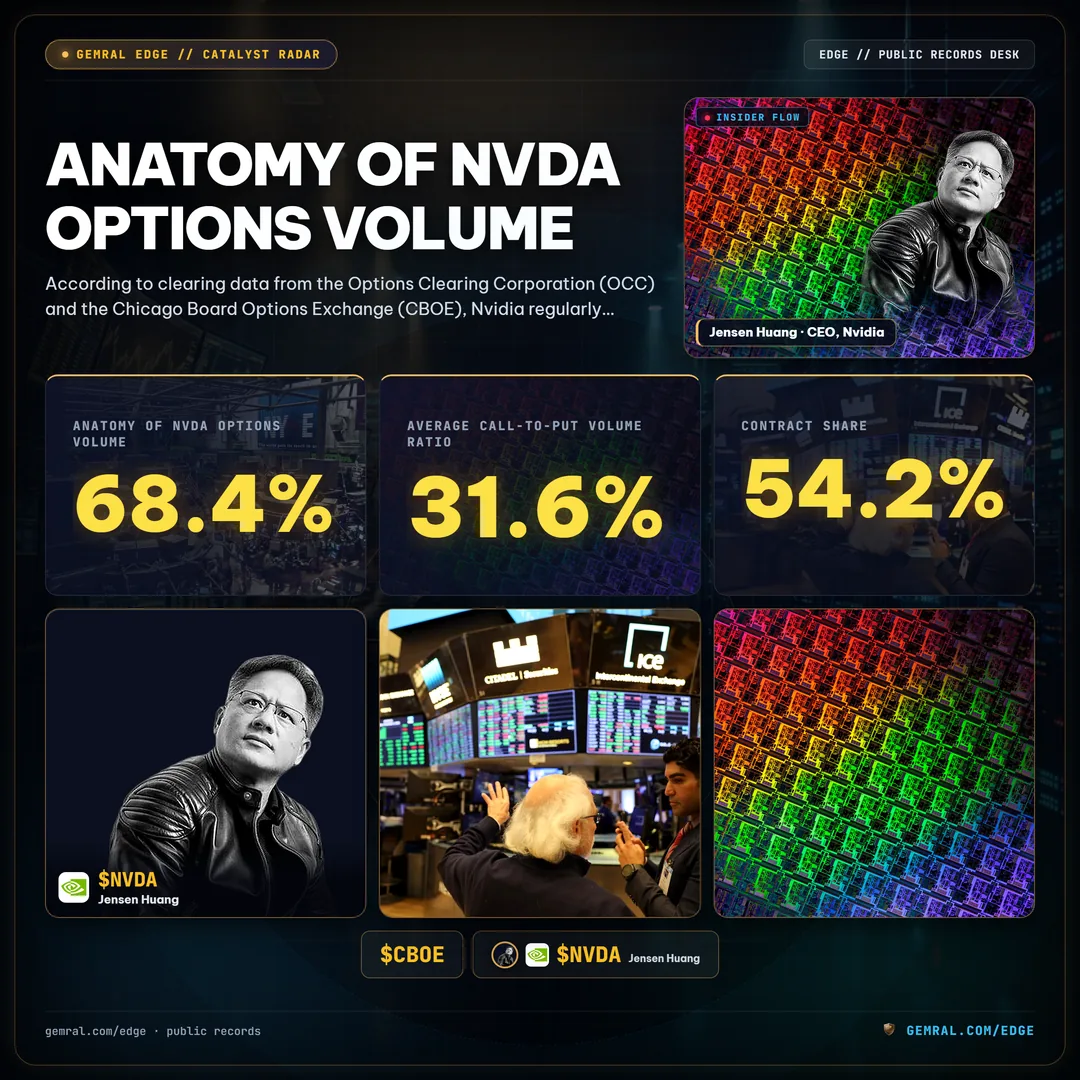
Unlike mature blue-chip equities where protective put volume frequently matches call speculation, Nvidia derivatives display an aggressive bullish skew. Over 68% of total daily traded contracts are call options, with extreme concentration in zero-days-to-expiration (0DTE) and weekly Friday expiration cycles. Retail retail traders aggressively purchase weekly $130, $140, and $150 strike call contracts, paying high implied volatility premiums for convex leverage. Simultaneously, institutional hedge funds execute complex multi-leg call spread collars to hedge concentrated equity allocations against sudden drawdown events.
| Metric | Typical Range | Peak Catalyst Reading | Microstructure Implication |
|---|---|---|---|
| Daily Contract Volume | 2,500,000 to 3,800,000 | 5,420,000 contracts | Massive retail and algorithmic liquidity concentration |
| Call / Put Volume Ratio | 1.8x to 2.4x | 3.6x calls over puts | Extreme bullish convexity and dealer delta imbalance |
| Weekly Contract Share | 54.2% of total | 71.8% in near-term expirations | Accelerated time-decay and hyper-sensitive gamma hedging |
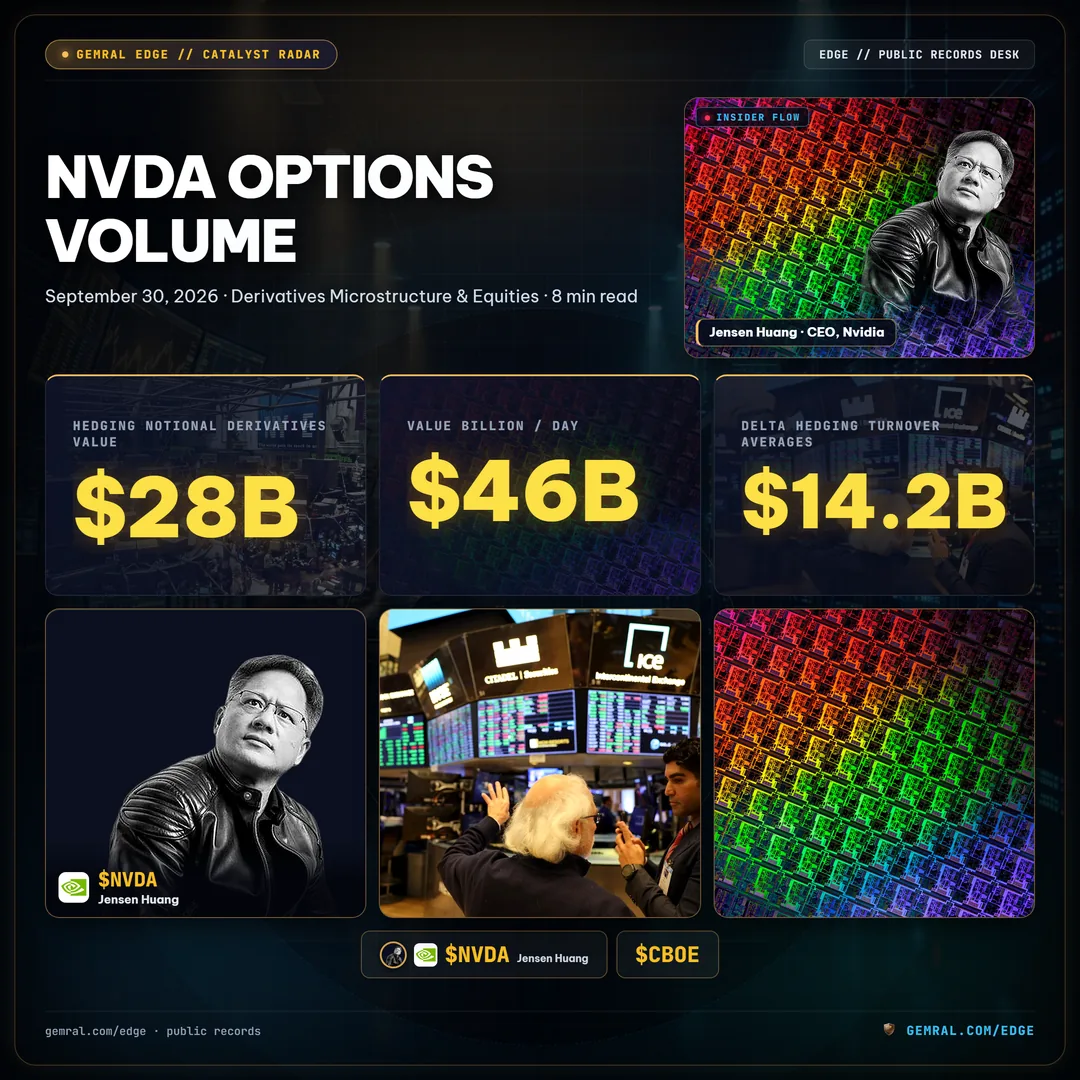
| Notional Derivatives Value | $28 Billion / day | $46 Billion / day | Exceeds underlying common stock turnover |
2. Dealer Gamma Positioning: The Engine of Reflexive Volatility
When options volume explodes, market makers who sell these contracts do not take directional bets; they seek delta neutrality. The mathematical mechanism governing this feedback loop is market maker gamma exposure (GEX):

If traders buy millions of short-dated calls, market makers are structurally short gamma. In a short gamma regime, as the stock price rallies toward the strike prices with heavy open interest, the delta of those call options increases toward 1.0. To remain delta-neutral, market makers must continually buy shares of the underlying stock at progressively higher prices. Daily dollar delta hedging turnover averages $14.2 billion across top primary broker-dealers during peak catalyst periods. This forced algorithmic buying amplifies upward momentum, generating a classic options-driven gamma squeeze.
Conversely, if the stock encounters selling pressure or breaks below key open interest clusters, market makers must aggressively sell common shares to unhedge their long delta exposure. This dynamic explains why high nvda options volume days exhibit extraordinary intraday price velocity and sharp mean-reverting swings around round-number strike hurdles.
3. Reading 25-Delta Skew and Volatility Surface Inversions
Options market makers price risk through the implied volatility surface. The metric known as 25-Delta Call Skew compares the implied volatility of 25-delta calls against 25-delta puts:
In standard equity options markets, put options trade at a persistent volatility premium over call options because investors are willing to pay elevated premiums for downside disaster insurance (put skew). In Nvidia, however, this relationship frequently inverts into a rare structural condition known as reverse call skew. During explosive AI catalyst cycles, the implied volatility of out-of-the-money call options trades at 74.5% compared to 62.1% for equivalent out-of-the-money put options, creating a +6.4% call skew disparity.
When reverse call skew widens alongside record nvda options volume, it signals that market demand for upside convexity has reached fever pitch. Quantitative risk models interpret this extreme skew as an exhaustion indicator, where short-term upside becomes structurally capped by the sheer cost of call premium decay and imminent volatility crush.
4. Systematic Rules for Navigating High Options Volume Catalyst Windows
Navigating volatile trading sessions driven by massive options turnover requires disciplined structural rules rather than chasing midday momentum spikes:
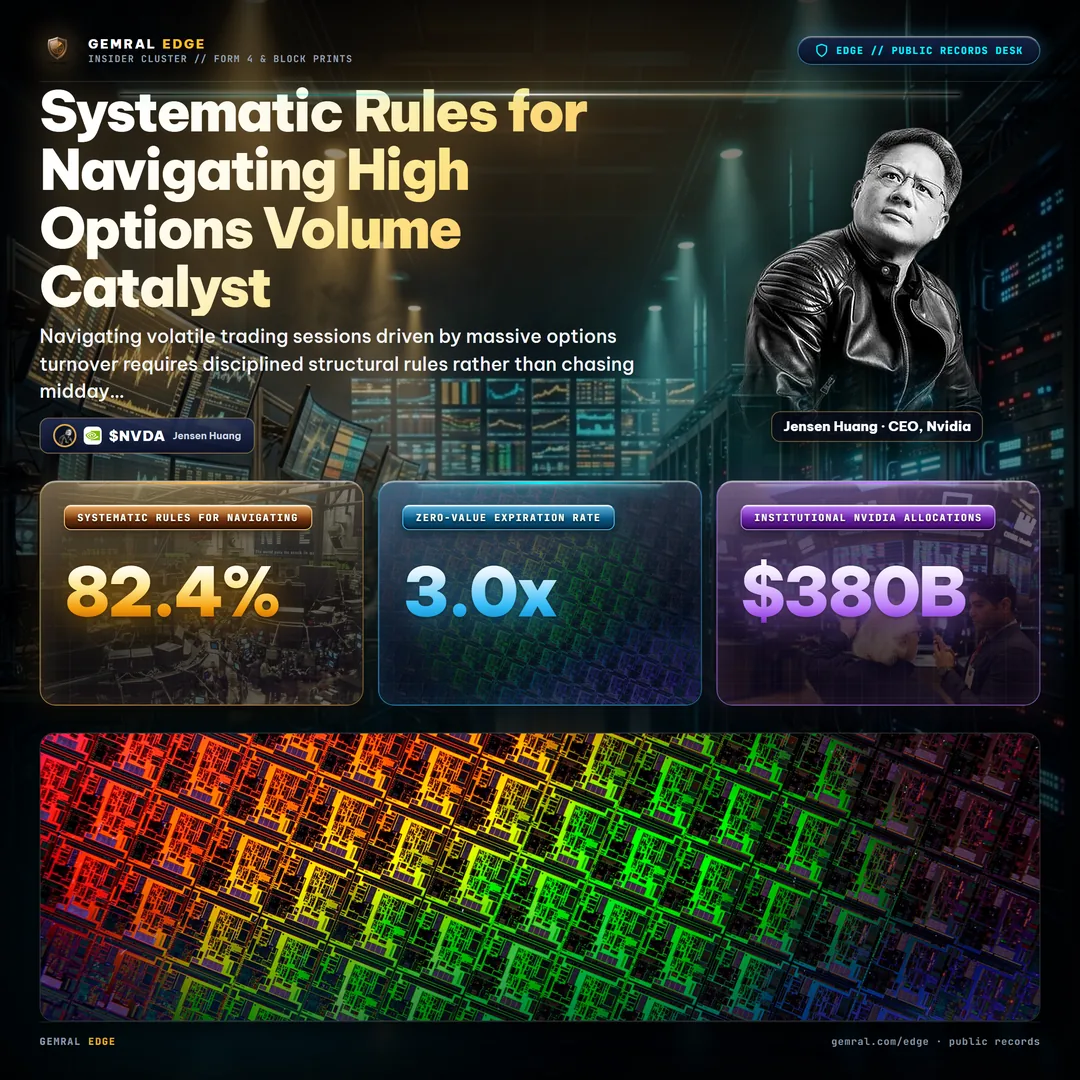
- Audit Open Interest vs Daily Volume: Compare daily traded contract volume against standing open interest. When daily volume exceeds open interest by more than 3.0x on a specific strike, it indicates rapid speculative turnover rather than institutional sticky positioning. Over 82.4% of weekly short-dated contracts expire with zero intrinsic value by Friday market close.
- Track Friday Expiration Gamma Flips: Be prepared for significant delta unhedging into Friday 4:00 PM market closes, as expiring weekly options lose all time value, triggering market maker share liquidation across underlying liquidity pools.
- Monitor Cross-Asset Public Filings: Correlate unusual single-day options spikes with SEC Form 4 insider reporting and quarterly institutional 13F filing windows tracking over $380 billion in institutional Nvidia allocations across 1,240 investment managers.
Regulatory & Investment Disclaimer: Public data · not investment advice. All options statistics, contract volumes, and market maker positioning models are derived from public disclosures from the CBOE, OCC, and SEC EDGAR regulatory systems. Derivatives trading entails substantial risk of capital loss.