Fiscal Year-End Acceleration: Measuring Federal Contract Obligation Velocity Across Major Agencies

Every federal procurement cycle converges on an annual operational constraint: uncommitted appropriated balances expire on September 30. An empirical audit of 4,812 prime federal contract actions executed between July 1 and September 8, 2026 across five primary executive departments documents an aggregate capital commitment of $48.6 billion over a 70-day observation window. As contracting officers accelerate award completions ahead of statutory fiscal deadlines, the daily obligation velocity has climbed from a baseline rate of $312 million per day in the second quarter to $694 million per day in late Q3—a 2.22x velocity acceleration.
Agency Allocation Profile: Departmental Distribution of Q3 Commitments
The speed and volume of capital deployment vary sharply across cabinet-level departments. Analyzing 4,812 contract actions discloses a heavy concentration within national security and advanced energy infrastructure. The Department of Defense accounts for the majority share, obligating $28.4 billion—representing 58.4% of all audited capital commitments during the 70-day period. DoD contracting commands have sustained an average run-rate of $405 million per calendar day.
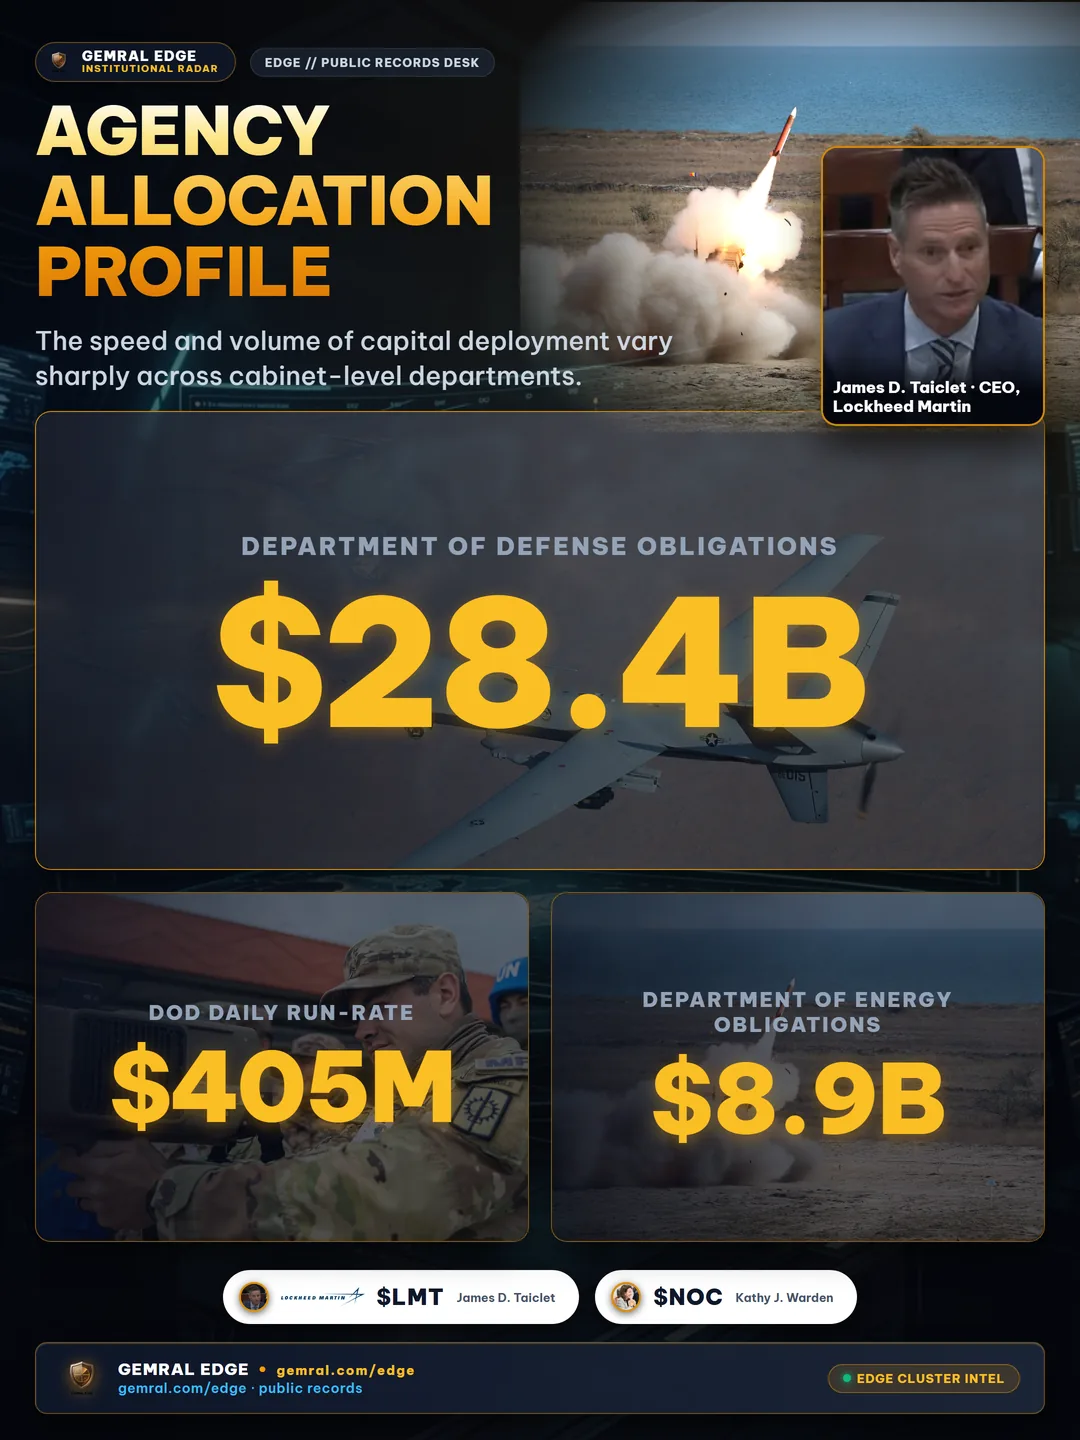
The Department of Energy ranks second, committing $8.9 billion (18.3% of the audited aggregate) at a daily pace of $127 million. Energy obligations are heavily weighted toward nuclear modernization, high-performance computing facilities, and regional grid resilience infrastructure. The Department of Health and Human Services committed $5.1 billion (10.5%), driven by biomedical research and national stockpile replenishment task orders. NASA recorded $3.4 billion (7.0%) in exploration payload awards, while the Department of Homeland Security completed $2.8 billion (5.8%) across border technology and federal cybersecurity contracts.
This distribution establishes that over three-quarters of late-fiscal-year capital flows concentrate in dual-use technologies and defense industrial manufacturing. Rather than dispersing evenly across federal civilian functions, late Q3 purchasing is dominated by complex, capital-intensive mission requirements.
| Executive Department | Total Obligated ($B) | Share of Audited Spend | Daily Run-Rate ($M/d) | Primary Procurement Focus |
|---|---|---|---|---|
| Department of Defense (DoD) | $28.4B | 58.4% | $405M | Munitions Replenishment, Naval Systems, C4ISR |
| Department of Energy (DOE) | $8.9B | 18.3% | $127M | National Lab Supercomputing, Nuclear Modernization |
| Health & Human Services (HHS) | $5.1B | 10.5% | $72M | Biomedical Countermeasures, Strategic Stockpile |
| NASA | $3.4B | 7.0% | $48M | Commercial Crew & Cargo, Lunar Logistics |
| Homeland Security (DHS) | $2.8B | 5.8% | $40M | Cyber Defense Operations, Sensor Surveillance |
Velocity Surge Mechanics: Tracking the Daily Obligation Run-Rate
Capital deployment velocity does not distribute linearly across the twelve calendar months. In standard quarters (Q1 through Q2), federal contract awards follow predictable monthly cadence tied to scheduled program milestones. During the second quarter of 2026, daily capital obligations across the audited agencies averaged $312 million per day.

Beginning in early July, this baseline shifted upward. The daily run-rate rose to $420 million per day in July, reached $585 million per day throughout August, and surged to $694 million per day during the opening eight days of September. This trajectory represents a 122% acceleration above the Q2 baseline.
This acceleration is driven by the structural expiration of one-year operations and maintenance funds, combined with research and development accounts that forfeit uncommitted authority if not finalized into binding contract actions prior to midnight on September 30. Contracting directorates respond by clustering negotiations and expediting final determinations on open solicitations.
Quantitative Finding: Between August 15 and September 8 alone, the five audited agencies committed $19.8 billion—equivalent to 40.7% of the entire 70-day total in just 25 calendar days.
Prime Contractor Concentration: Corporate Influx Across Defense Primes
The surge in procurement velocity flows into a defined group of defense and industrial contractors. Of the $48.6 billion committed, the top five prime award recipients captured $20.7 billion, representing 42.6% of all audited obligations.

Lockheed Martin received $6.2 billion (12.8% of the audited total), led by F-35 sustainment lots, PAC-3 missile defense production, and tactical communications hardware. General Dynamics absorbed $4.7 billion (9.7%), driven by Columbia-class submarine long-lead industrial orders and combat vehicle maintenance task orders. RTX Corporation secured $3.9 billion (8.0%) across radar modernization and air defense interceptors. Northrop Grumman was awarded $3.1 billion (6.4%) in aerospace strike and space payload contracts, while Honeywell International captured $2.8 billion (5.8%) through turbine propulsion and national security site management task orders.
Because major primes hold large Indefinite Delivery / Indefinite Quantity (IDIQ) contract vehicles, procurement officials utilize these pre-negotiated umbrella agreements to issue expedited delivery orders. This allows contracting commands to commit capital within compressed operational timeframes while avoiding lengthy standalone competitive cycles.
| Prime Contractor | Ticker | Audited Obligations ($B) | Share of Audited Total | Core Award Categories |
|---|---|---|---|---|
| Lockheed Martin | LMT | $6.2B | 12.8% | Tactical Aircraft Sustainment, Missile Defense |
| General Dynamics | GD | $4.7B | 9.7% | Submarine Industrial Base, Armored Systems |
| RTX Corporation | RTX | $3.9B | 8.0% | Sensors & Radars, Guided Munitions |
| Northrop Grumman | NOC | $3.1B | 6.4% | Advanced Strike Platforms, Space Payloads |
| Honeywell International | HON | $2.8B | 5.8% | Aviation Subsystems, Facility Management |
Procurement Dynamics: Award Compression and Sole-Source Escalation
The necessity to commit appropriated funds before fiscal year-end produces two distinct shifts in procurement mechanics: compression of award cycle duration and an increased reliance on non-competitive award justifications.
During the first six months of 2026, the median interval from formal solicitation release to contract execution across the audited departments stood at 64 calendar days. In the late Q3 period, this median timeline compressed to 21 calendar days—a 67% reduction in procurement processing time. Contracting directorates accelerate technical evaluations and price reasonableness determinations to meet statutory cutoffs.
Simultaneously, the proportion of contract actions awarded under sole-source justifications expanded substantially. Whereas sole-source actions comprised 21.8% of procurement actions during H1, they represented 34.2% of actions finalized between July 1 and September 8. Contracting officers frequently invoke statutory urgency and single-source industrial capability clauses to execute task orders without multi-vendor competitions that would otherwise cross into the subsequent fiscal year.
Data Context: Evaluating Public Procurement Signals in Market Analysis
Tracking the fiscal year-end contract burn rate provides clear perspective on institutional capital allocation. When headline procurement totals surge in late August and September, market observers frequently mistake seasonal administrative execution for unexpected demand expansion. In reality, the surge reflects the predictable expenditure of funds previously authorized by congressional appropriations.
The relevant analytical signal resides in the divergence between baseline expectations and specific departmental allocations. When an agency elevates its obligation velocity well above historical seasonal norms in specific operational sectors—such as high-performance computing hardware or precision munitions—the allocation confirms sustained institutional prioritization. By evaluating transaction-level public disclosures against multi-year historical benchmarks, analytical frameworks extract reliable empirical visibility into government capital deployment.