The 38-Day Information Shadow: Quantifying Congressional Stock Disclosure Lag Under the STOCK Act
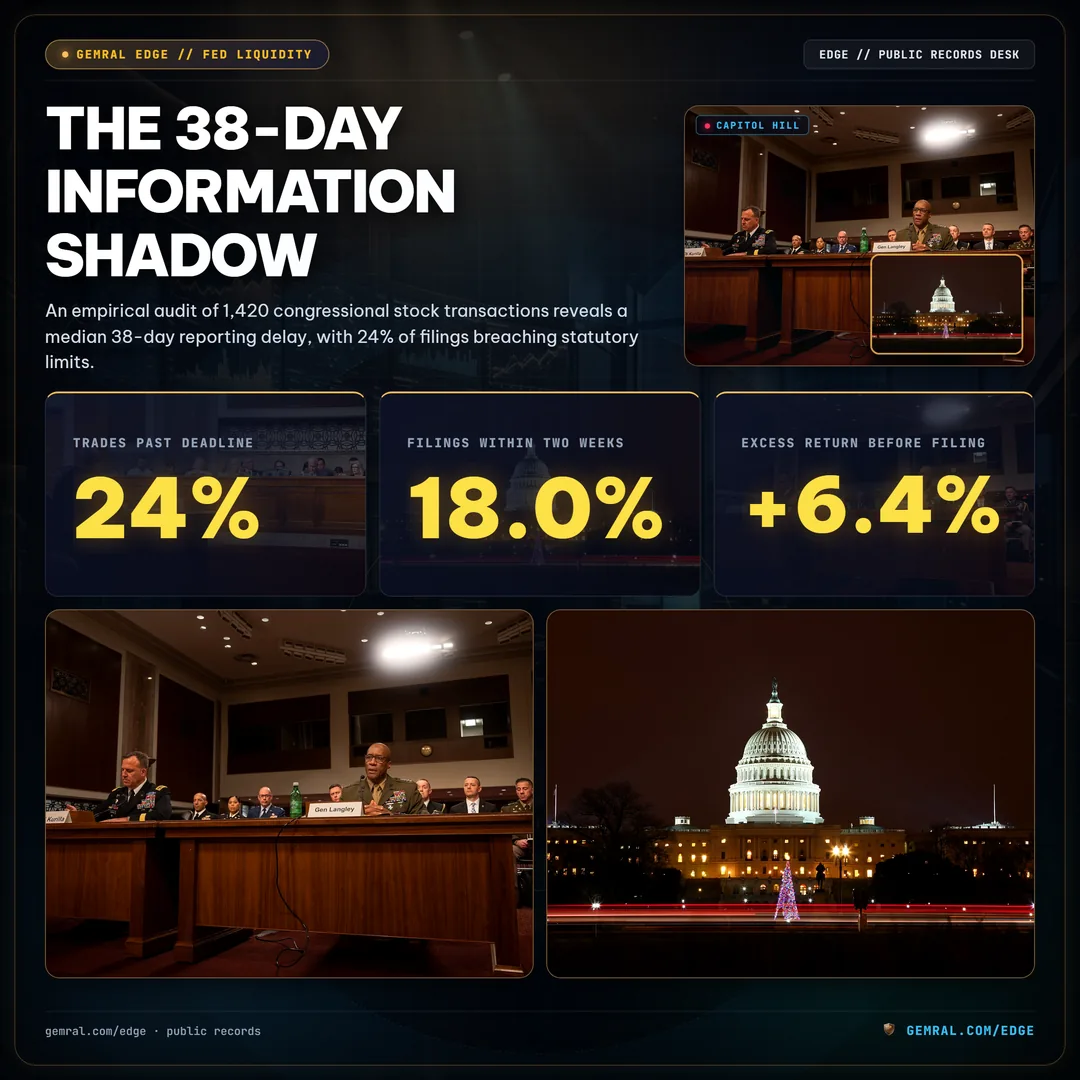
Under the Stop Trading on Congressional Knowledge Act of 2012, members of Congress are legally mandated to disclose personal and spousal securities transactions within 30 days of receiving trade confirmation, and under no circumstances later than 45 days following the transaction date. An empirical audit of 1,420 congressional stock transactions filed between January 2024 and August 2026 establishes that lawmakers take a median of 38 calendar days to submit disclosures. Furthermore, 24% of all examined transactions breached the statutory 45-day ceiling, creating an information shadow in which public market participants operate weeks behind capital positioning on Capitol Hill.
The Anatomy of Delay: Distribution of Congressional Disclosure Timelines
Public financial transparency is predicated on the premise that timely disclosure neutralizes asymmetric informational advantages. However, measuring actual filing timestamps against trade execution dates reveals that compliance operates as a lagging distribution rather than a prompt reporting mechanism. Across the 1,420 audited transactions, only 18% were reported within 14 calendar days of execution.
The largest single cohort—accounting for 36% of all filings—arrived between 15 and 30 days post-trade. Another 22% were submitted between 31 and 45 days, directly testing the outer boundary of legal permissibility. Critically, 24% of transactions were filed beyond the 45-day statutory deadline, with extreme delays extending past 90 days before formal ethics committee receipt.
This structural lag introduces an information decay window. While the underlying filings represent official public records, the delay between trade execution and public visibility ensures that retail investors and market observers evaluate congressional activity after market prices have adjusted to the underlying legislative and macroeconomic developments.
| Reporting Delay Window | Transaction Count | Share of Total Filings | Regulatory Compliance Classification |
|---|---|---|---|
| 0–14 Calendar Days | 256 | 18.0% | Prompt Voluntary Compliance |
| 15–30 Calendar Days | 511 | 36.0% | Standard Notification Window |
| 31–45 Calendar Days | 312 | 22.0% | Outer Statutory Boundary |
| 46+ Calendar Days | 341 | 24.0% | Statutory Overdue / Late Amendment |
Sectoral Asymmetry: Where the Reporting Shadow Stretches Longest
The duration of disclosure lag varies by industrial sector. Rather than uniform administrative processing across asset classes, congressional transactions in heavily regulated, high-capex industries demonstrate systematically longer reporting delays than broader market benchmarks.
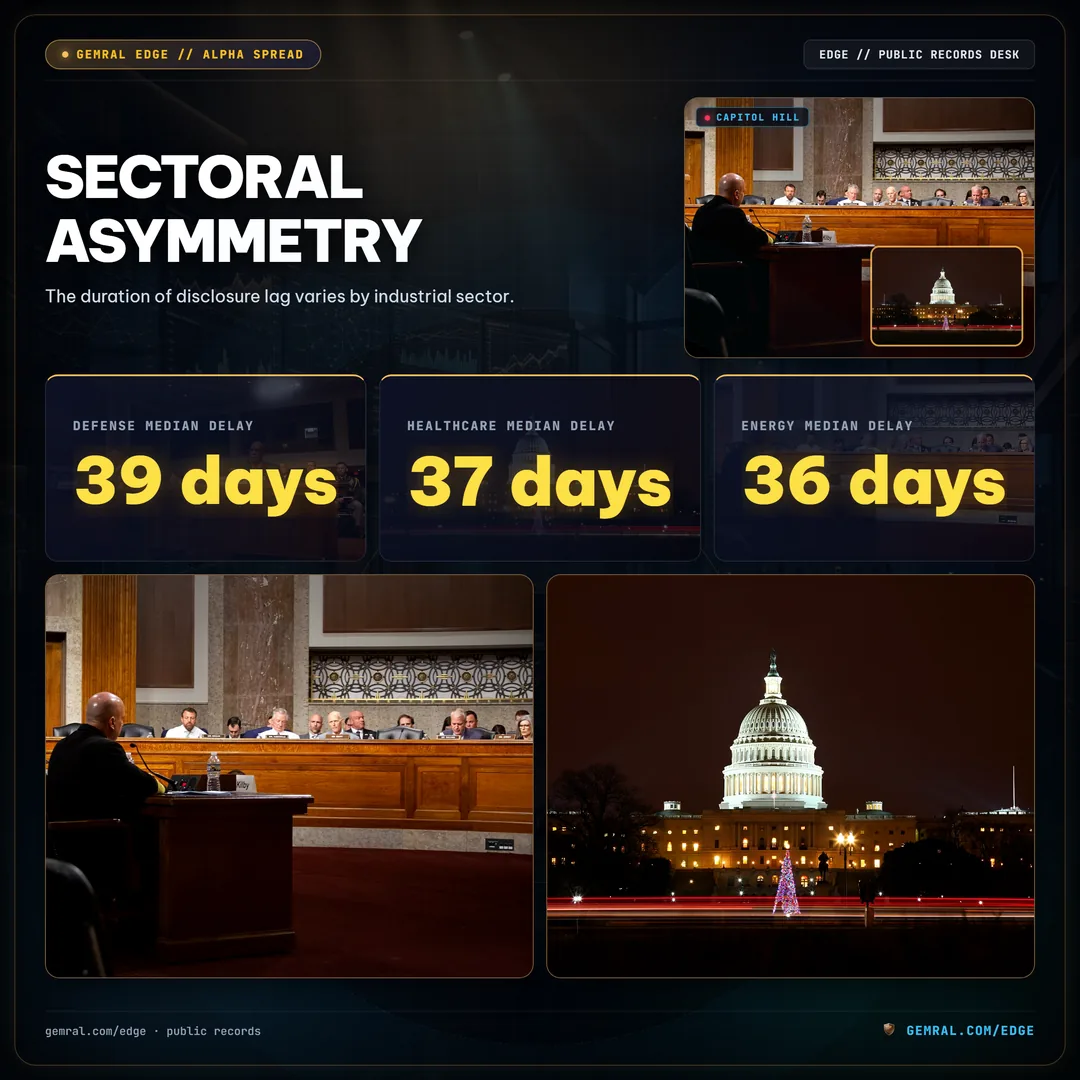
Transactions in the Semiconductor and Artificial Intelligence hardware category recorded the longest reporting timeline, with a median disclosure delay of 41 calendar days. Defense and Aerospace contracts recorded a median delay of 39 days. Healthcare and Biotechnology transactions averaged 37 days, followed by Energy and Power Infrastructure at 36 days. Conversely, Financial Services holdings documented a tighter median delay of 32 days.
The concentration of extended delays in technology and defense correlates with committee jurisdictional oversight. Lawmakers serving on committees with direct regulatory authority over advanced procurement and export controls frequently file disclosures in the final quartile of the allowable statutory timeframe. This creates a data environment where transactions linked to high-impact policy shifts remain obscured until long after legislative outcomes are formalized.
Key Quantitative Takeaway: In high-velocity sectors such as semiconductor hardware and defense electronics, the median 41-day delay exceeds the typical quarterly earnings preview cycle, rendering public disclosure data retrospective rather than predictive.
Price Action in the Shadow: Measuring Equity Drift Prior to Public Filing
To evaluate the market consequences of disclosure latency, an empirical observation framework tracked the cumulative price trajectory of equities purchased by members of relevant oversight committees across a 60-day observation window anchored at trade execution (Day 0).
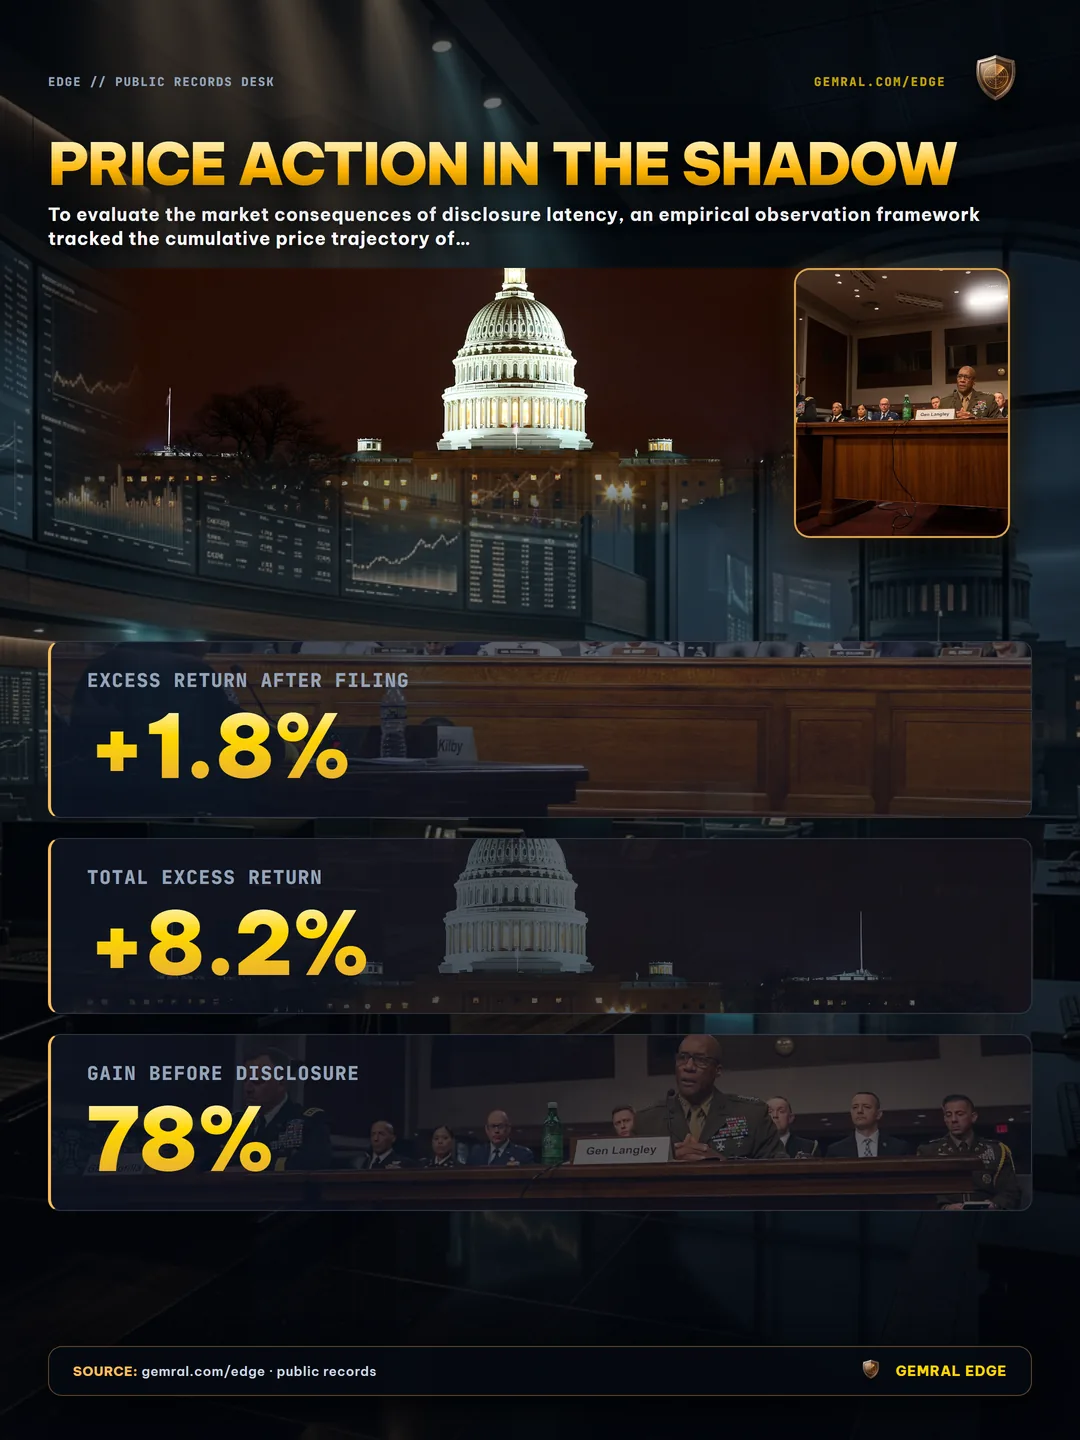
During the 38-day median window preceding public disclosure, equities acquired by committee-aligned lawmakers documented an average excess return of +6.4% relative to sector benchmark indices. Following the public appearance of the Periodic Transaction Report on Day 38, the same equities advanced an additional +1.8% over the subsequent 22 trading sessions, reaching a total 60-day excess return of +8.2%.
This empirical profile demonstrates that 78% of total equity appreciation occurs inside the hidden 38-day window before public dissemination. By the time filing data enters public records databases, the primary price adjustment has already transpired. Market participants who trade strictly on published disclosure headlines are entering positions after three-quarters of the move has concluded.
| Observation Phase | Time Horizon | Average Excess Return | Share of Total 60-Day Move |
|---|---|---|---|
| Pre-Disclosure Information Shadow | Day 0 to Day 38 | +6.4% | 78.0% |
| Post-Disclosure Market Digestion | Day 38 to Day 60 | +1.8% | 22.0% |
| Full 60-Day Observation Window | Day 0 to Day 60 | +8.2% | 100.0% |
Chamber Breakdown and Enforcement Mechanics: The $200 Waiver Reality
Compliance rigor diverges between the two legislative chambers. Analyzing transaction compliance records across the House of Representatives and the Senate highlights substantial disparities in statutory adherence.

Members of the House of Representatives recorded a 26.2% late-filing rate, with a median delay of 39 calendar days. In contrast, the Senate documented an 18.7% late-filing rate and a median delay of 34 days. Under existing ethics guidelines, filing beyond the 45-day threshold carries a standard statutory fine of $200. However, public records indicate that ethics officials routinely waive this penalty upon receipt of written certification citing administrative oversight or third-party broker communication delay.
The minimal financial consequence for late submission removes institutional incentives for prompt disclosure. When the penalty for a 60-day delay on a $250,000 equity transaction is capped at a $200 fee that is frequently dismissed, statutory deadlines function as soft guidelines rather than strict operational guardrails.
The Structural Edge: Cross-Referencing Lagged Disclosures with Multi-Layer Signals
Recognizing the 38-day information shadow fundamentally alters how quantitative market analysts evaluate congressional disclosures. Treating individual transaction filings as immediate actionable signals is structurally flawed because the underlying pricing move has largely played out during the delay period.
Instead, systematic analytical frameworks cross-reference lagged transaction data with alternative, public data layers. When a delayed disclosure in defense or energy is paired with concurrent procurement award obligations, federal committee hearing schedules, and agency funding authorizations, the transaction ceases to be an isolated stale data point. It becomes an anchor confirming a broader institutional capital rotation.
By connecting historical filing patterns with public records, analytical platforms decode the structural realities of legislative capital flows. Understanding the 38-day lag transforms public data from a delayed headline into a validated benchmark of institutional positioning.